Downloaded 803 times

![2/26/2013
36
Load Growth
Dr.A.Arunagiri 71
.
The demand estimation is the starting point for planning
the future electric power supply. The consistency of
demand growth over the years has led to numerous
attempts to fit mathematical curves to this trend. One of
the simplest method is
where a is the average per unit growth rate, P is the
demand in year t, and P0 is
the given demand at year t0.
Definition of some basic concepts in statistics:
Dr.A.Arunagiri 72
n
yi
n
yii
'
n
yi
2
2
)(
2
exp
)(
]/
2
1
[ 22
y
yf
•Mean value
•Weighted mean
•Variance (standard deviation)
•Normaldistribution](https://image.slidesharecdn.com/chapter2student-150204062804-conversion-gate01/75/Load-Characteristics-36-2048.jpg)


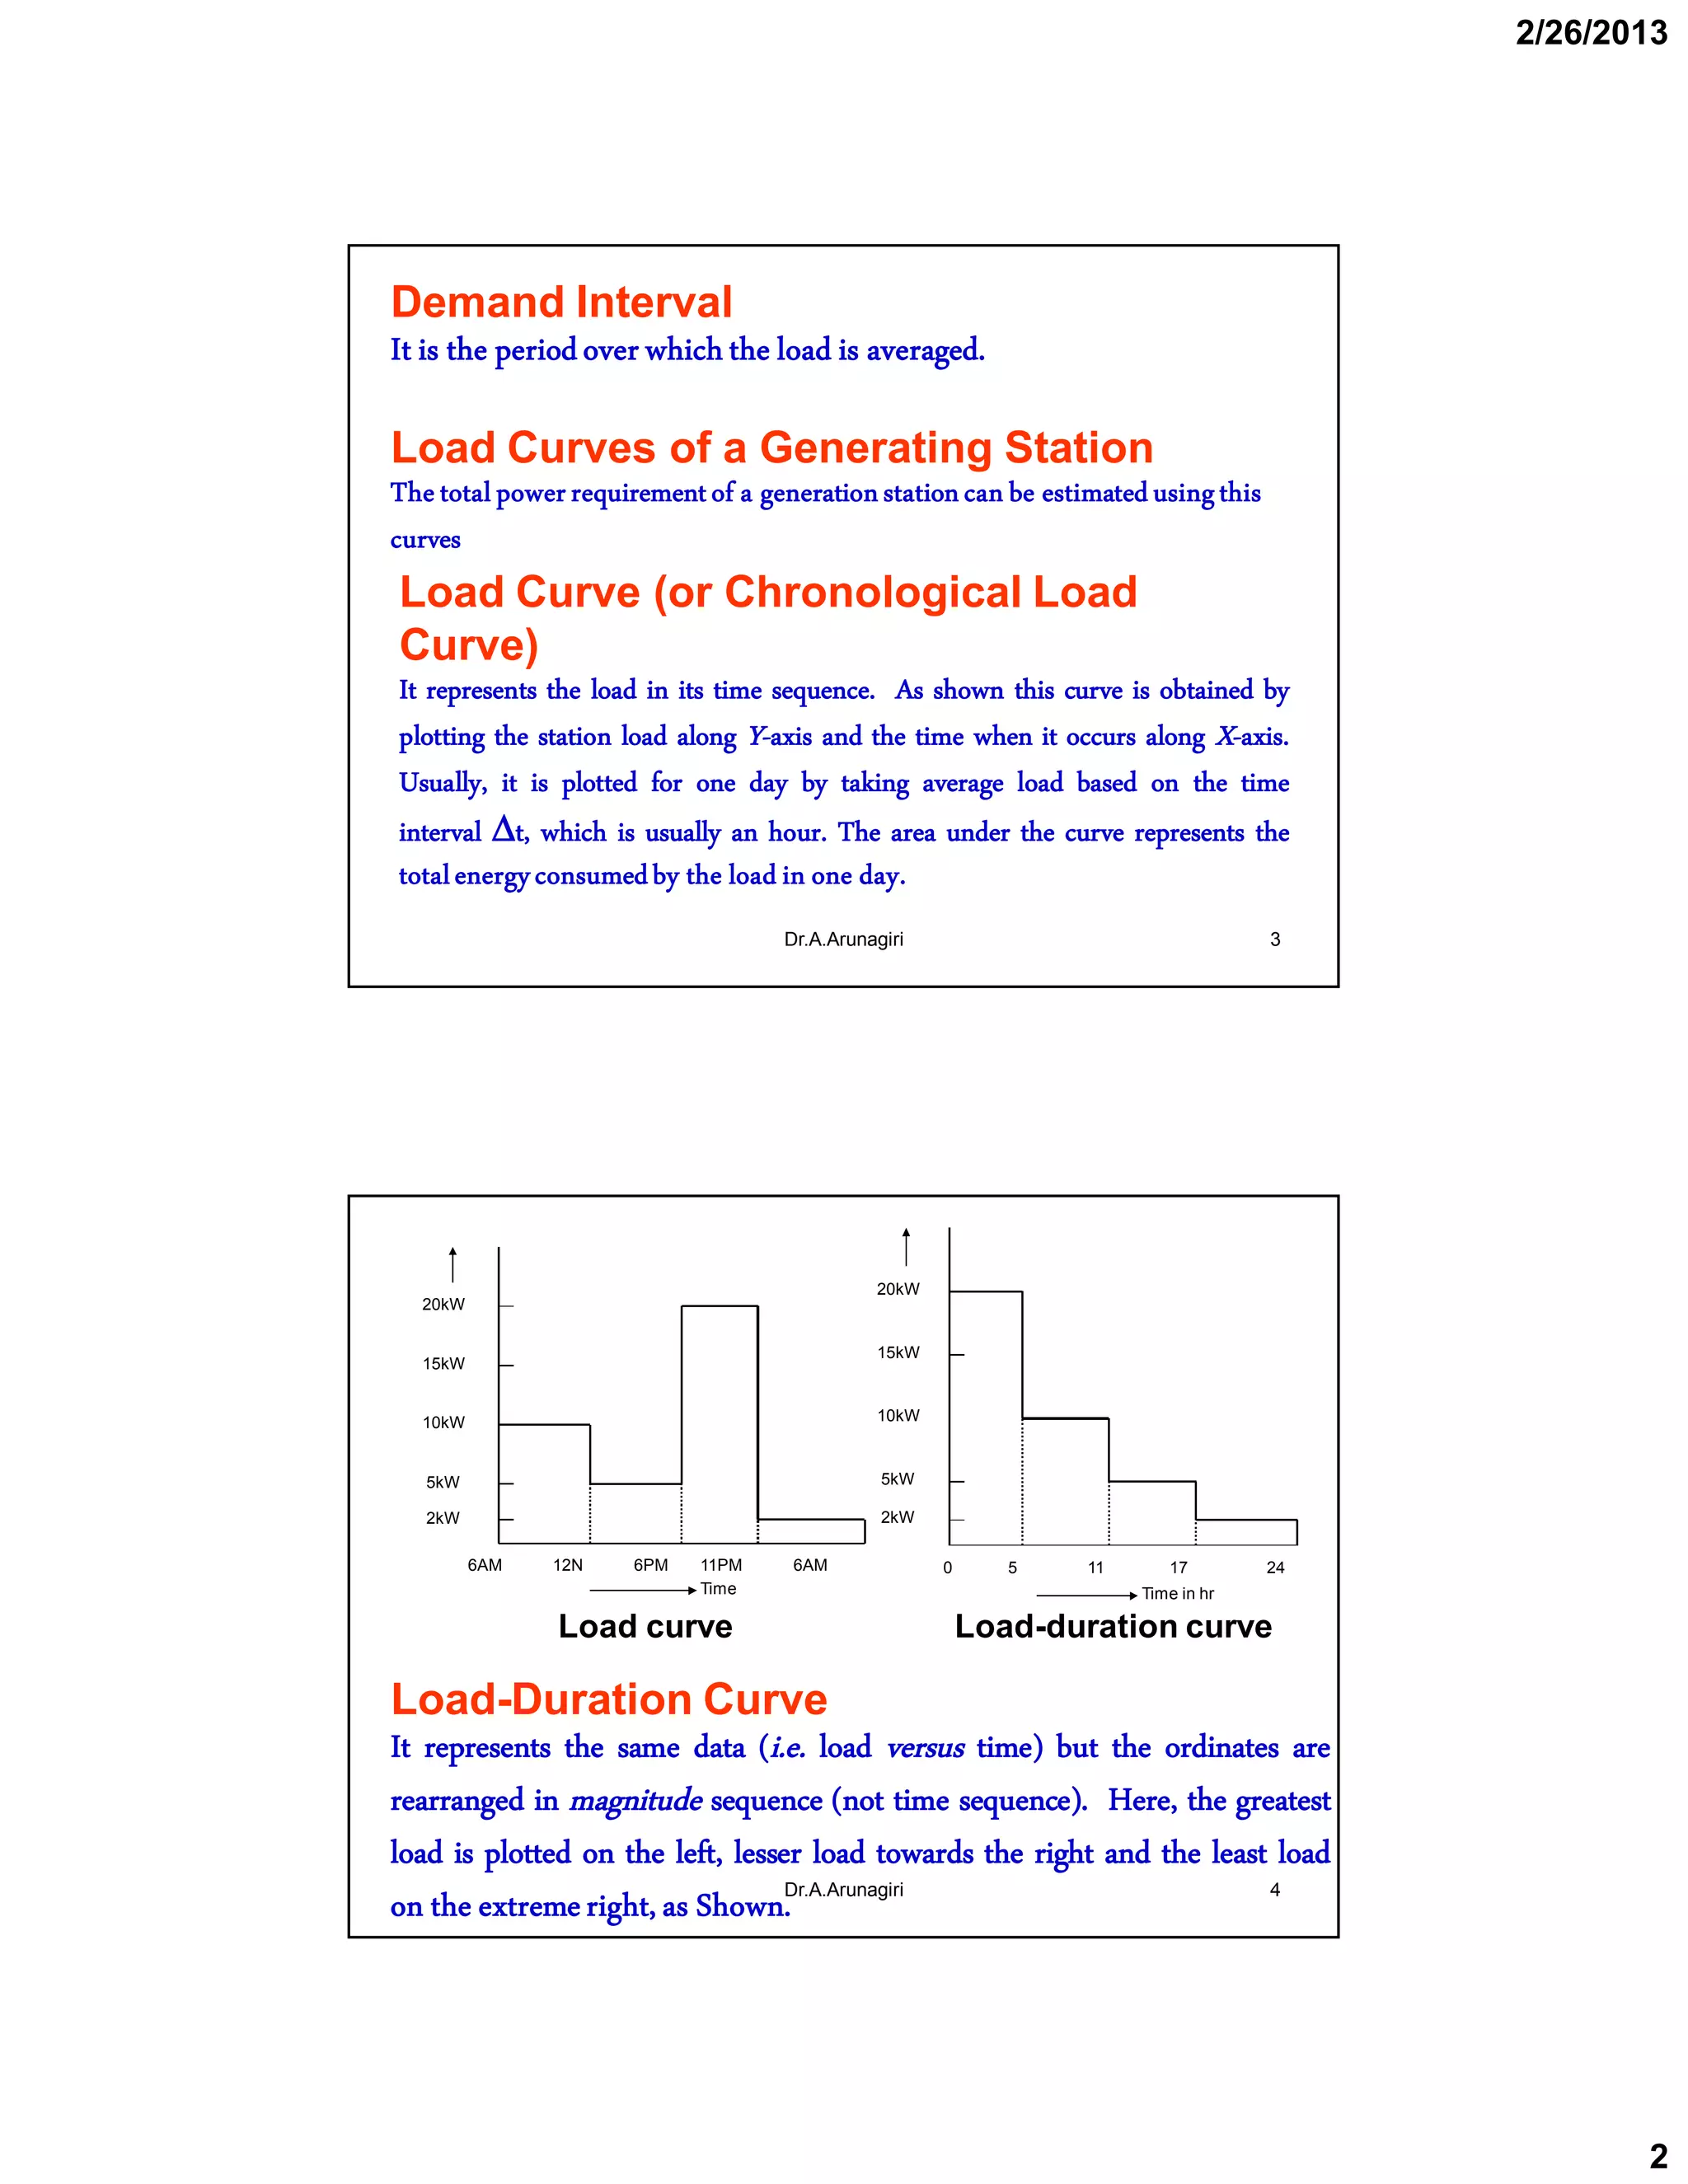
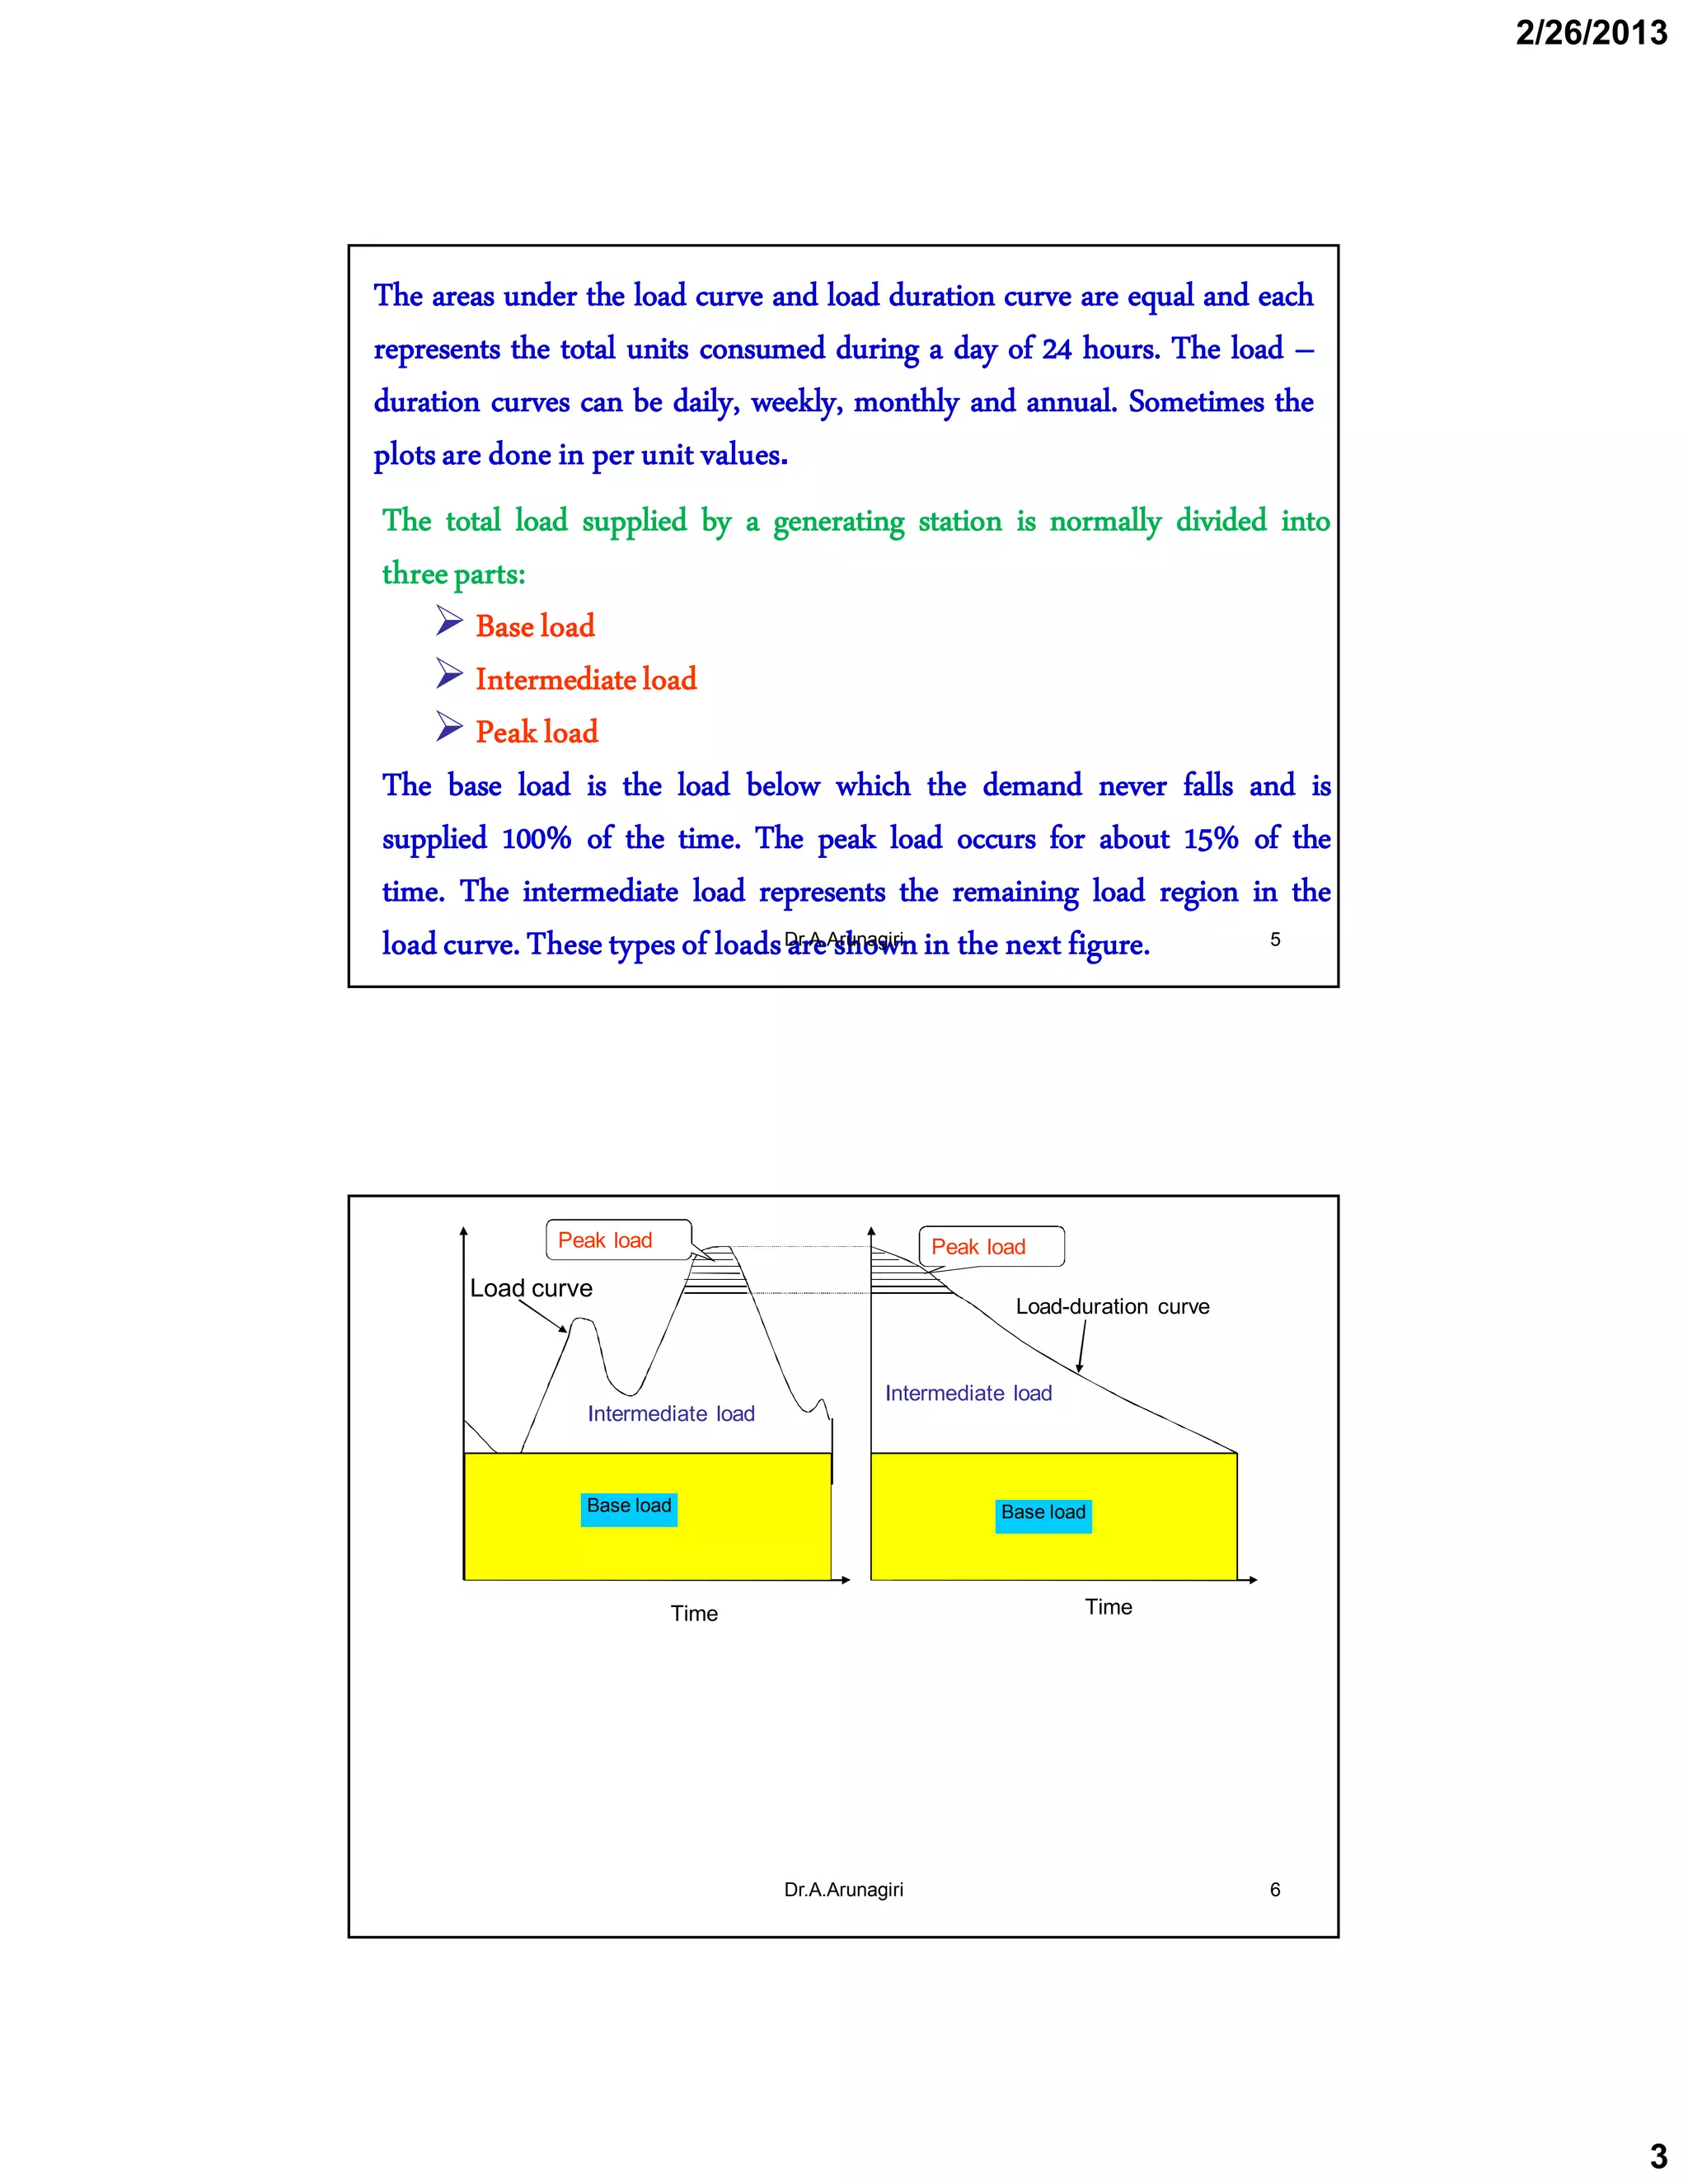
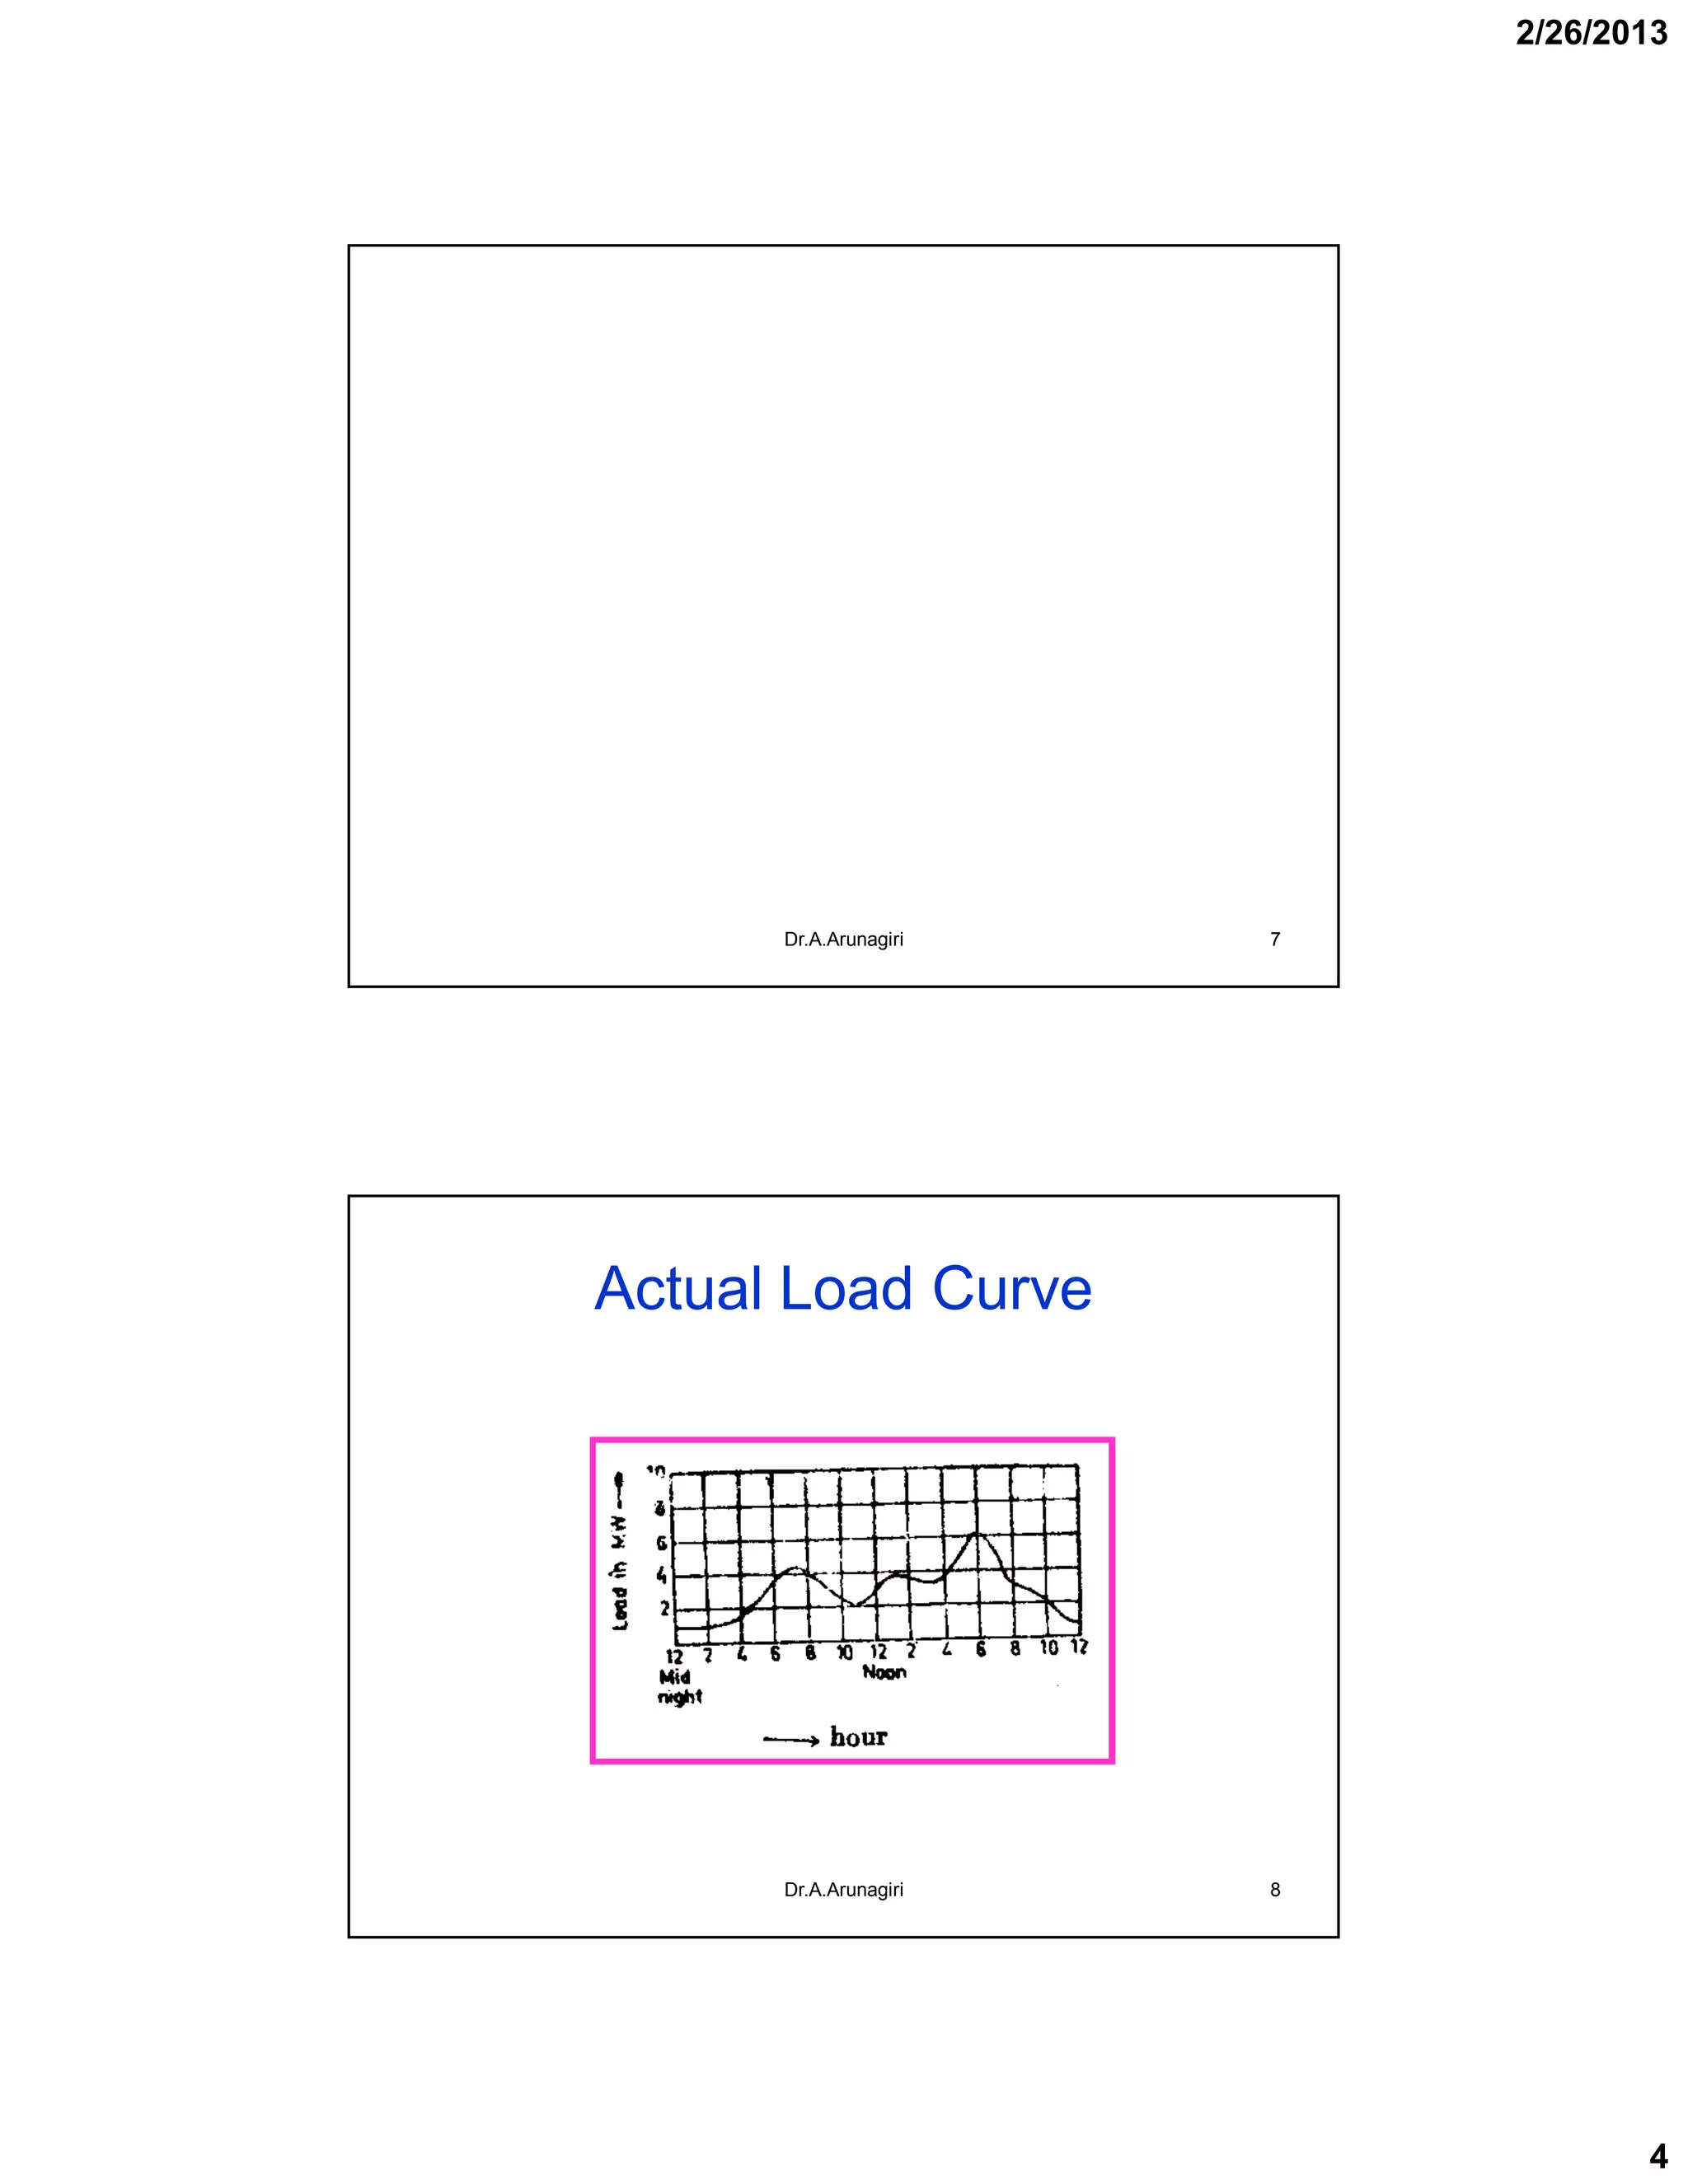
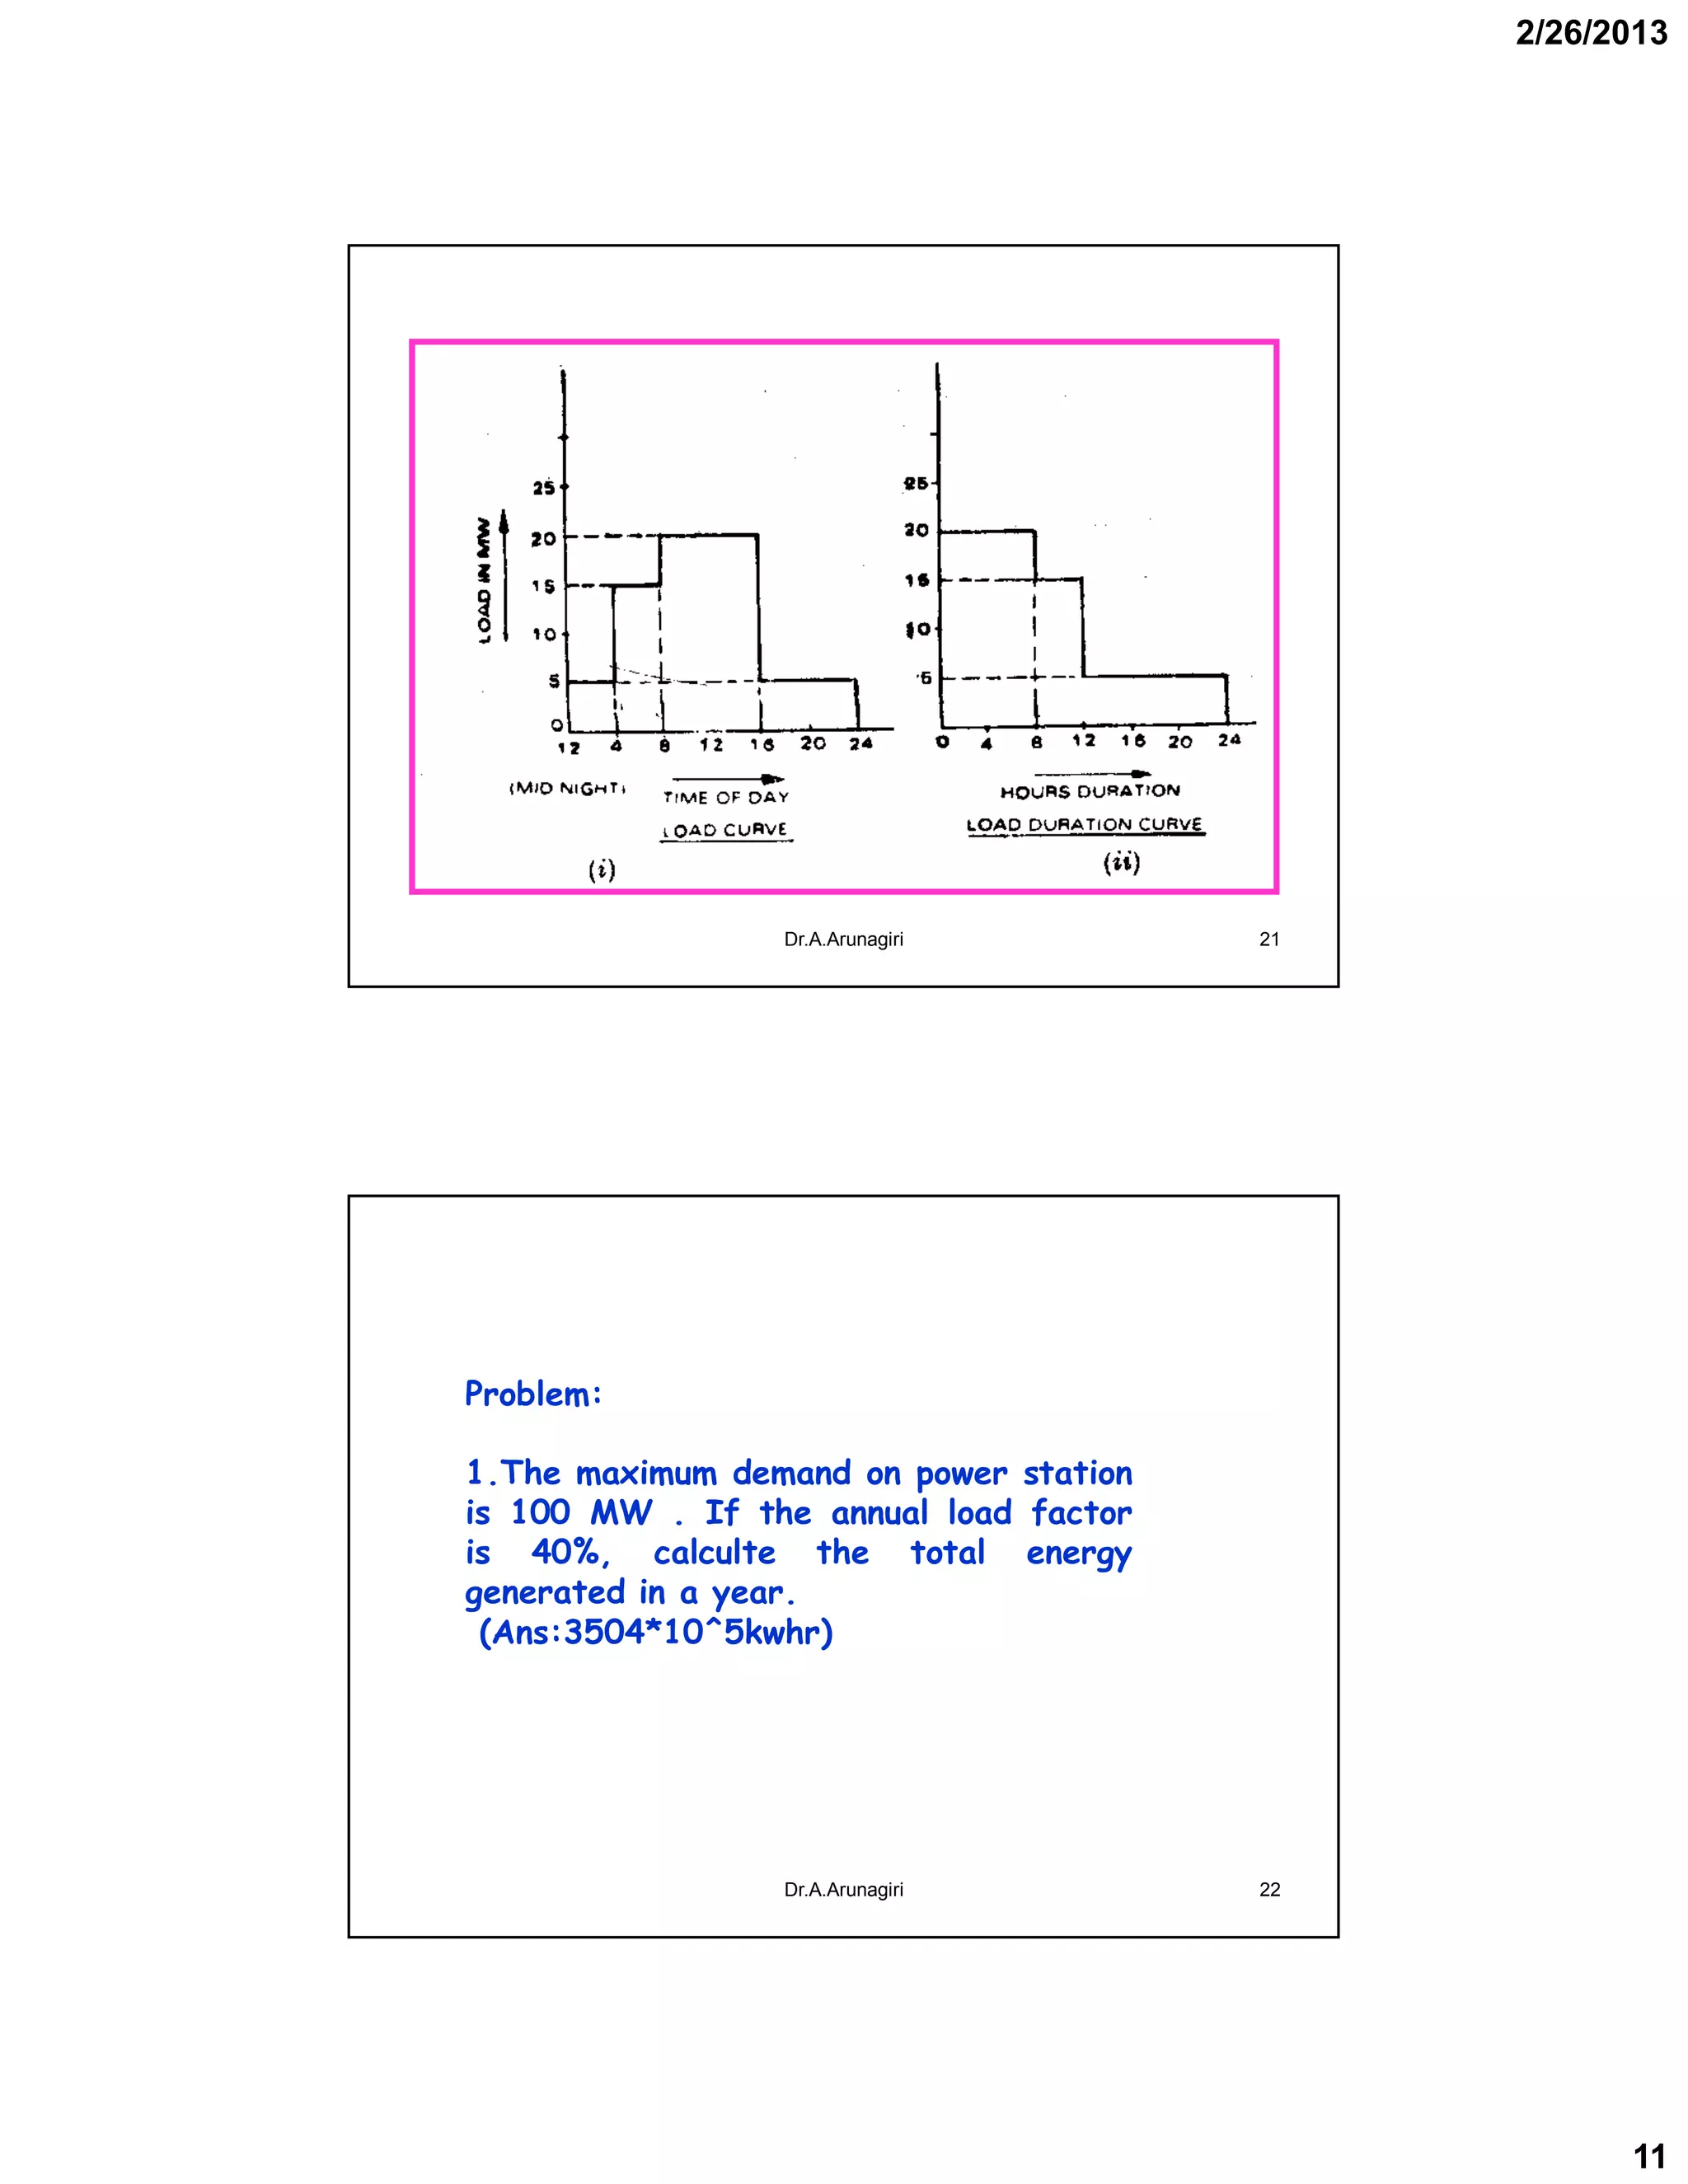
1. The document discusses load characteristics that are important for determining power system requirements, planning plant capacity, and selecting generating unit sizes. It defines terms like demand, demand interval, load curves, and load duration curves. 2. Load curves show the load over time, while load duration curves rearrange the loads from highest to lowest. The total load is divided into base, intermediate, and peak loads. 3. The document also defines terms related to load factors like maximum demand, demand factor, average load, load factor, diversity factor, capacity factor, and plant use factor. It provides examples of calculating some of these factors.

![Power system planning & operation [eceg 4410]](https://cdn.slidesharecdn.com/ss_thumbnails/powersystemplanningoperationeceg-4410-130607134359-phpapp01-thumbnail.jpg?width=640&height=640&fit=bounds)


