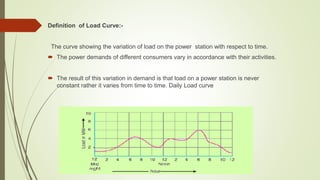
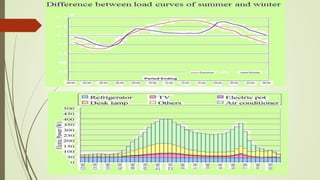
1) A load curve shows the variation of load on a power station over time, with daily, monthly, and yearly curves. It is important for generation planning and economic dispatch.
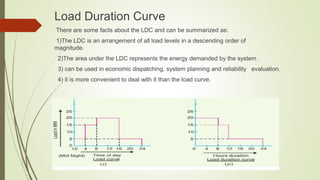
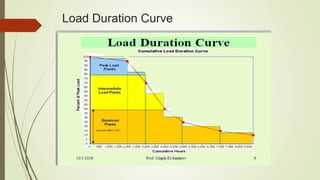
2) A load duration curve arranges all load levels in descending order, with area under the curve representing total energy demanded. It is used for planning, dispatch, and reliability evaluation.
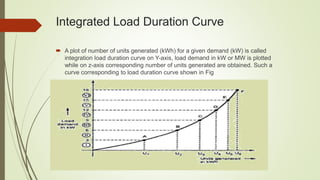
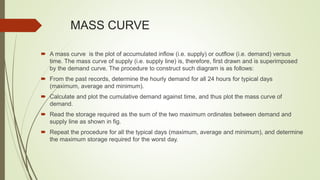
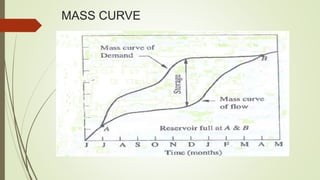
3) An integrated load duration curve plots units generated against load demand, obtained from the load duration curve. A mass curve plots accumulated supply or demand over time and is used to determine required storage capacity.