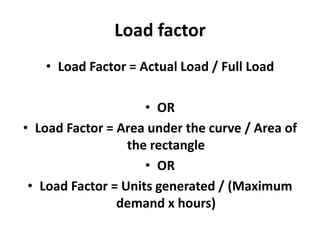
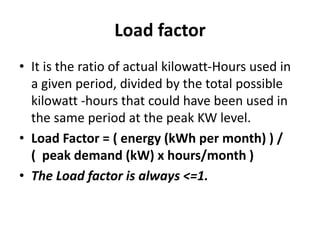
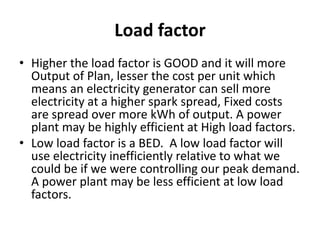
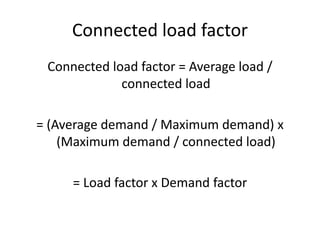
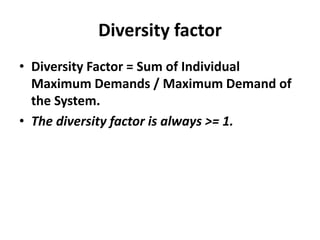
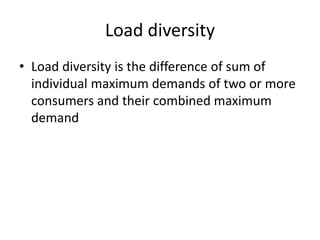
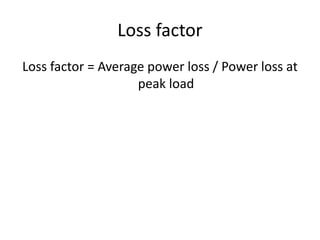
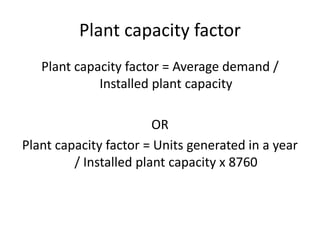
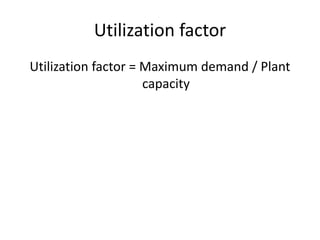
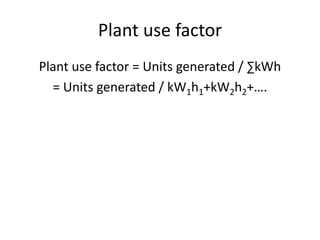
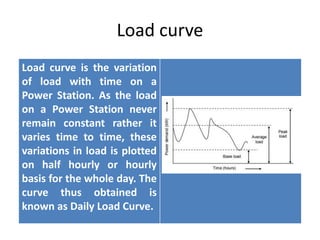
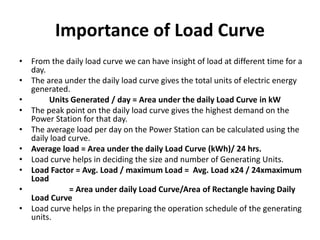
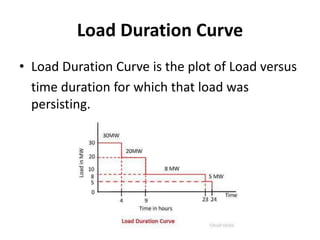
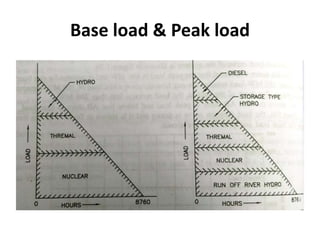
ELECTRICAL POWER
GENERATION
Load curve and Important terms
By D. N. Thakkar
RCTI, Ahmedabad
Connected load
• The sum of continuous ratings of all the
electrical equipments connected to the supply
system is called the connected load
Demand Factor.
• The word “demand” itself says the meaning of
Demand Factor. Demand Factor = Maximum
demand / Total connected load
• For example, an over sized motor 20 Kw drives a
constant 15 Kw load whenever it is ON. The
motor demand factor is then 15/20 =0.75= 75 %.
• Demand Factor is express as a percentage (%) or
in a ratio
• Demand factor is always < =1.
• The lower the demand factor, the less system
capacity required to serve the connected load.
Load factor
• Load Factor = Actual Load / Full Load
• OR
• Load Factor = Area under the curve / Area of
the rectangle
• OR
• Load Factor = Units generated / (Maximum
demand x hours)
Load factor
• It is the ratio of actual kilowatt-Hours used in
a given period, divided by the total possible
kilowatt -hours that could have been used in
the same period at the peak KW level.
• Load Factor = ( energy (kWh per month) ) /
( peak demand (kW) x hours/month )
• The Load factor is always <=1.
Load factor
• Higher the load factor is GOOD and it will more
Output of Plan, lesser the cost per unit which
means an electricity generator can sell more
electricity at a higher spark spread, Fixed costs
are spread over more kWh of output. A power
plant may be highly efficient at High load factors.
• Low load factor is a BED. A low load factor will
use electricity inefficiently relative to what we
could be if we were controlling our peak demand.
A power plant may be less efficient at low load
factors.
Connected load factor
Connected load factor = Average load /
connected load
= (Average demand / Maximum demand) x
(Maximum demand / connected load)
= Load factor x Demand factor
Diversity factor
• Diversity Factor = Sum of Individual
Maximum Demands / Maximum Demand of
the System.
• The diversity factor is always >= 1.
Coincidence factor
• The reciprocal of diversity factor is
coincidence factor
• Coincidence factor = Maximum demand /
Sum of individual maximum demands
• The Coincidence Factor is always <=1.
Load diversity
• Load diversity is the difference of sum of
individual maximum demands of two or more
consumers and their combined maximum
demand
Loss factor
Loss factor = Average power loss / Power loss at
peak load
Plant capacity factor
Plant capacity factor = Average demand /
Installed plant capacity
OR
Plant capacity factor = Units generated in a year
/ Installed plant capacity x 8760
Utilization factor
Utilization factor = Maximum demand / Plant
capacity
Plant use factor
Plant use factor = Units generated / ∑kWh
= Units generated / kW1h1+kW2h2+….
Load curve
Load curve is the variation
of load with time on a
Power Station. As the load
on a Power Station never
remain constant rather it
varies time to time, these
variations in load is plotted
on half hourly or hourly
basis for the whole day. The
curve thus obtained is
known as Daily Load Curve.
Importance of Load Curve
• From the daily load curve we can have insight of load at different time for a
day.
• The area under the daily load curve gives the total units of electric energy
generated.
• Units Generated / day = Area under the daily Load Curve in kW
• The peak point on the daily load curve gives the highest demand on the
Power Station for that day.
• The average load per day on the Power Station can be calculated using the
daily load curve.
• Average load = Area under the daily Load Curve (kWh)/ 24 hrs.
• Load curve helps in deciding the size and number of Generating Units.
• Load Factor = Avg. Load / maximum Load = Avg. Load x24 / 24xmaximum
Load
• = Area under daily Load Curve/Area of Rectangle having Daily
Load Curve
• Load curve helps in the preparing the operation schedule of the generating
units.
Load Duration Curve
• Load Duration Curve is the plot of Load versus
time duration for which that load was
persisting.
Base load & Peak load
• Base load is the minimum level of electricity
demand required over a period of 24 hours. It
is needed to provide power to components
that keep running at all times (also referred as
continuous load). Peak load is the time of
high demand.
Base load & Peak load
Characteristics of Base load station
• Operating throughout the year
• Load factor is high
• Efficiency is high
• Cost of unit generation is less
• Capital cost is high
• Capacity is high
• Difficult to start and stop
TPS in Gujarat

Load factor and demand factor

  • 1.
    ELECTRICAL POWER GENERATION Load curveand Important terms By D. N. Thakkar RCTI, Ahmedabad
  • 2.
    Connected load • Thesum of continuous ratings of all the electrical equipments connected to the supply system is called the connected load
  • 3.
    Demand Factor. • Theword “demand” itself says the meaning of Demand Factor. Demand Factor = Maximum demand / Total connected load • For example, an over sized motor 20 Kw drives a constant 15 Kw load whenever it is ON. The motor demand factor is then 15/20 =0.75= 75 %. • Demand Factor is express as a percentage (%) or in a ratio • Demand factor is always < =1. • The lower the demand factor, the less system capacity required to serve the connected load.
  • 4.
    Load factor • LoadFactor = Actual Load / Full Load • OR • Load Factor = Area under the curve / Area of the rectangle • OR • Load Factor = Units generated / (Maximum demand x hours)
  • 5.
    Load factor • Itis the ratio of actual kilowatt-Hours used in a given period, divided by the total possible kilowatt -hours that could have been used in the same period at the peak KW level. • Load Factor = ( energy (kWh per month) ) / ( peak demand (kW) x hours/month ) • The Load factor is always <=1.
  • 6.
    Load factor • Higherthe load factor is GOOD and it will more Output of Plan, lesser the cost per unit which means an electricity generator can sell more electricity at a higher spark spread, Fixed costs are spread over more kWh of output. A power plant may be highly efficient at High load factors. • Low load factor is a BED. A low load factor will use electricity inefficiently relative to what we could be if we were controlling our peak demand. A power plant may be less efficient at low load factors.
  • 7.
    Connected load factor Connectedload factor = Average load / connected load = (Average demand / Maximum demand) x (Maximum demand / connected load) = Load factor x Demand factor
  • 8.
    Diversity factor • DiversityFactor = Sum of Individual Maximum Demands / Maximum Demand of the System. • The diversity factor is always >= 1.
  • 9.
    Coincidence factor • Thereciprocal of diversity factor is coincidence factor • Coincidence factor = Maximum demand / Sum of individual maximum demands • The Coincidence Factor is always <=1.
  • 10.
    Load diversity • Loaddiversity is the difference of sum of individual maximum demands of two or more consumers and their combined maximum demand
  • 11.
    Loss factor Loss factor= Average power loss / Power loss at peak load
  • 12.
    Plant capacity factor Plantcapacity factor = Average demand / Installed plant capacity OR Plant capacity factor = Units generated in a year / Installed plant capacity x 8760
  • 13.
    Utilization factor Utilization factor= Maximum demand / Plant capacity
  • 14.
    Plant use factor Plantuse factor = Units generated / ∑kWh = Units generated / kW1h1+kW2h2+….
  • 15.
    Load curve Load curveis the variation of load with time on a Power Station. As the load on a Power Station never remain constant rather it varies time to time, these variations in load is plotted on half hourly or hourly basis for the whole day. The curve thus obtained is known as Daily Load Curve.
  • 16.
    Importance of LoadCurve • From the daily load curve we can have insight of load at different time for a day. • The area under the daily load curve gives the total units of electric energy generated. • Units Generated / day = Area under the daily Load Curve in kW • The peak point on the daily load curve gives the highest demand on the Power Station for that day. • The average load per day on the Power Station can be calculated using the daily load curve. • Average load = Area under the daily Load Curve (kWh)/ 24 hrs. • Load curve helps in deciding the size and number of Generating Units. • Load Factor = Avg. Load / maximum Load = Avg. Load x24 / 24xmaximum Load • = Area under daily Load Curve/Area of Rectangle having Daily Load Curve • Load curve helps in the preparing the operation schedule of the generating units.
  • 17.
    Load Duration Curve •Load Duration Curve is the plot of Load versus time duration for which that load was persisting.
  • 18.
    Base load &Peak load • Base load is the minimum level of electricity demand required over a period of 24 hours. It is needed to provide power to components that keep running at all times (also referred as continuous load). Peak load is the time of high demand.
  • 19.
    Base load &Peak load
  • 20.
    Base load &Peak load
  • 21.
    Characteristics of Baseload station • Operating throughout the year • Load factor is high • Efficiency is high • Cost of unit generation is less • Capital cost is high • Capacity is high • Difficult to start and stop
  • 22.