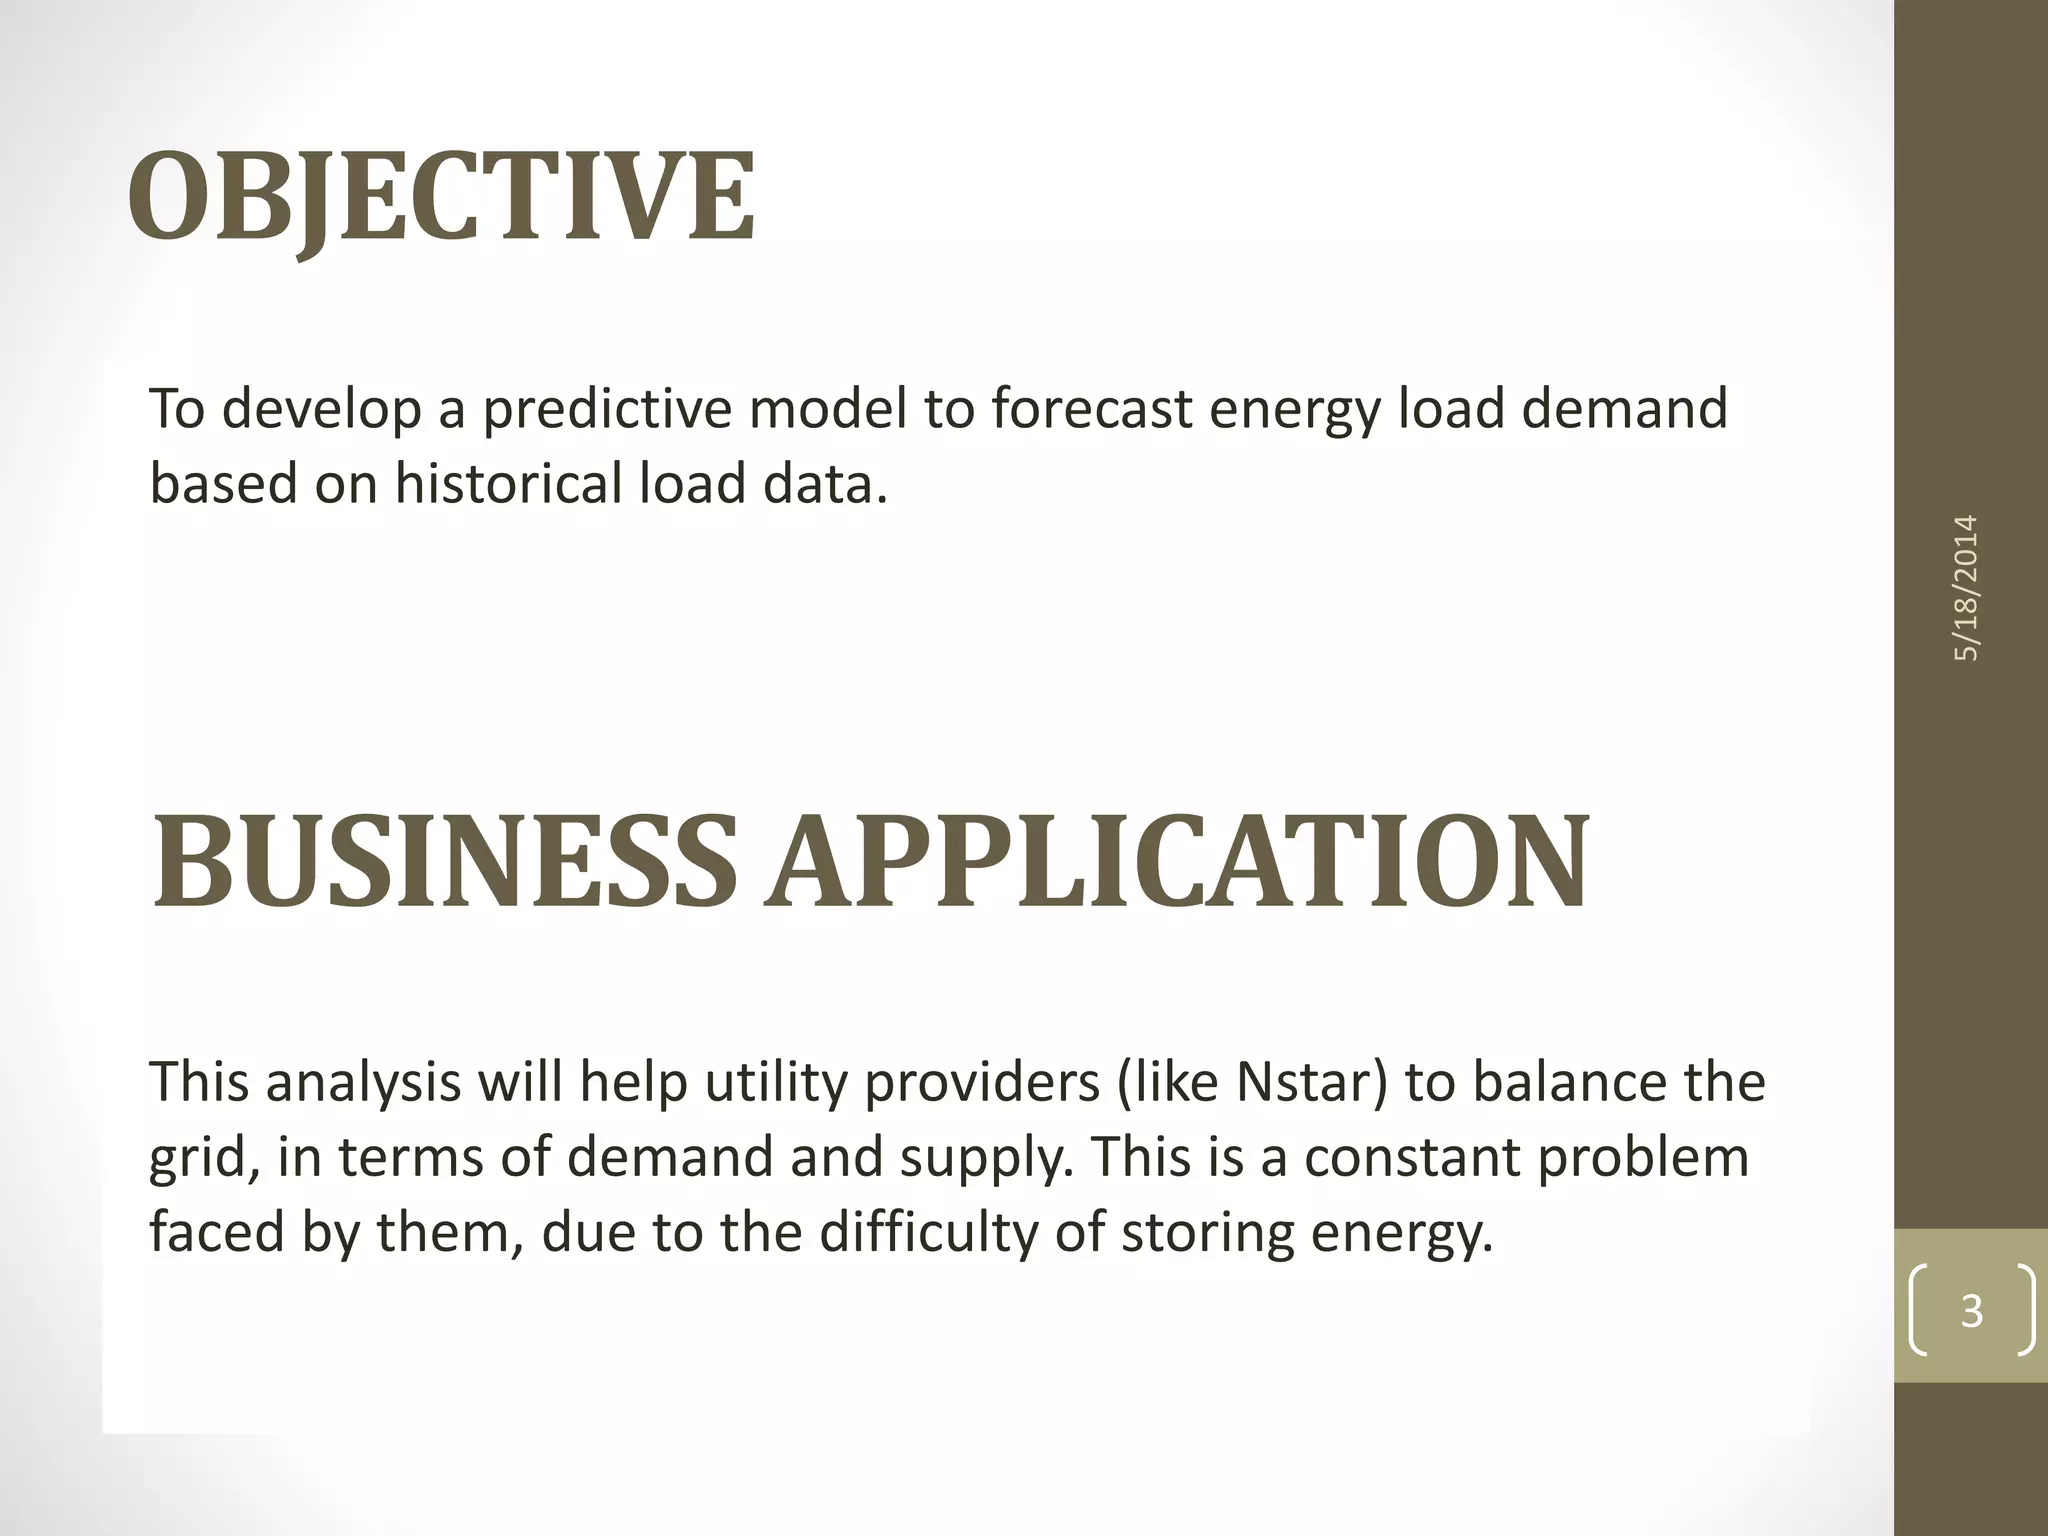
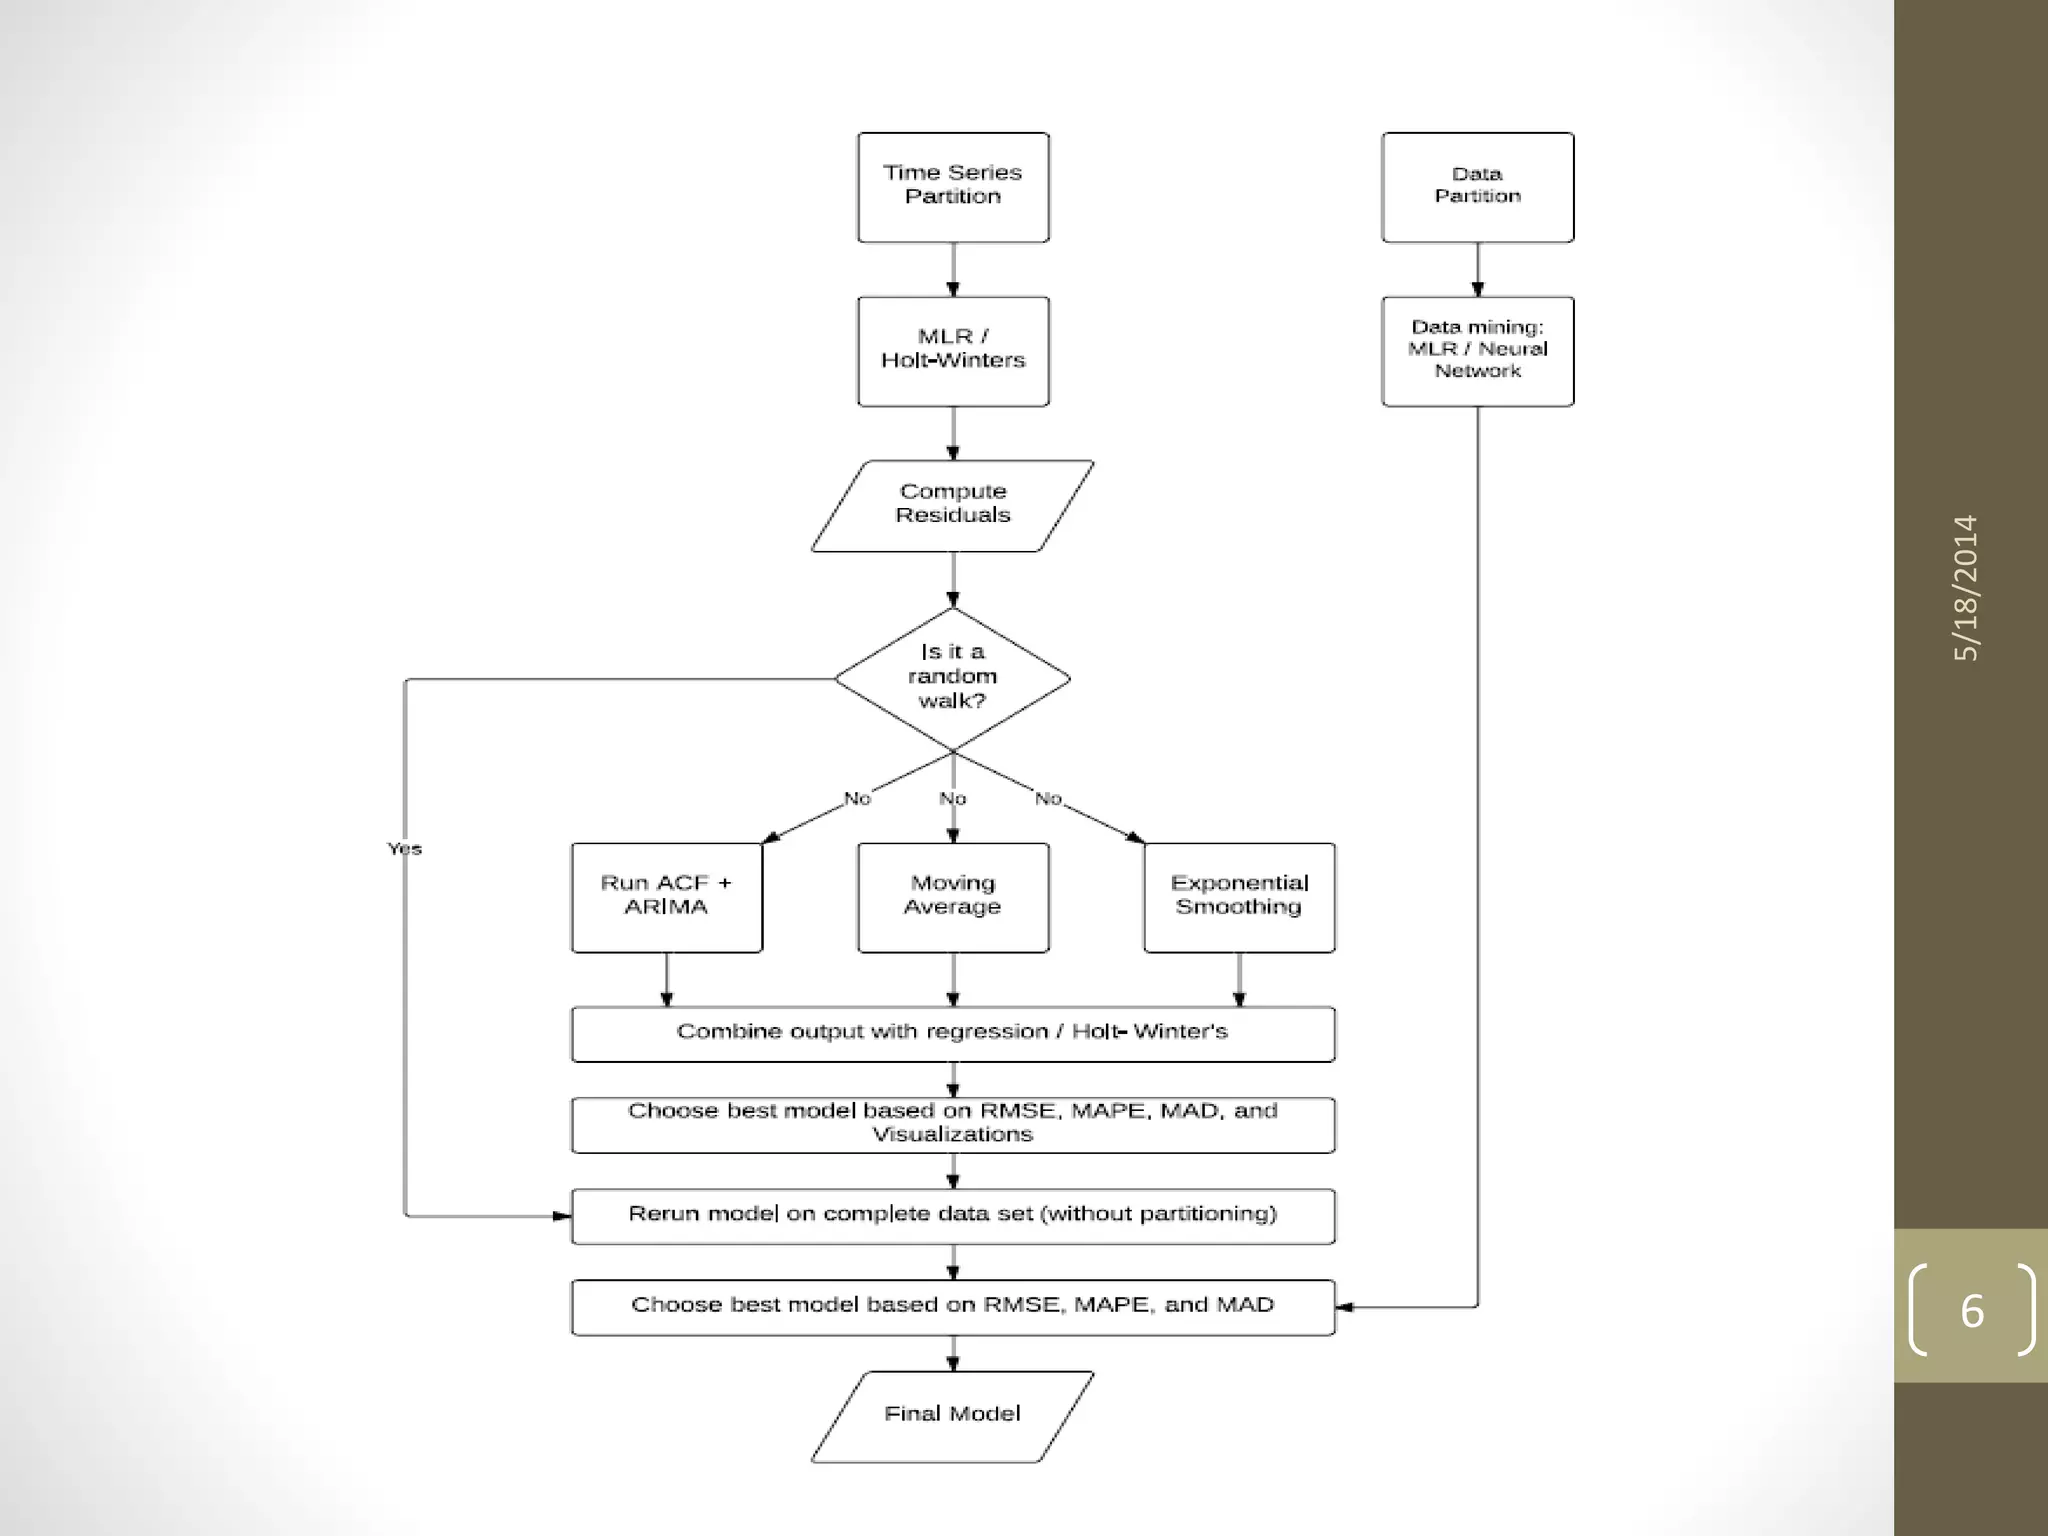
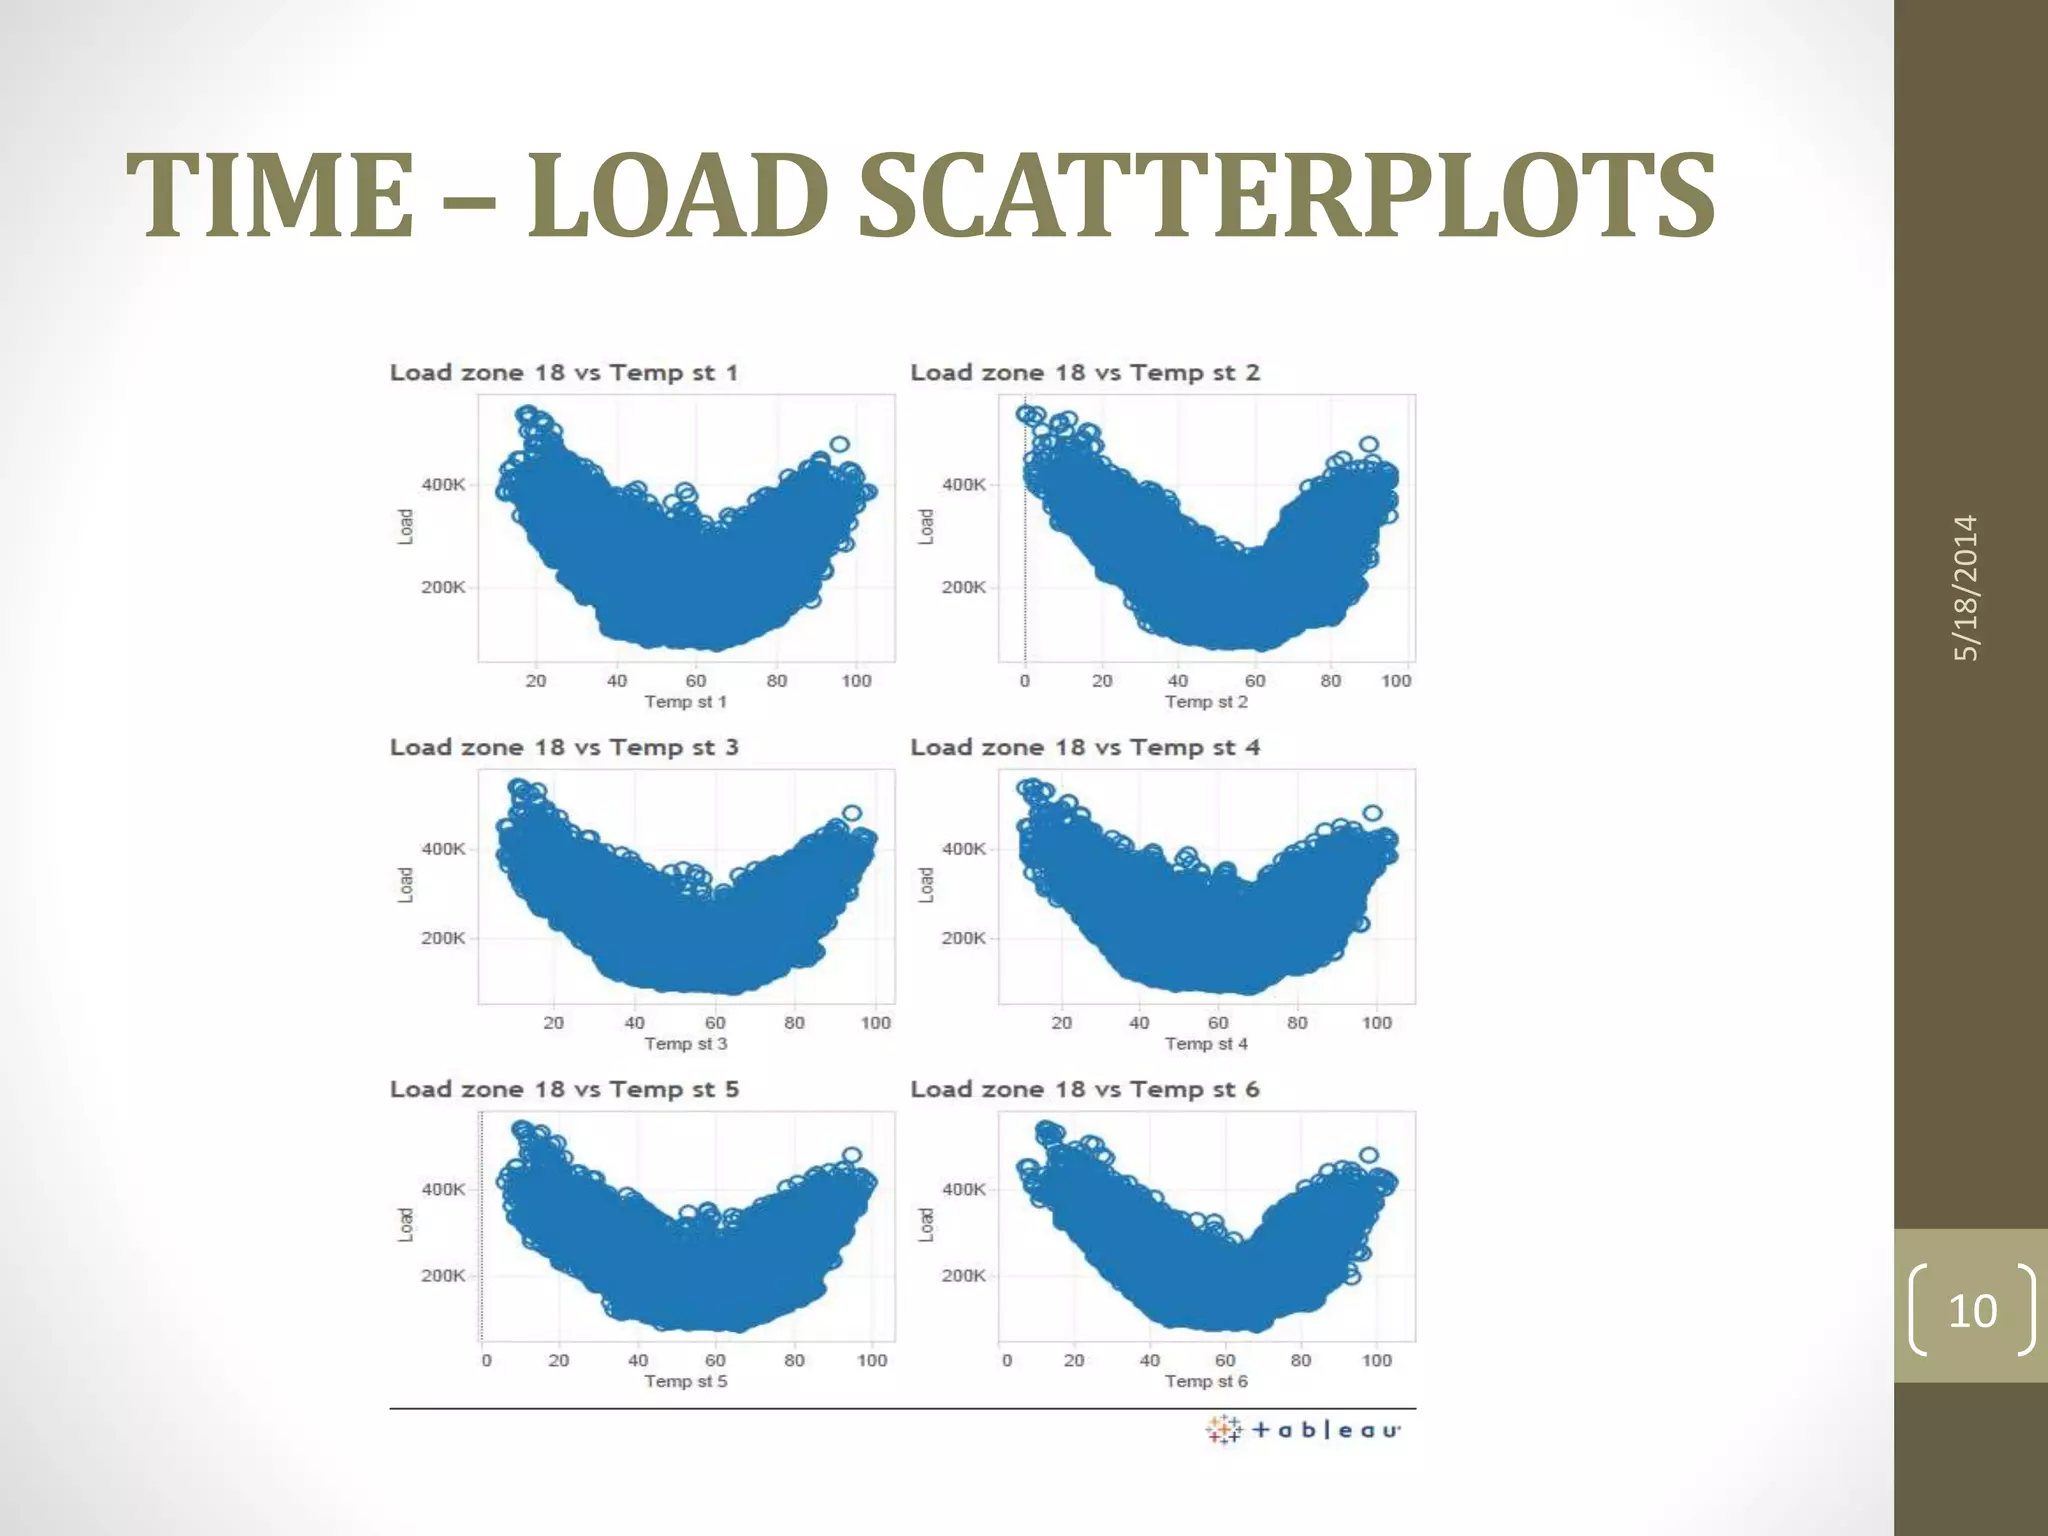
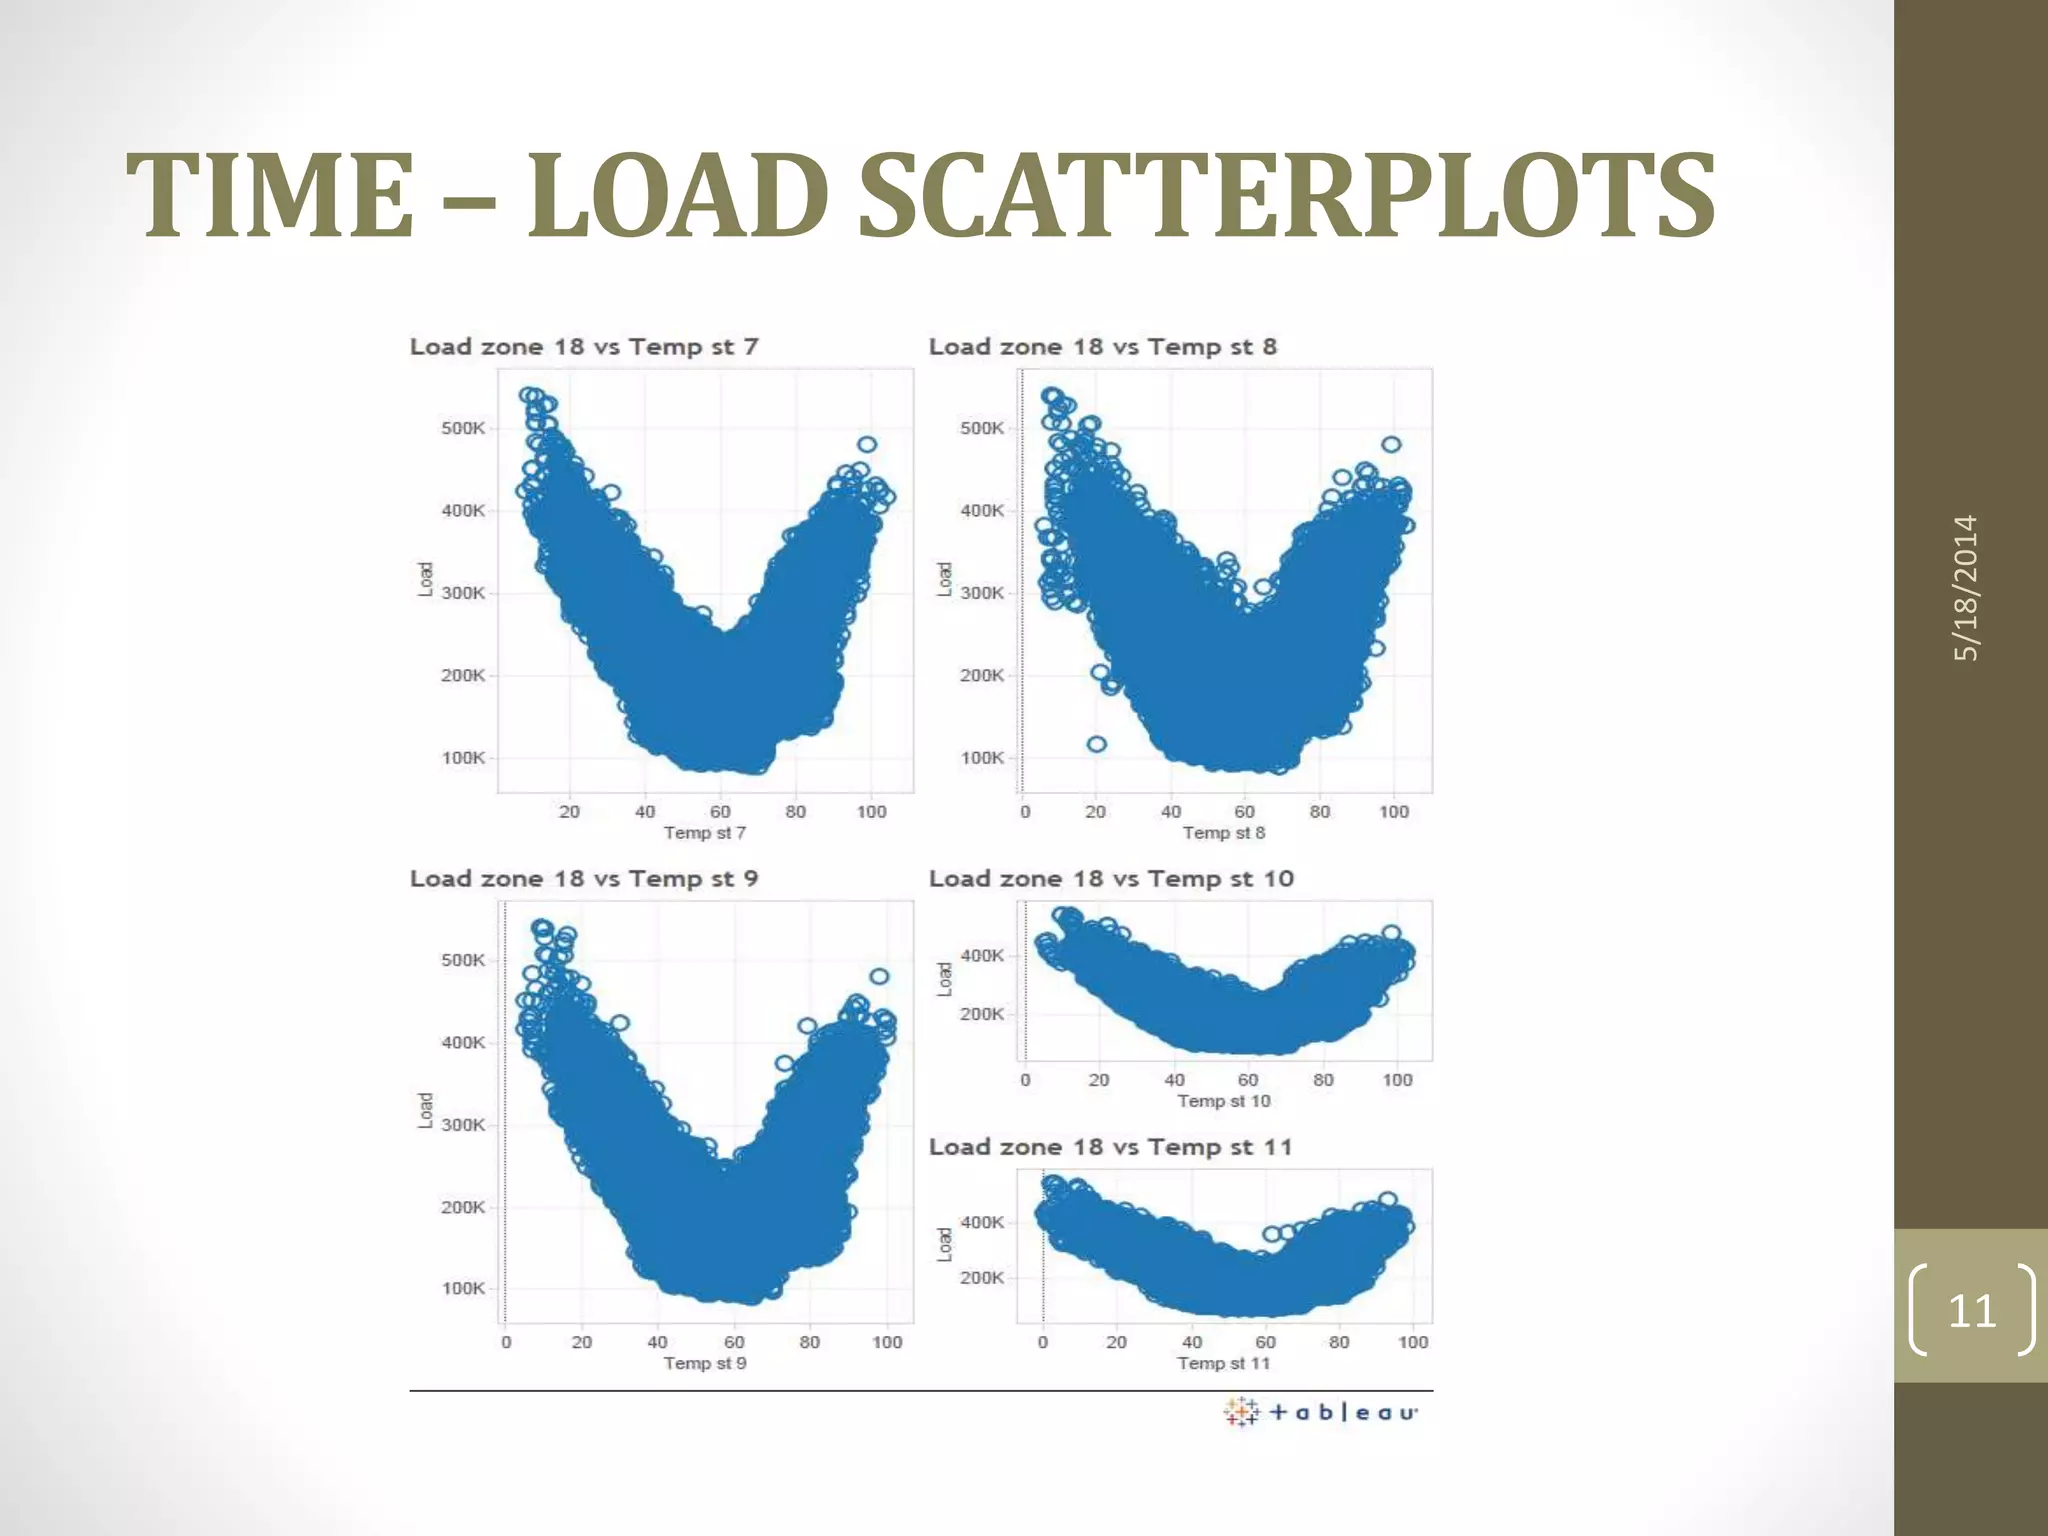
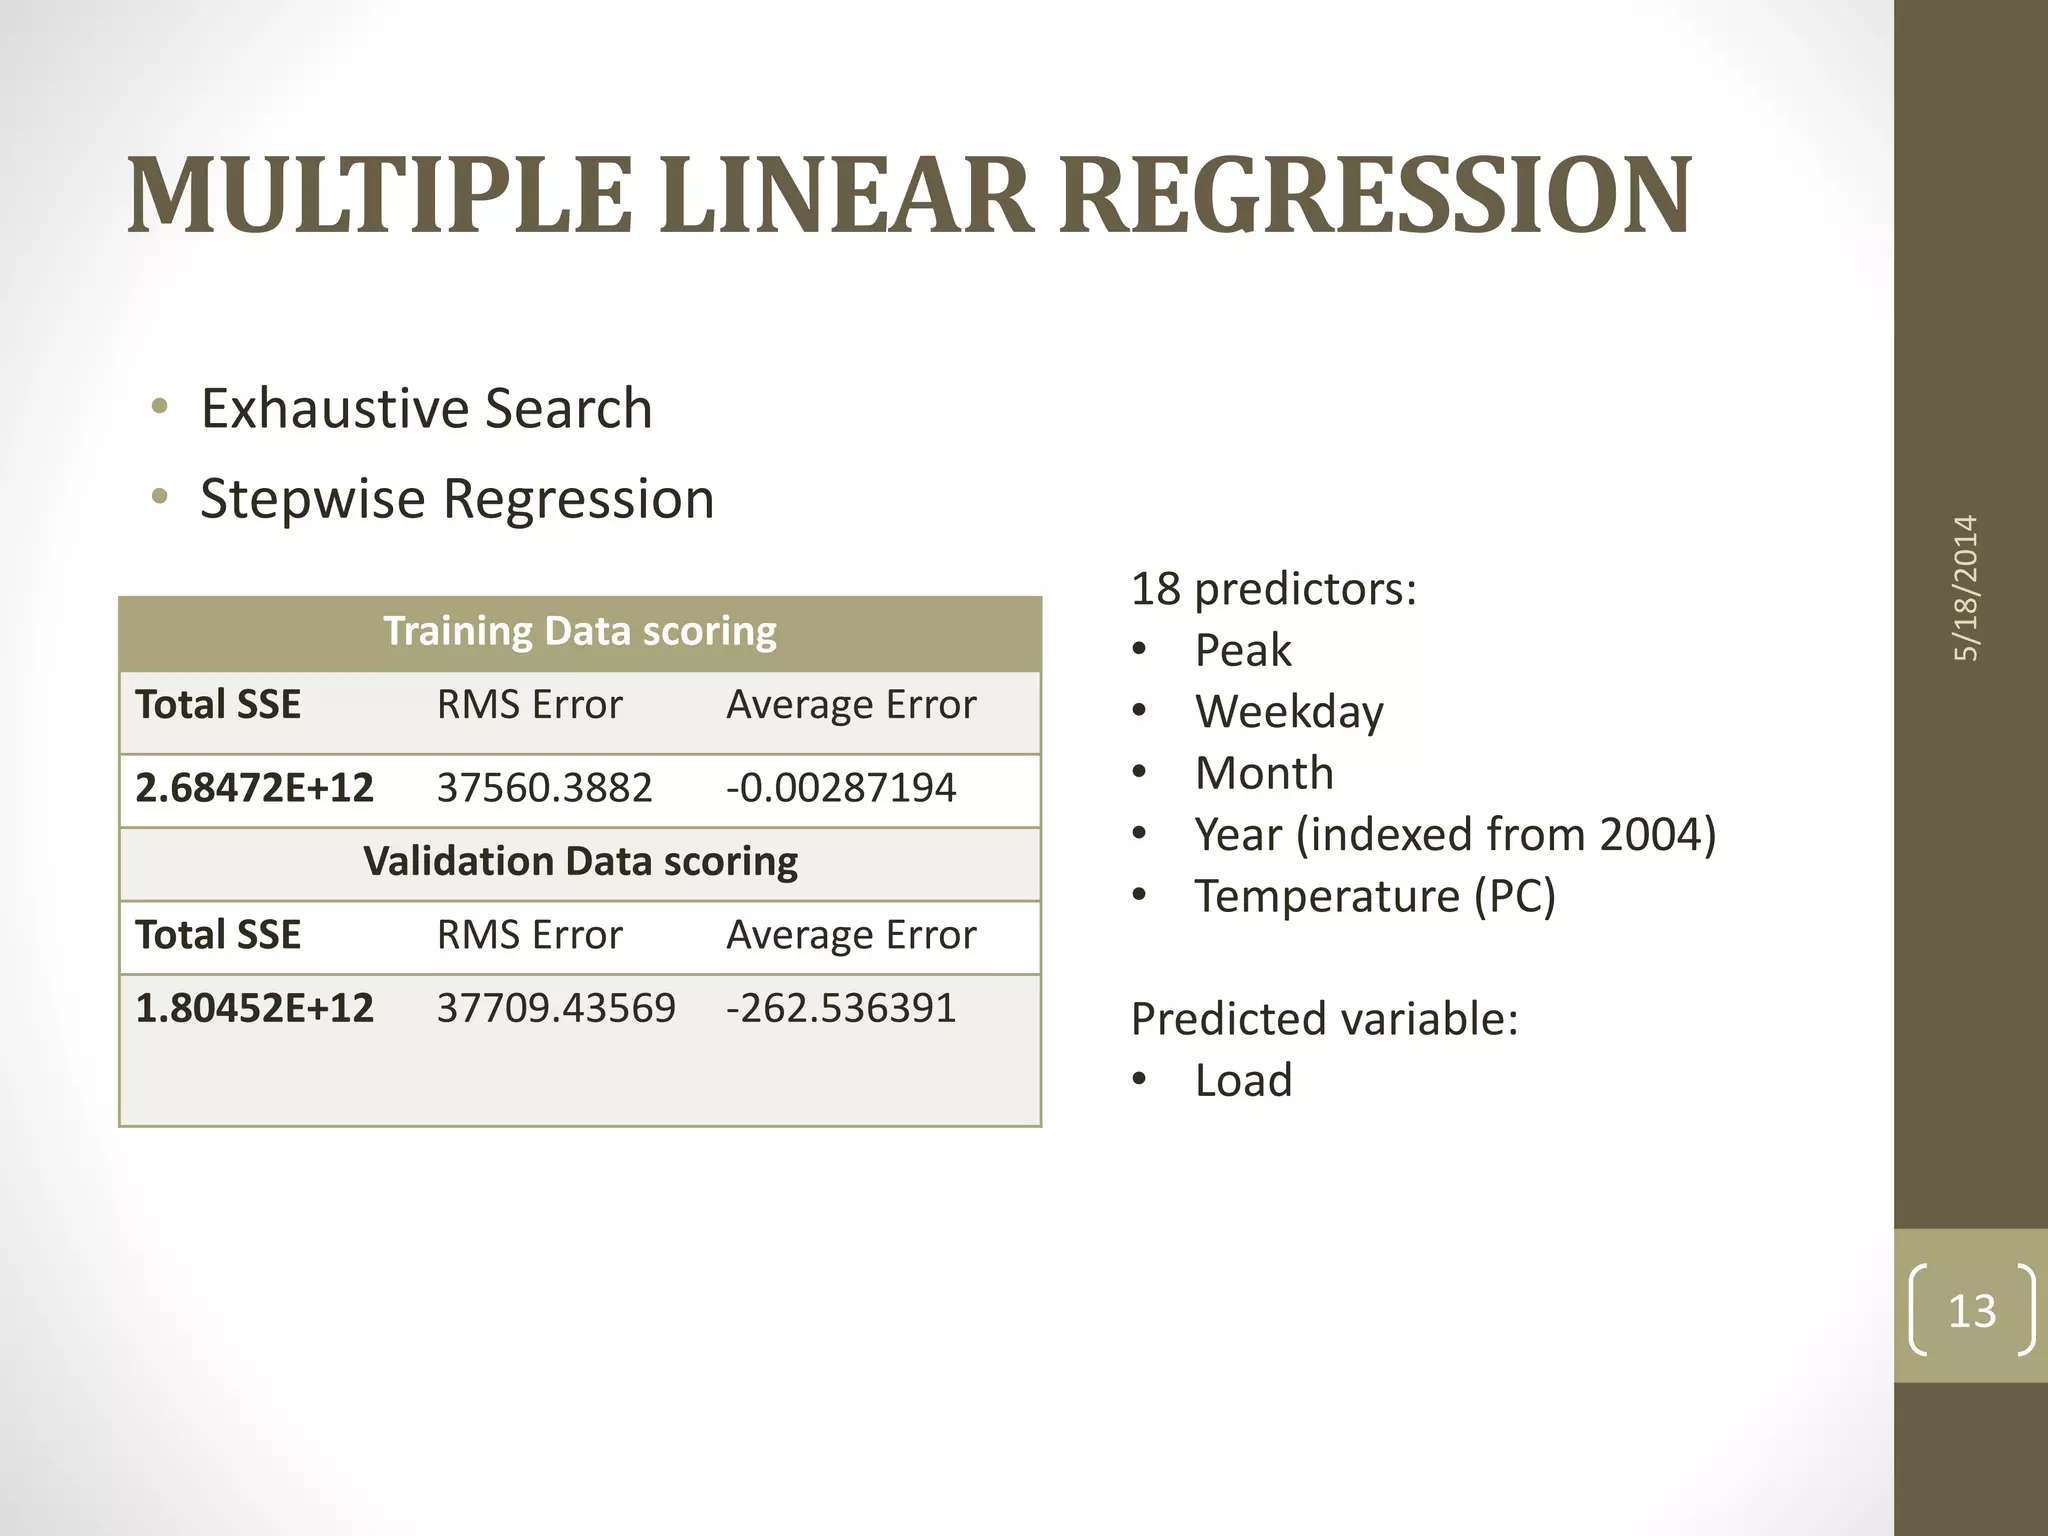
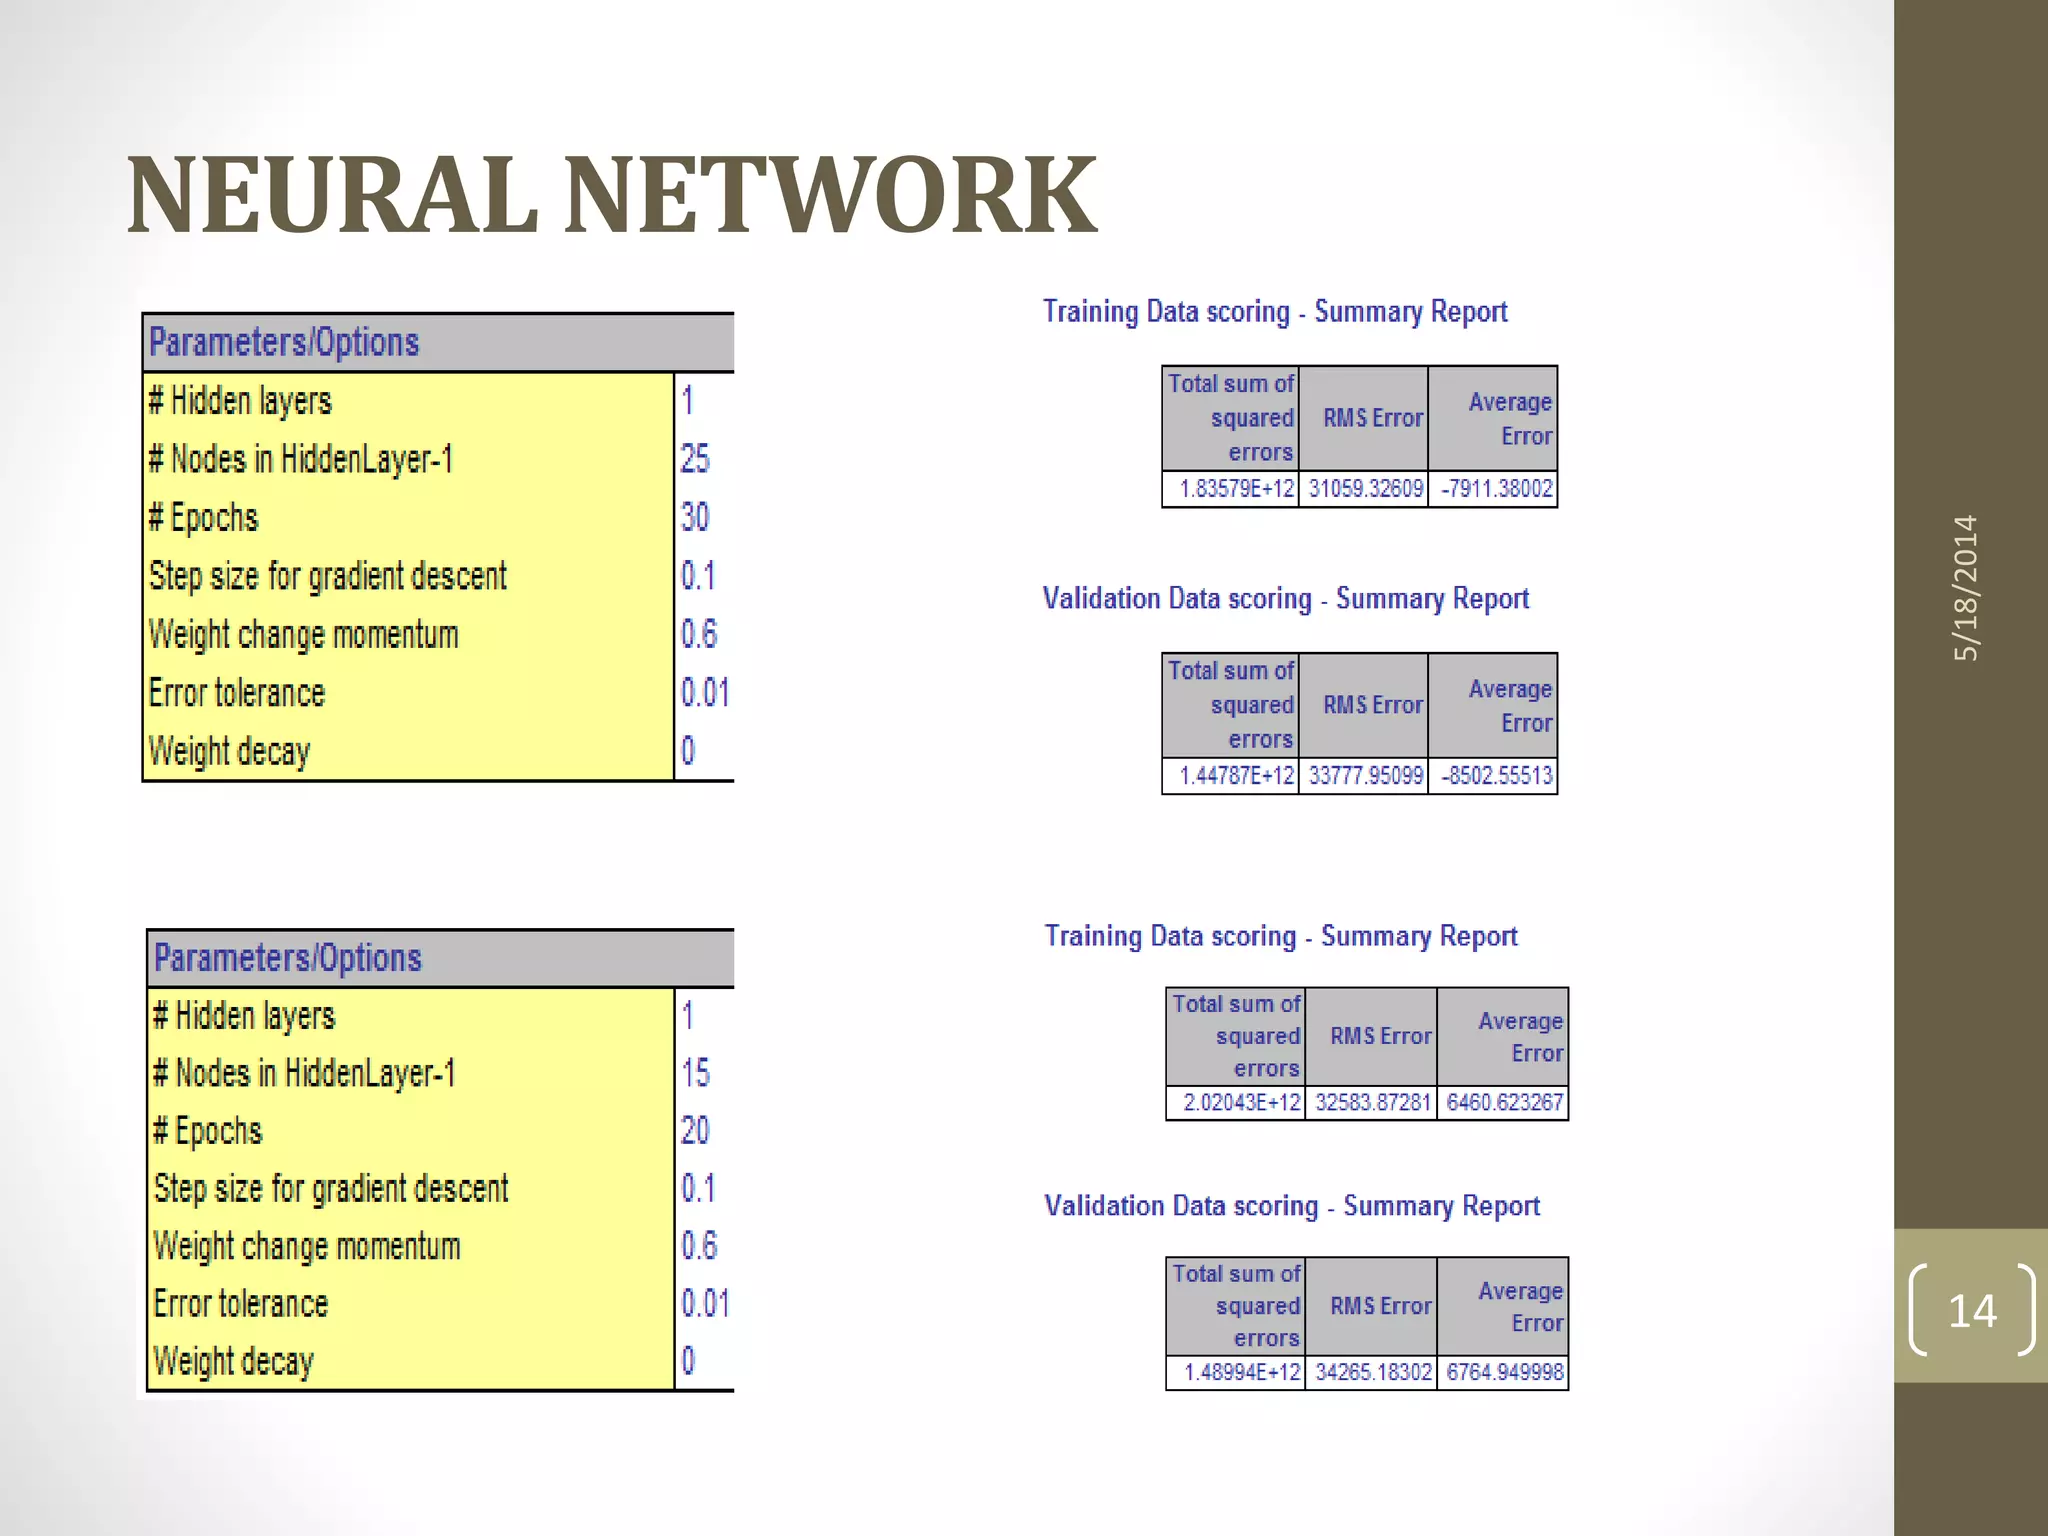
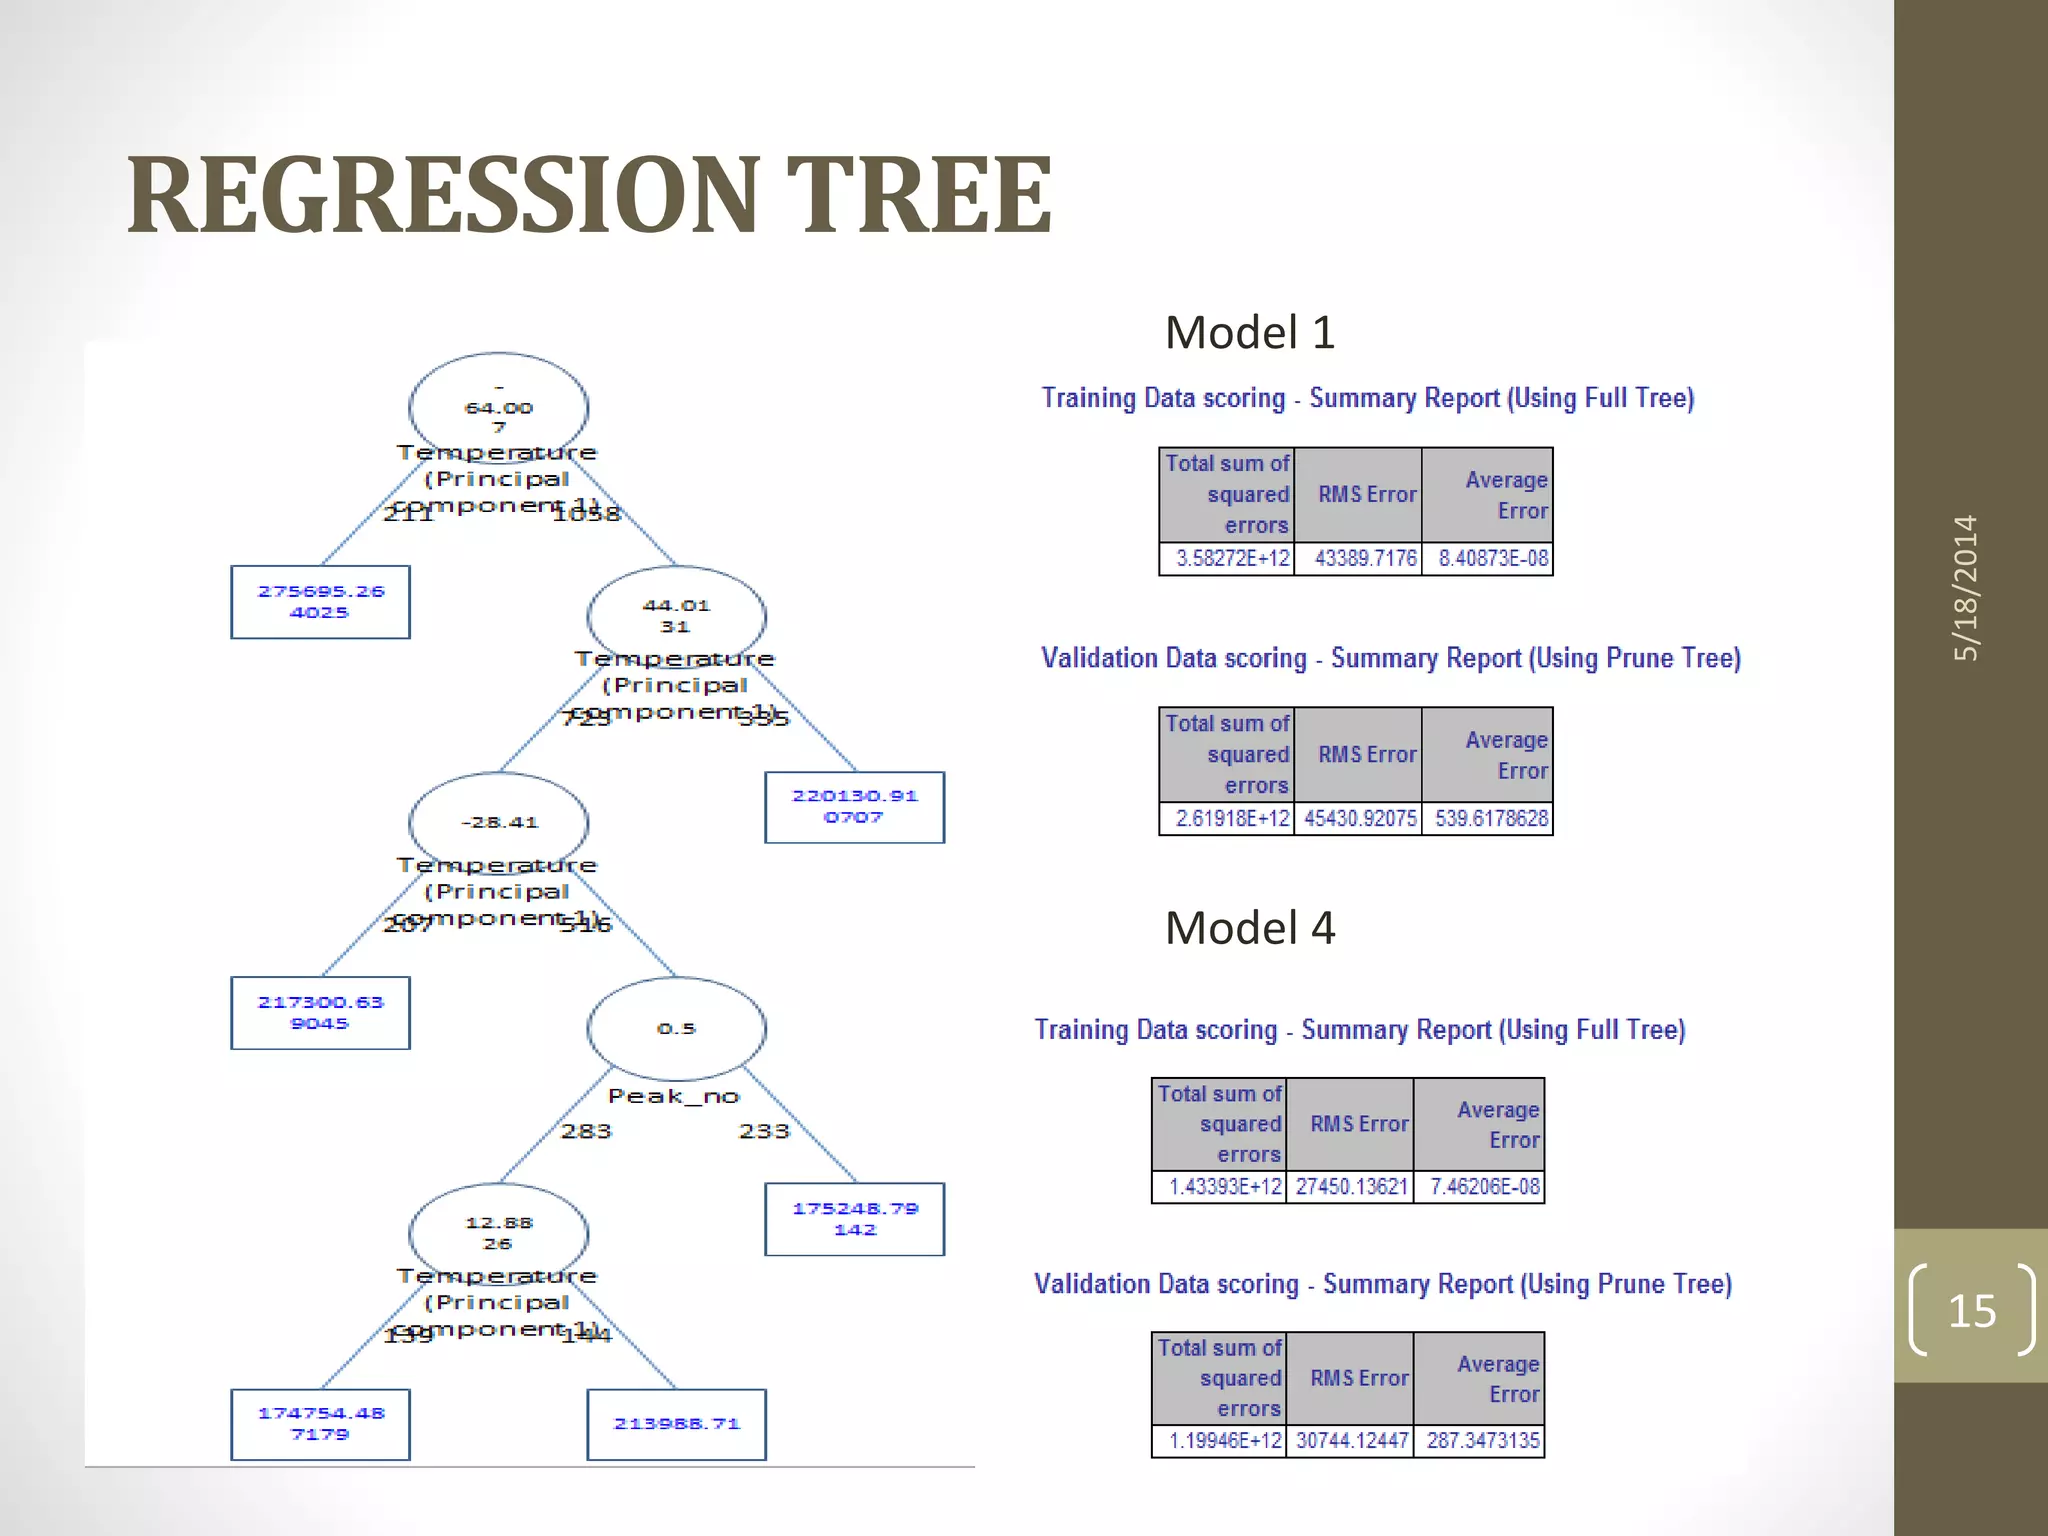
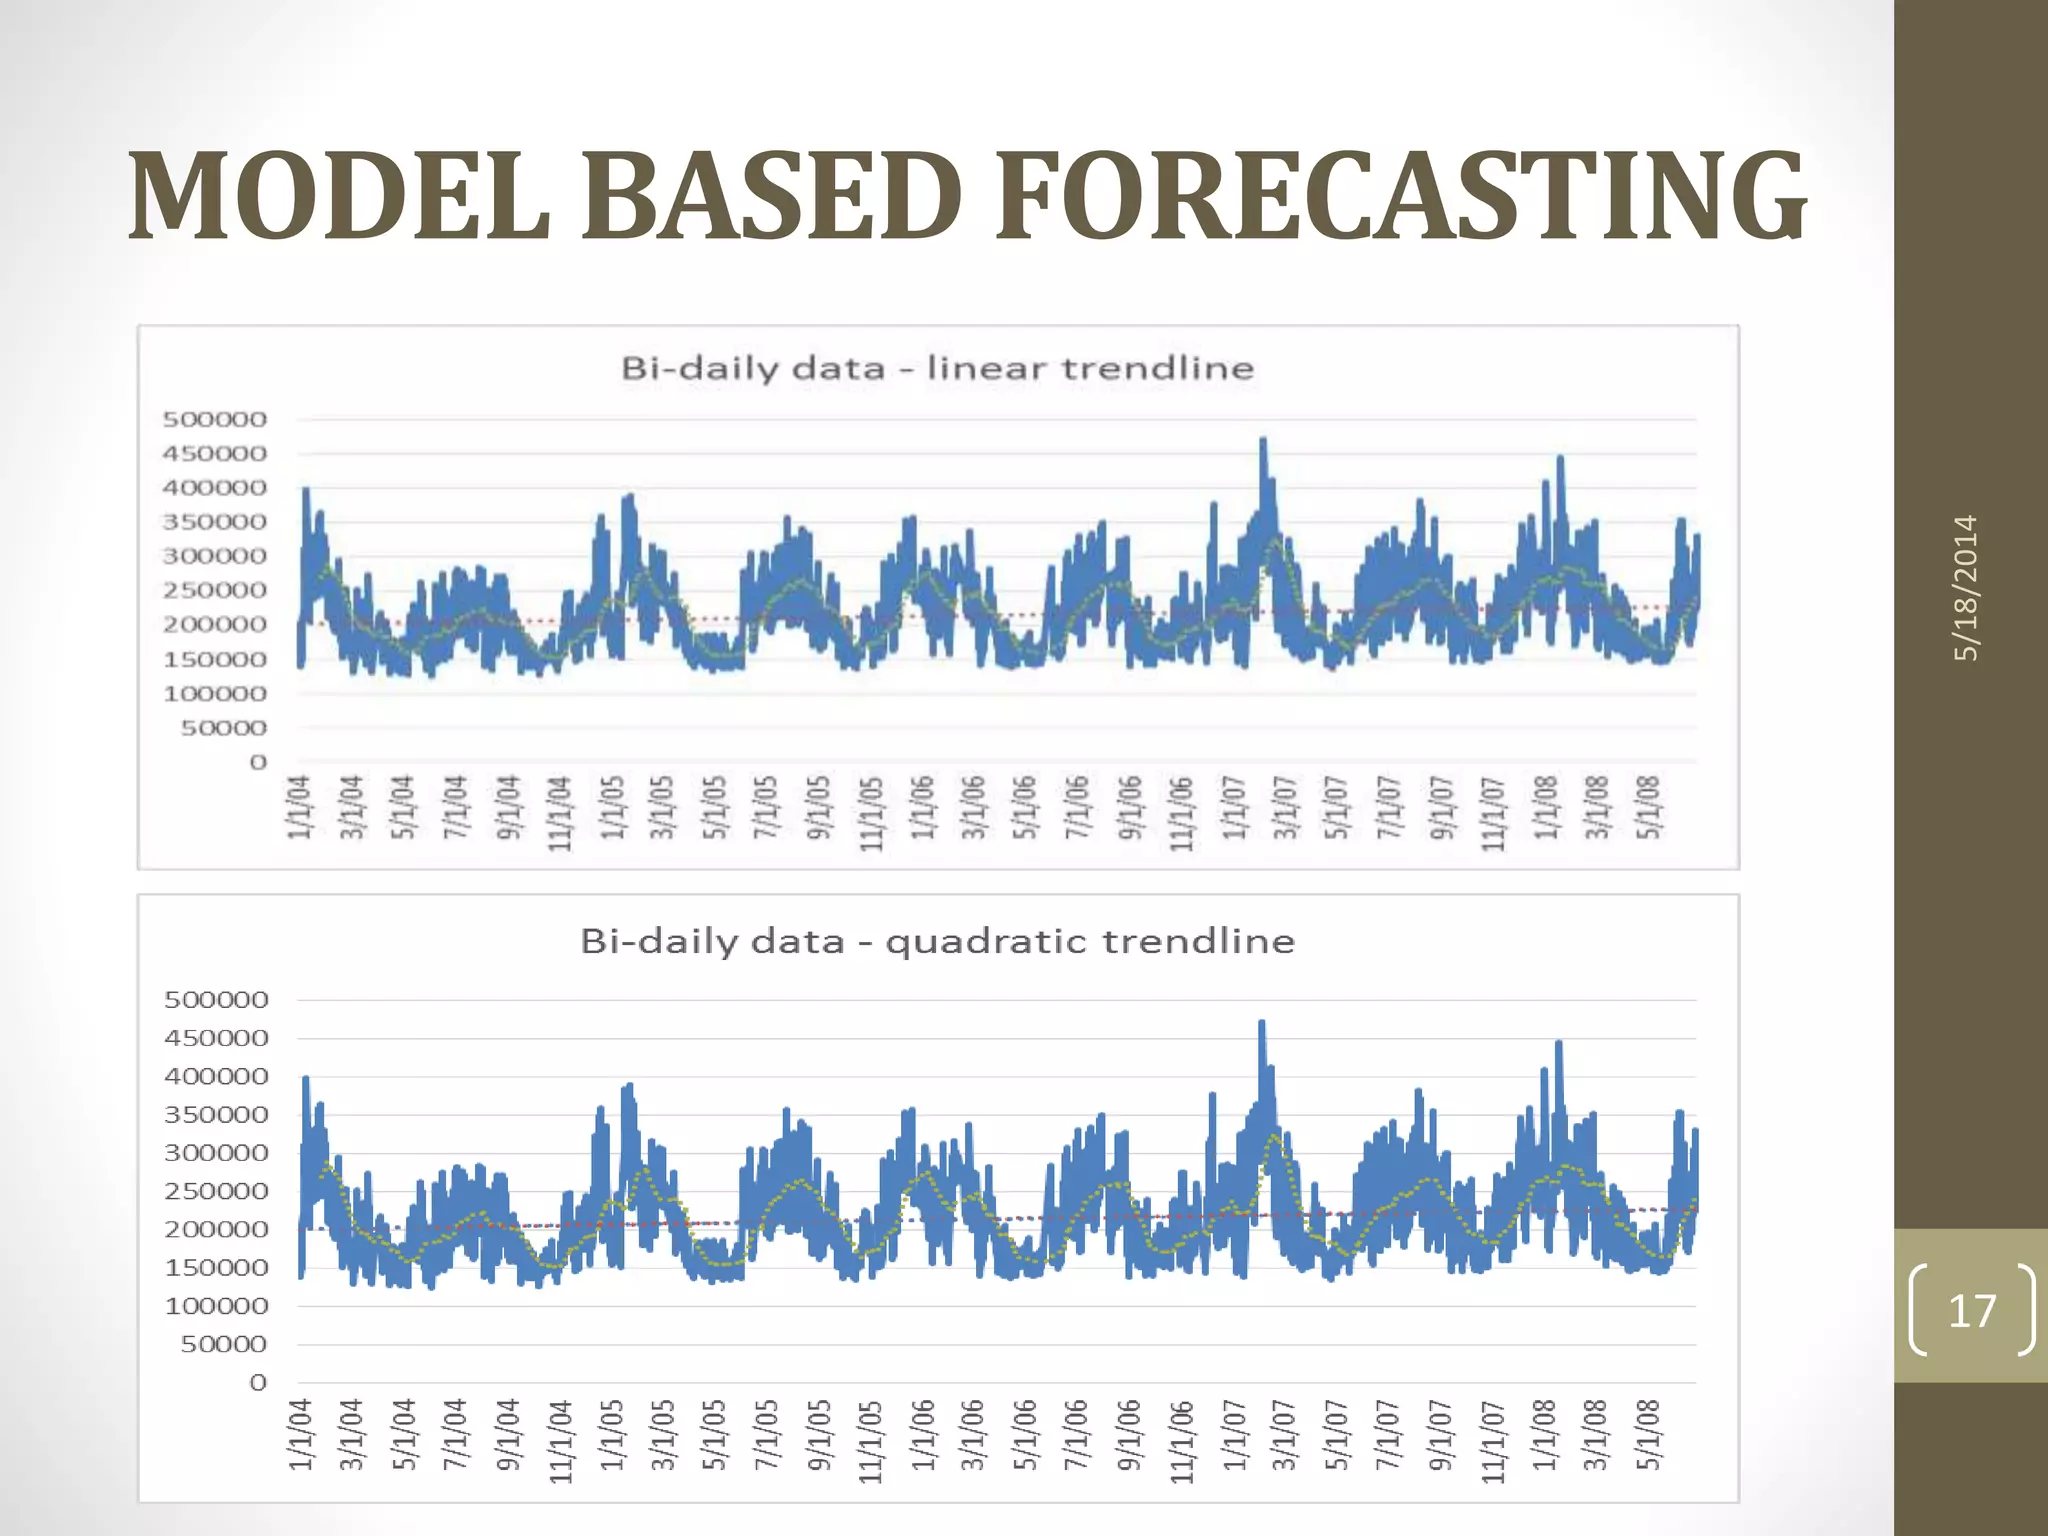
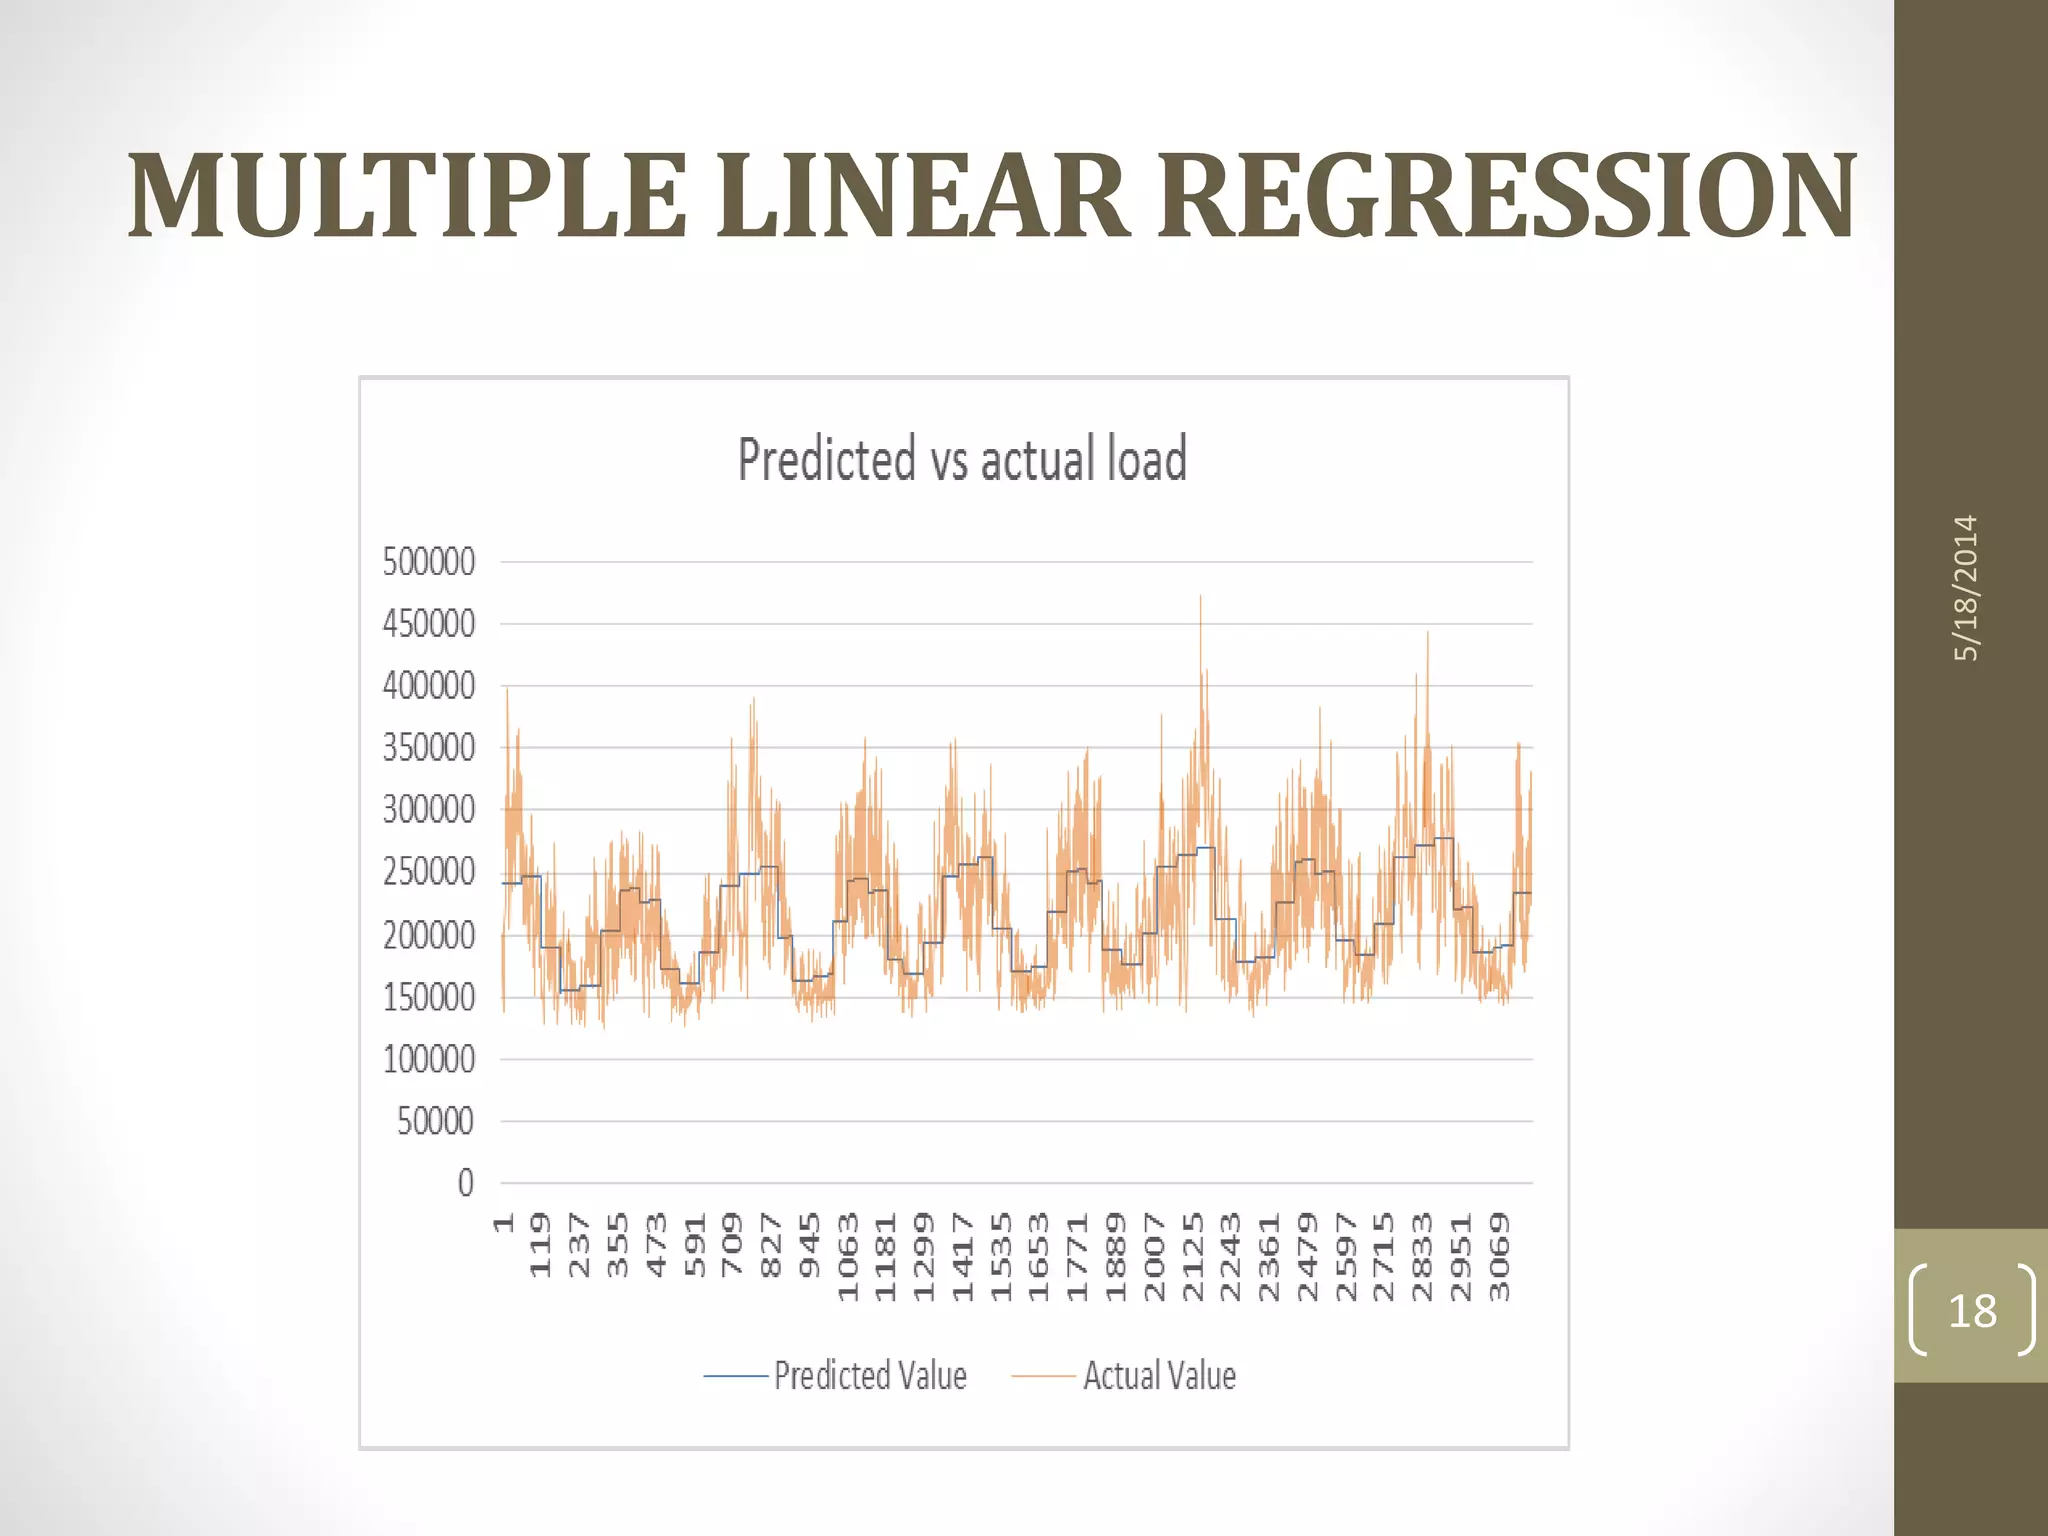
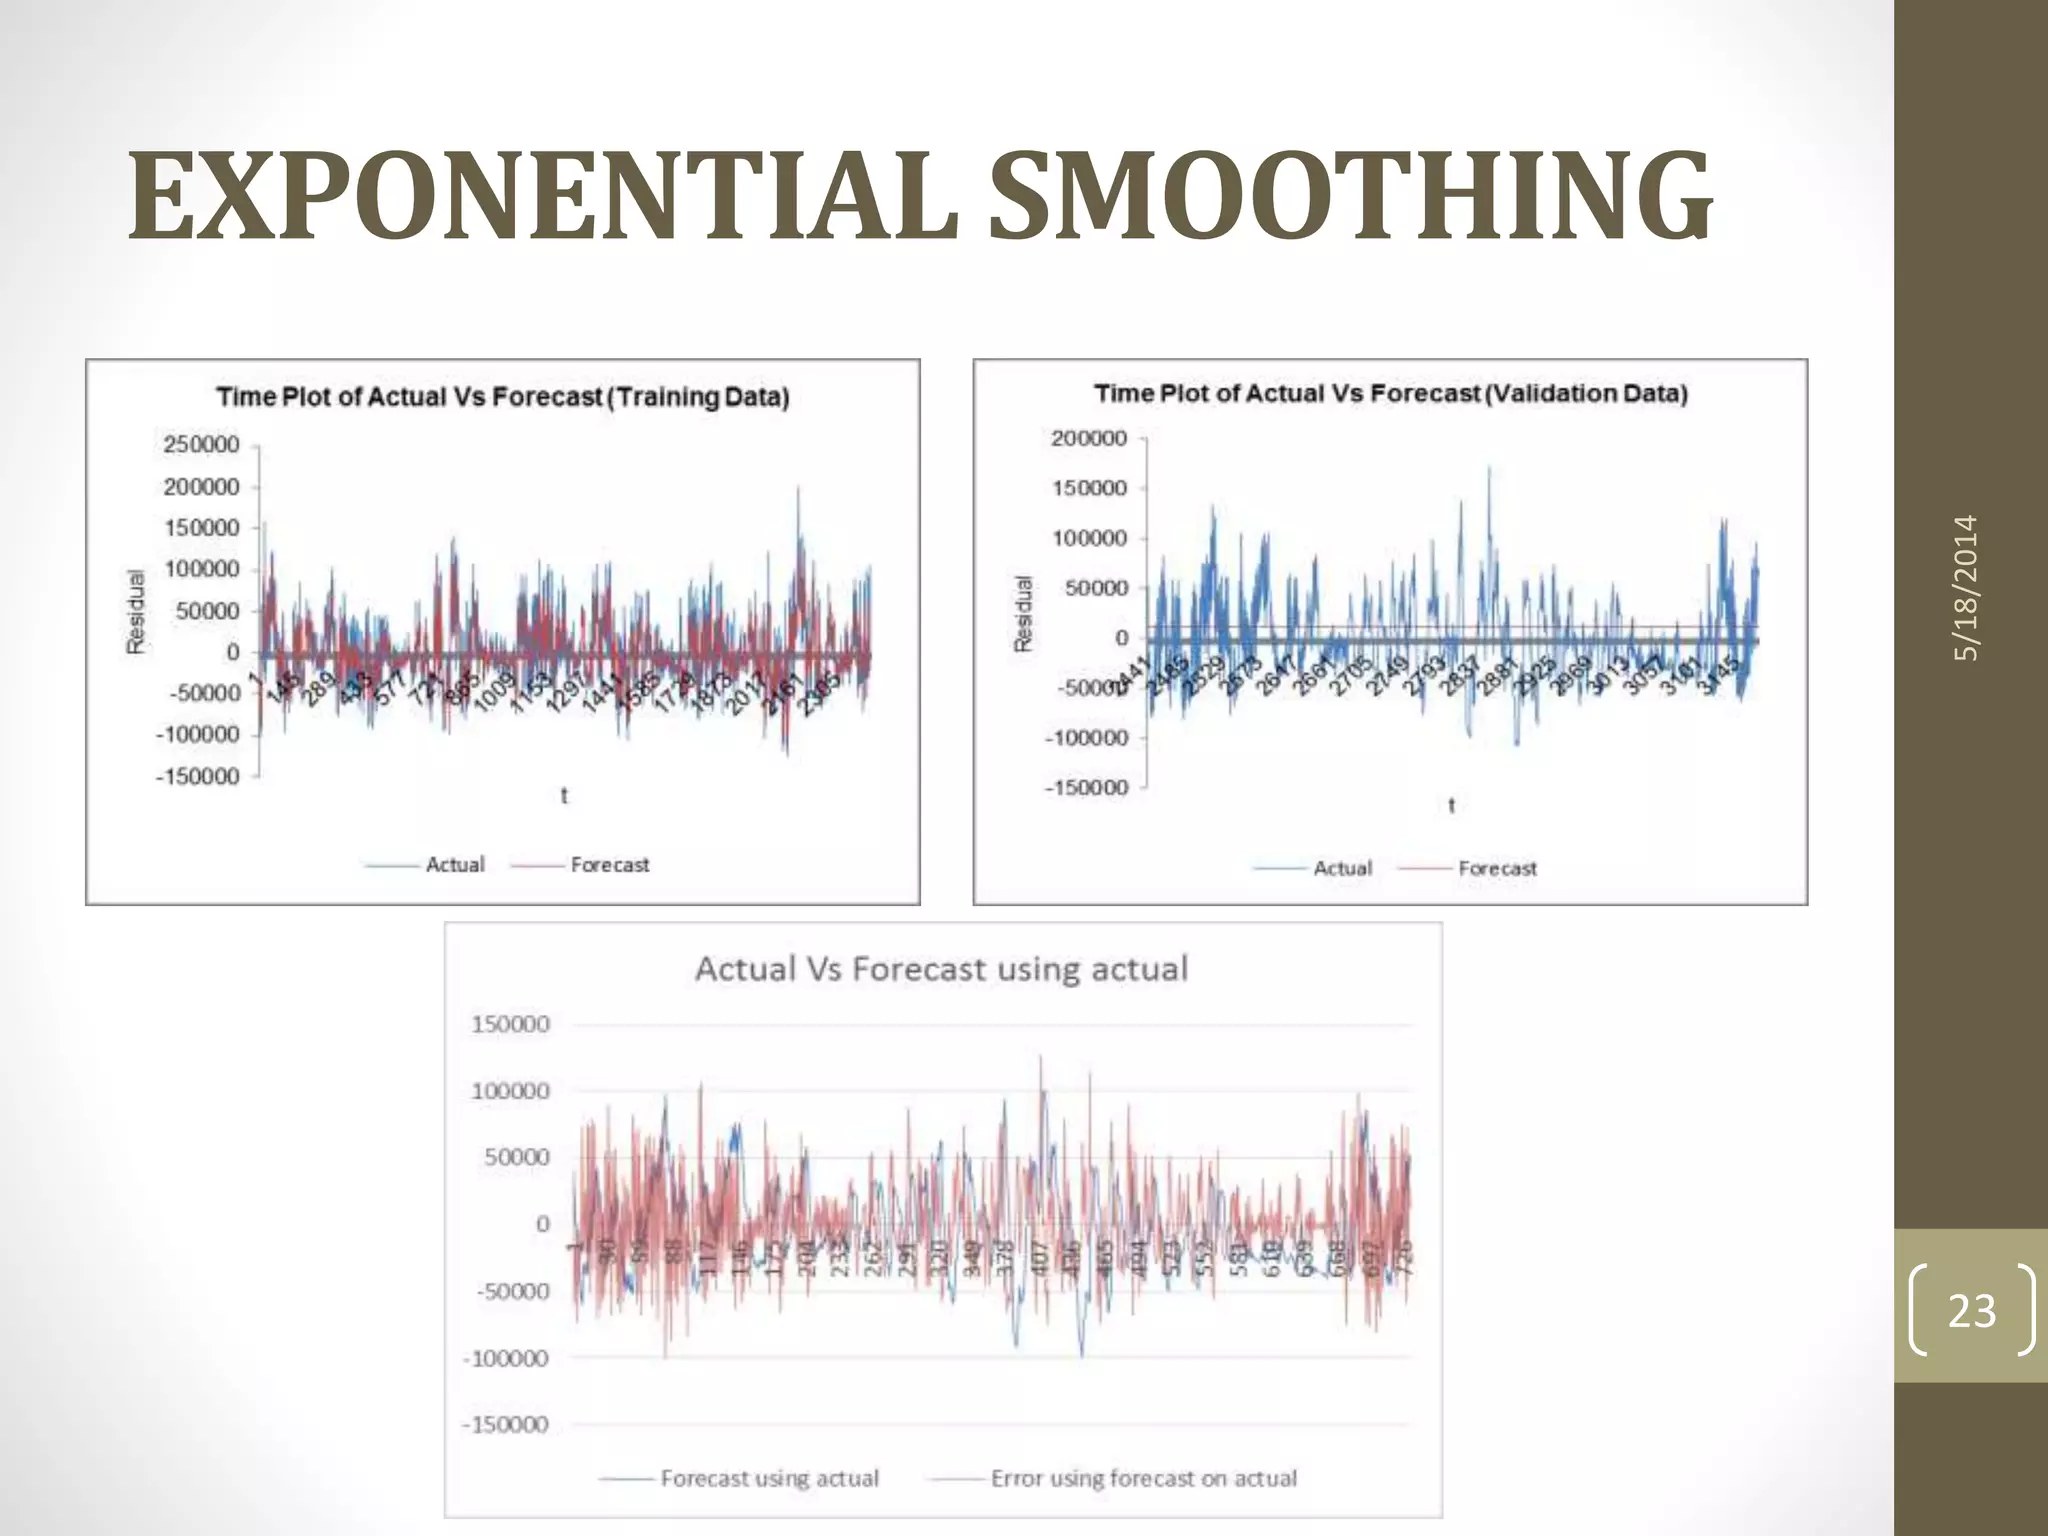
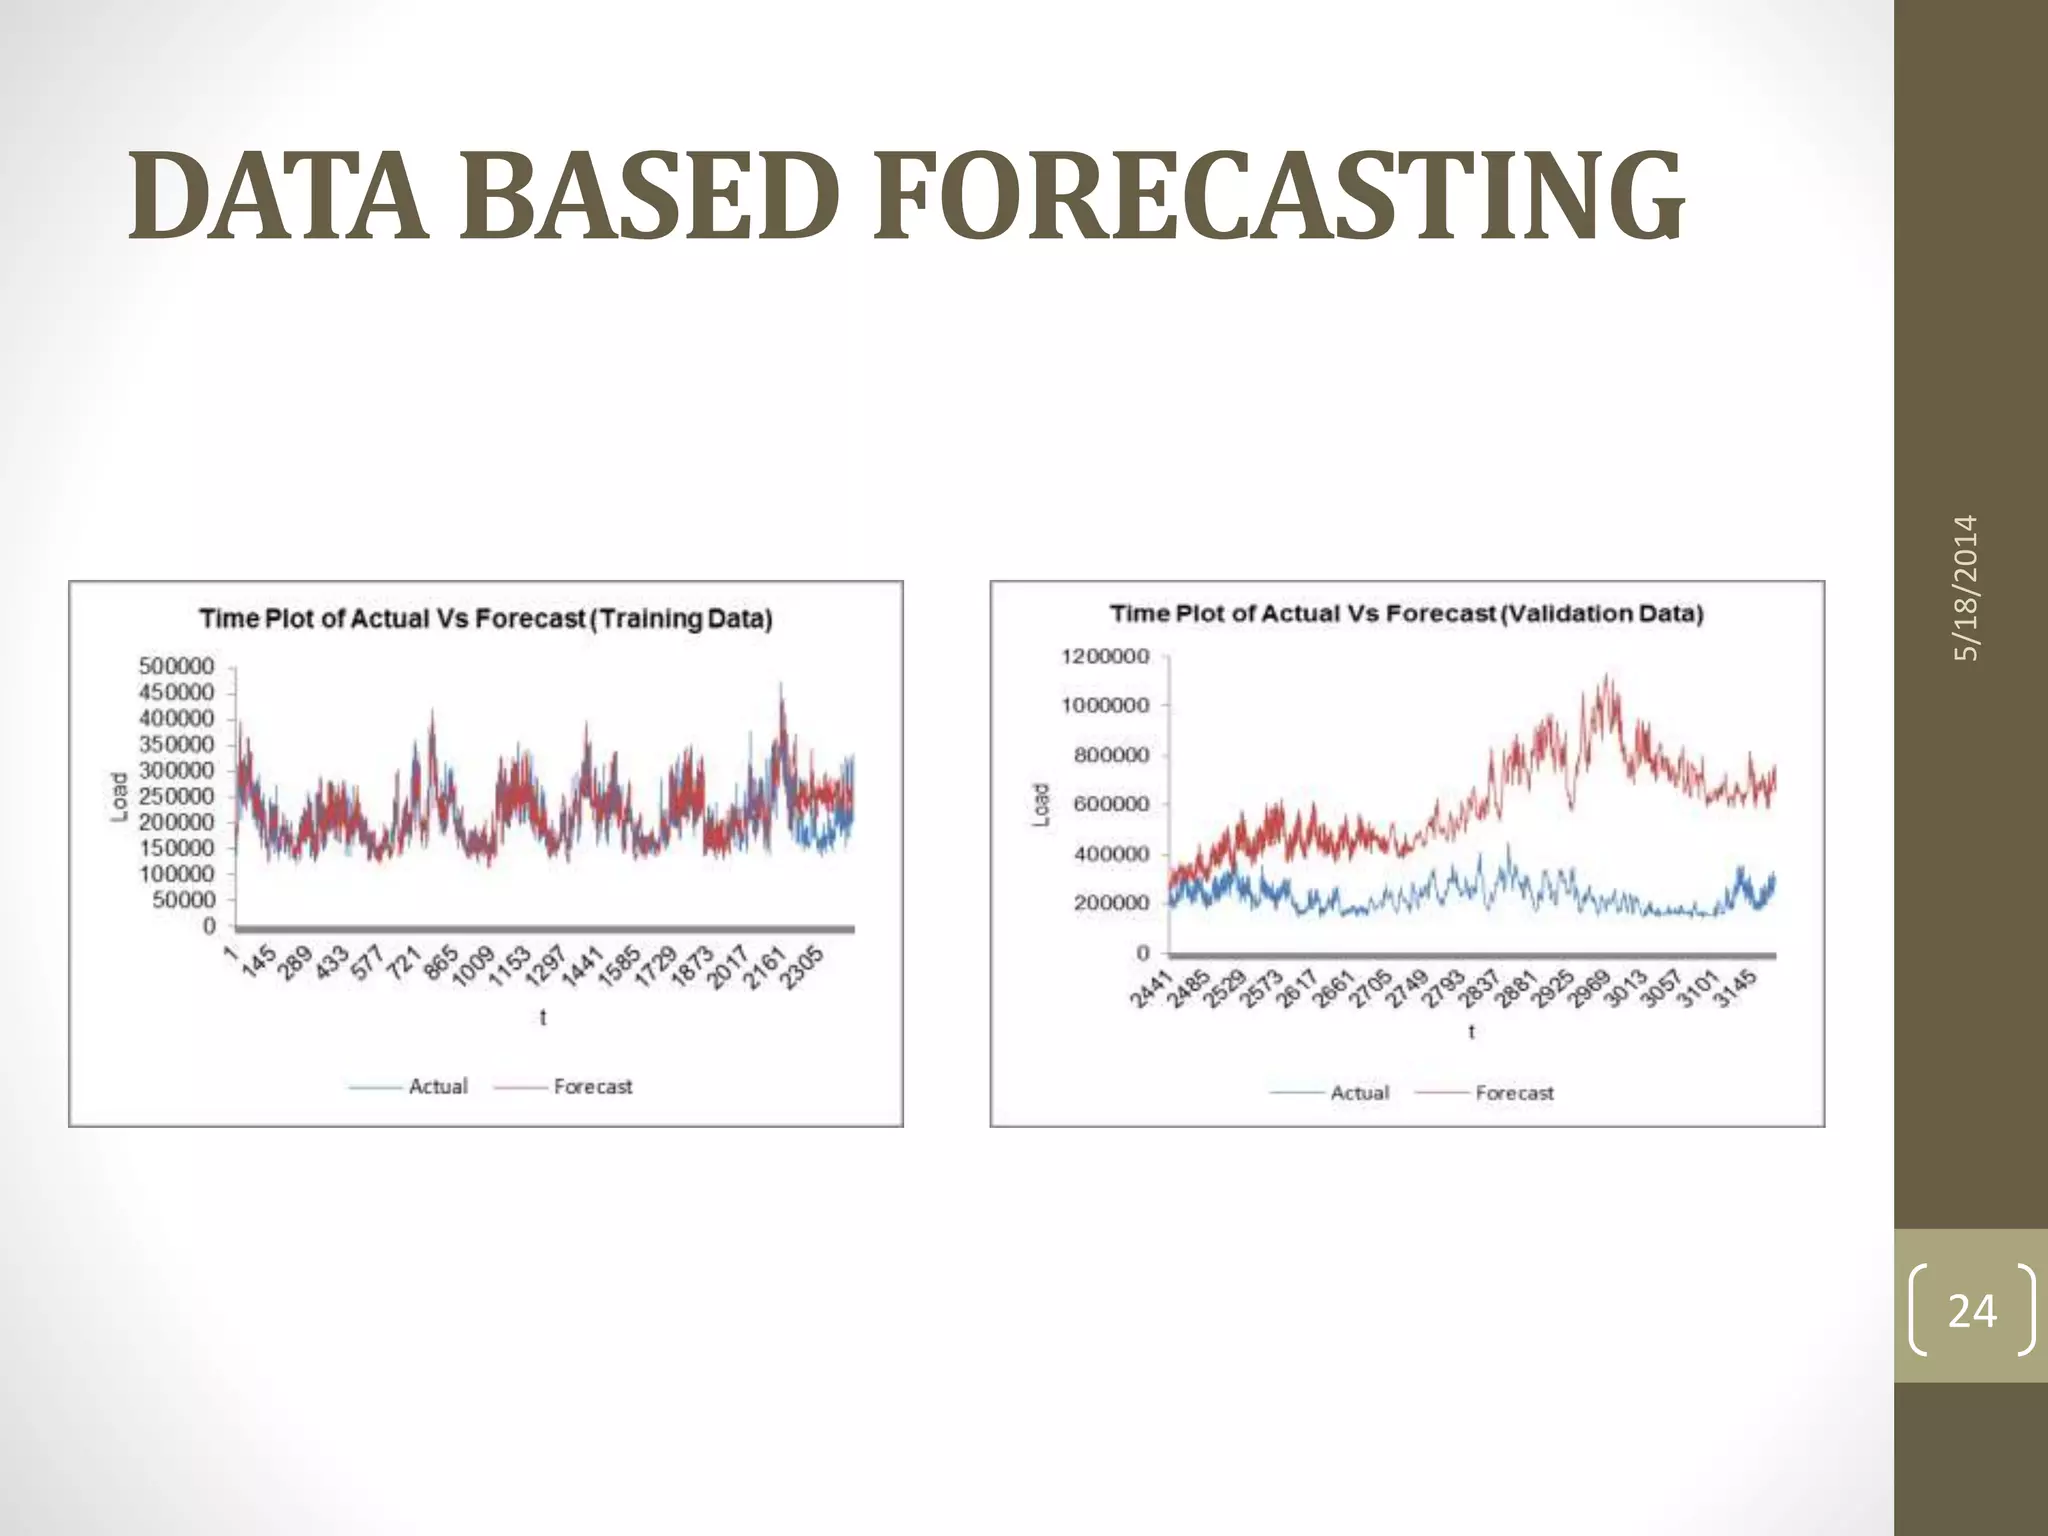
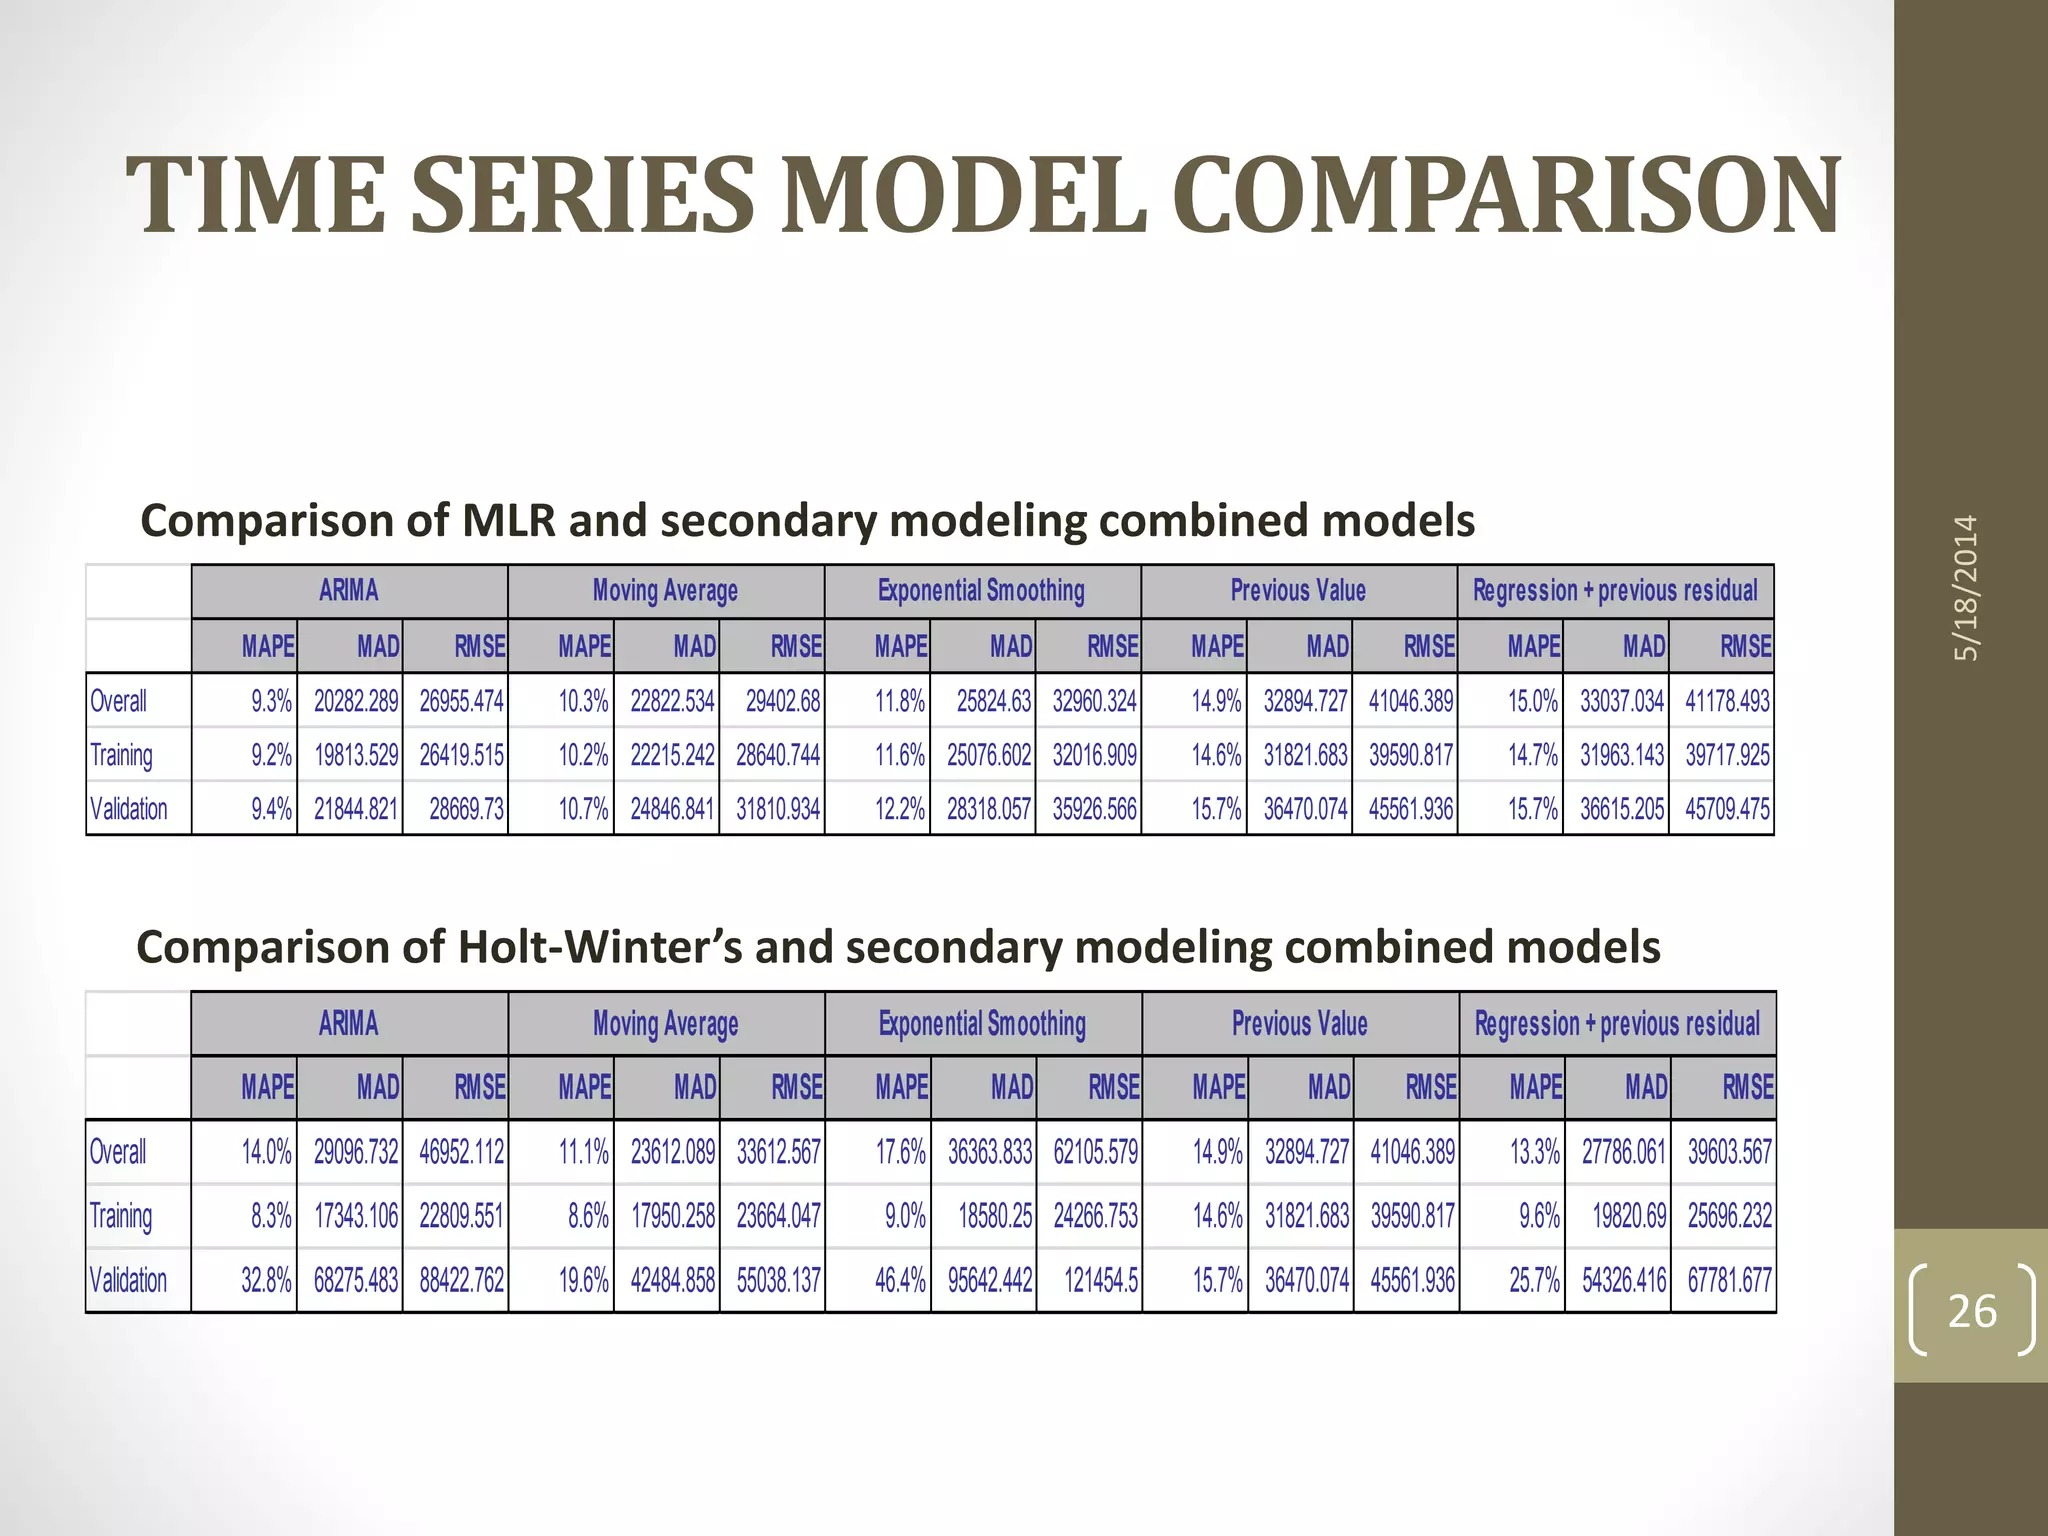
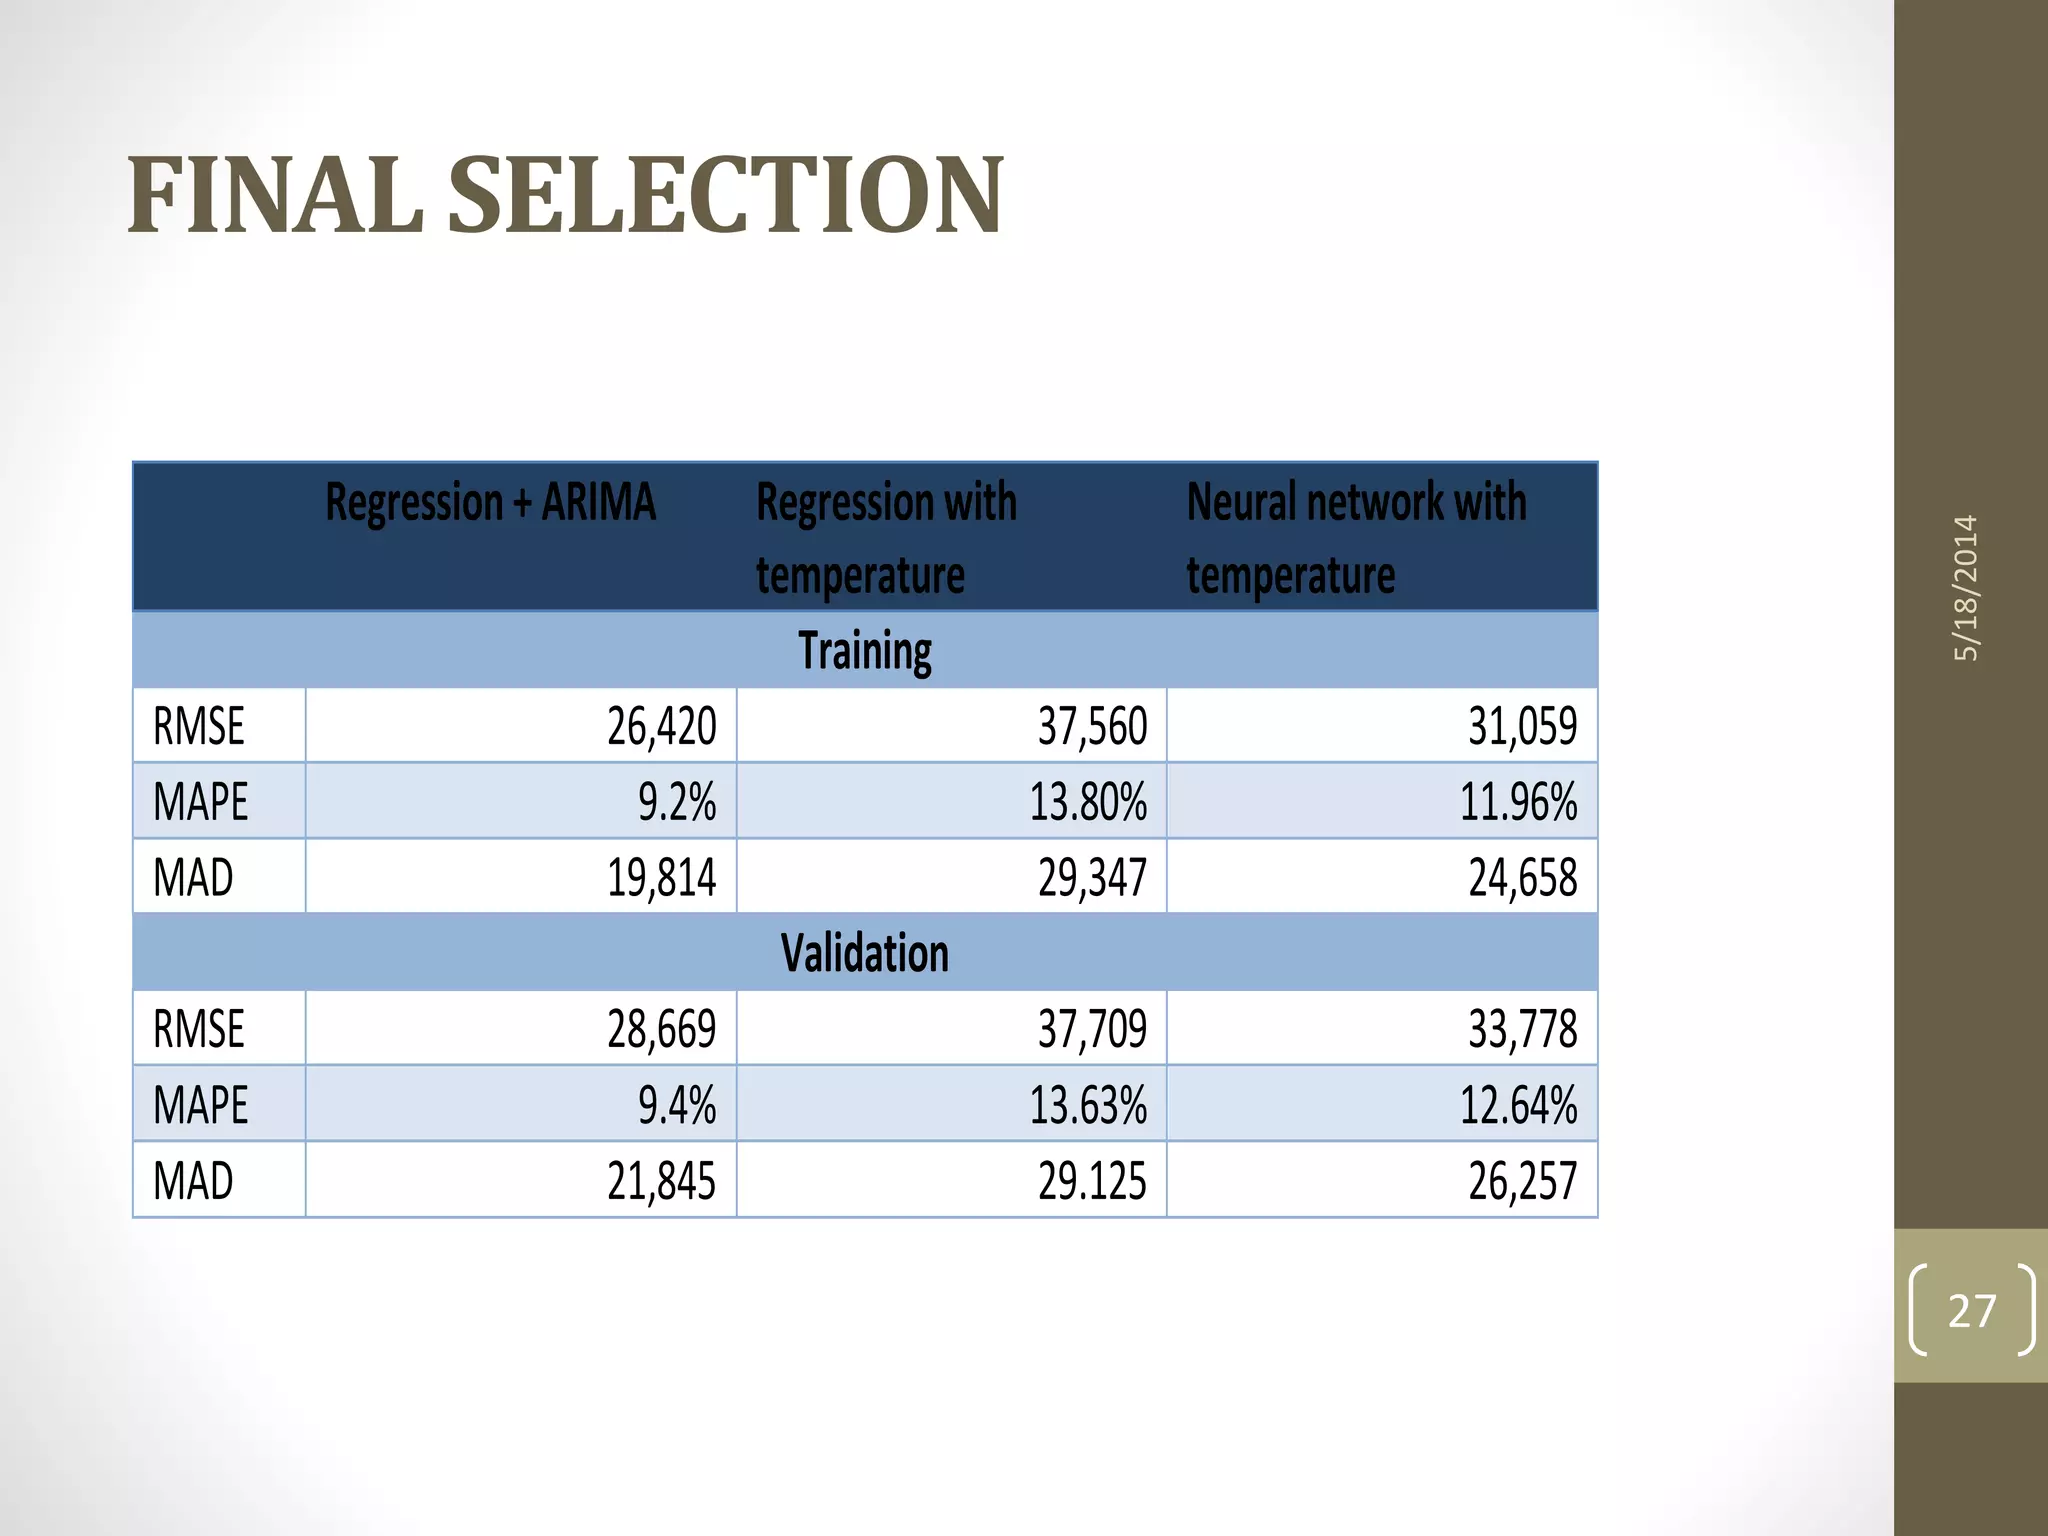
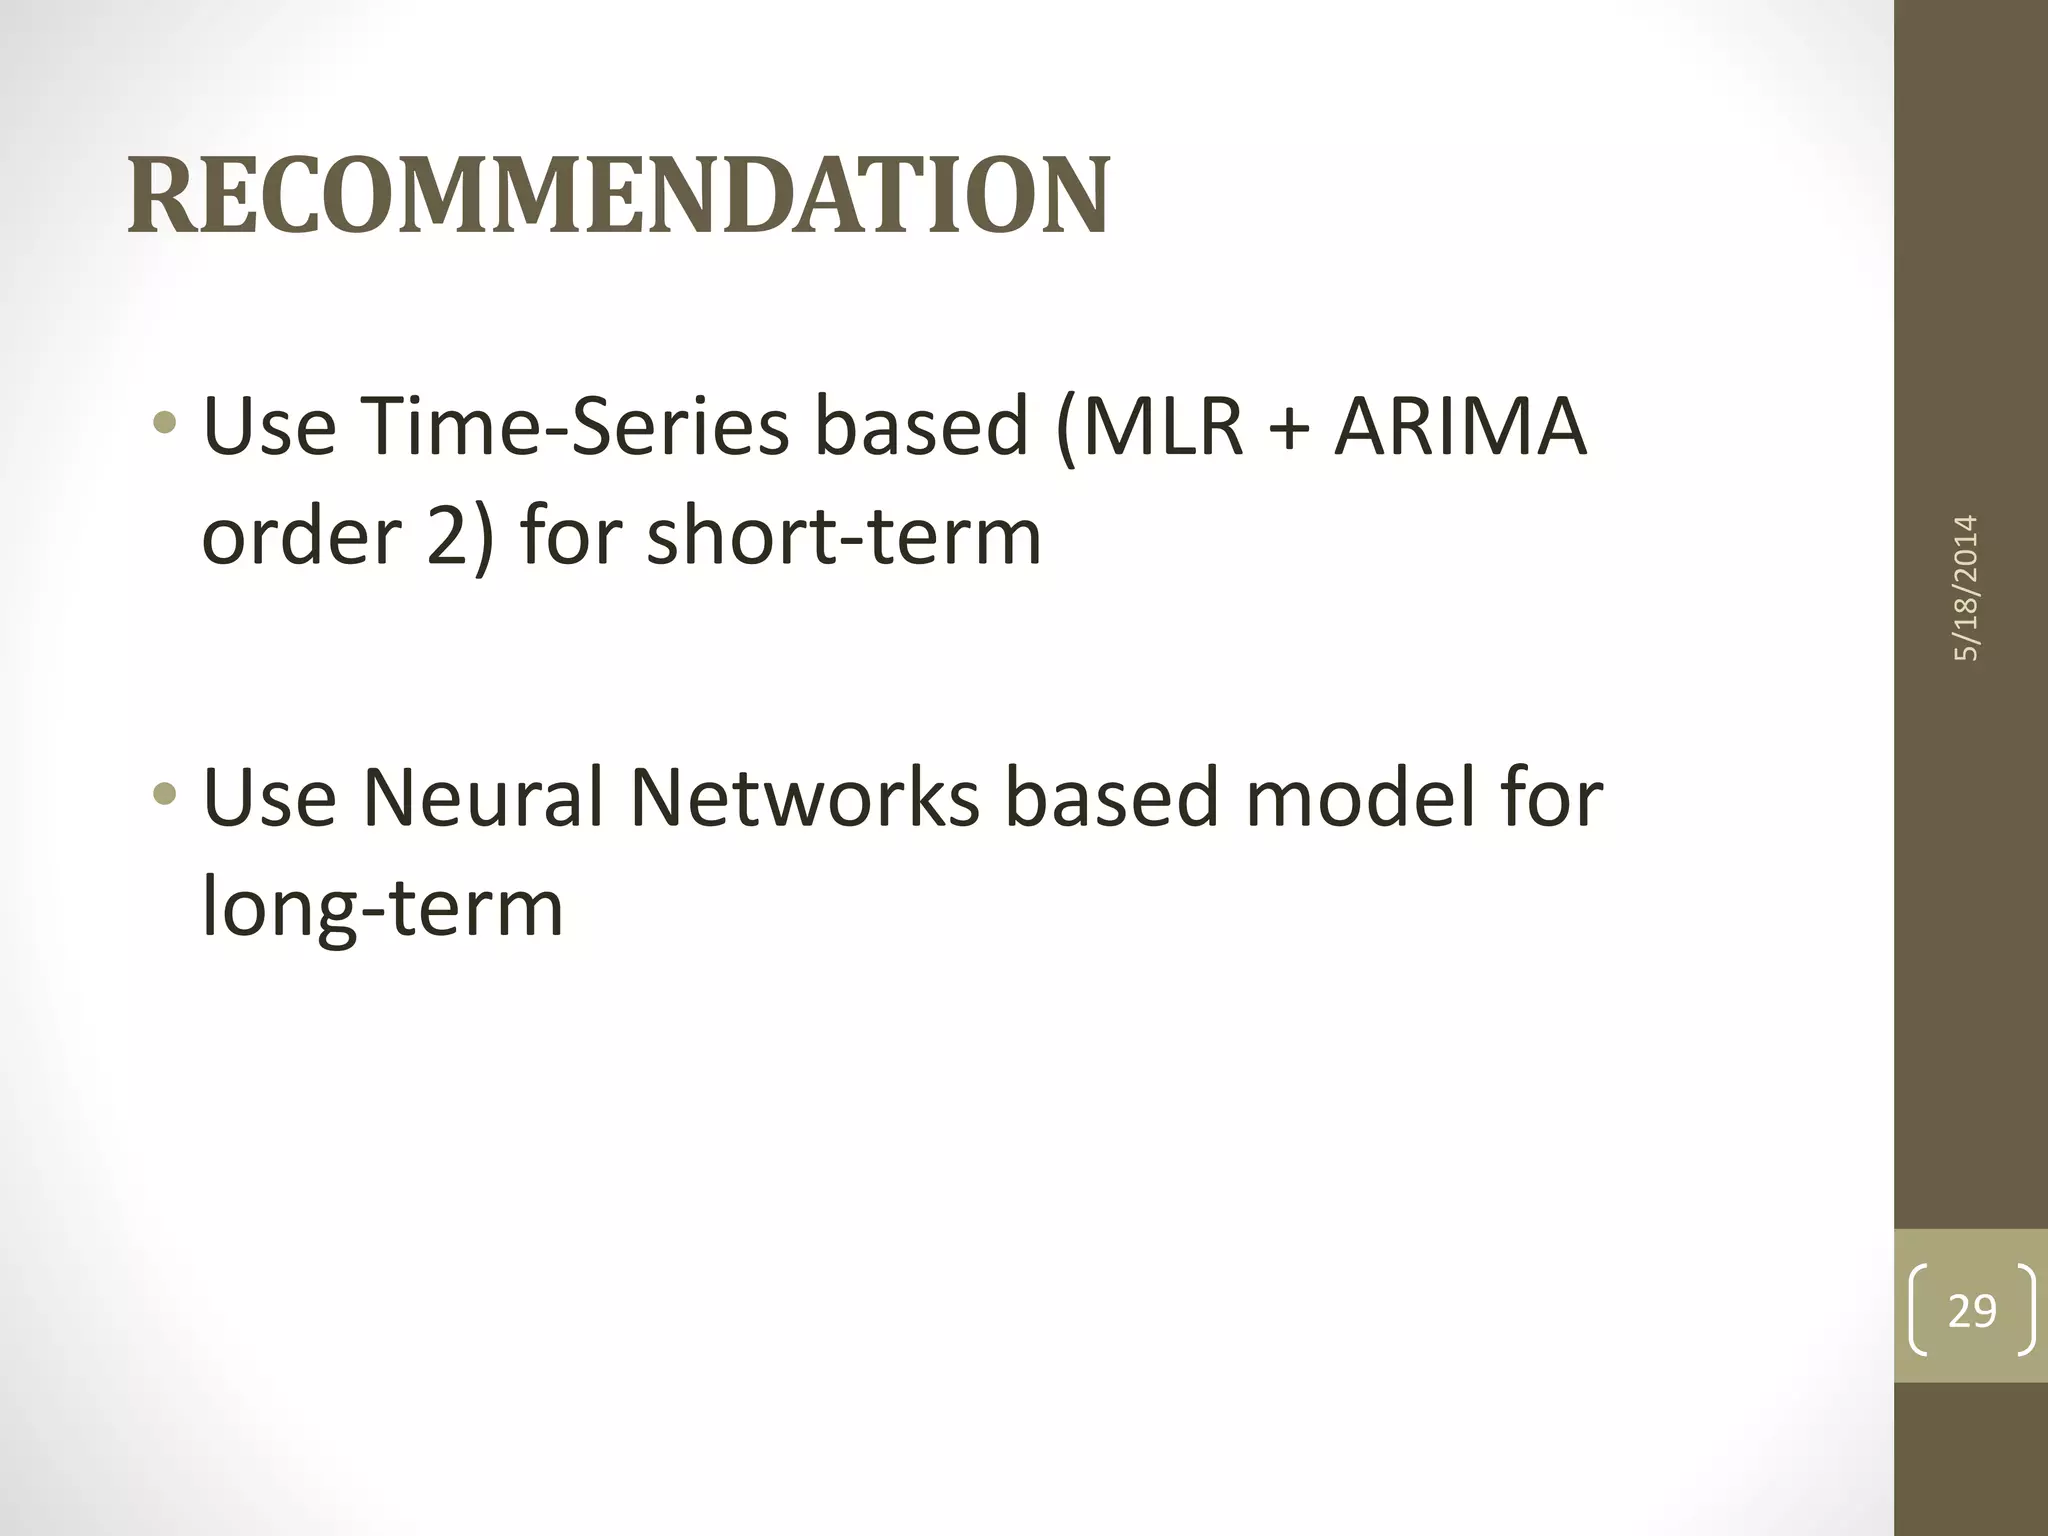
LOAD DEMAND
FORECASTING
AMAN MEHRA
ASHWIN MYSORE
DHRUV VARMA
SUHAS KASAR
1
5/18/2014
AGENDA
• Objective
• Methodology
• Data Exploration : Visualization
• Data Mining
• Analysis : Multiple Linear Regression
• Analysis : Neural Networks
• Analysis : Regression Trees
• Time Series Forecasting
• Analysis : Model Based Forecasting
• Analysis : Data Based Forecasting
• Final Model Selection
• Recommendation
• Q&A
5/18/2014
2
To develop a predictive model to forecast energy load demand
based on historical load data.
BUSINESS APPLICATION
This analysis will help utility providers (like Nstar) to balance the
grid, in terms of demand and supply. This is a constant problem
faced by them, due to the difficulty of storing energy.
3
5/18/2014
OBJECTIVE
• Source: kaggle.com.
• Load History: hourly load data (in Kw) for 20 zones.
• Time period: January 1st , 2004 to June 29th 2008.
• Temperature history: hourly temperature data from 11
stations.
• Relation between load zones and temperature stations not
provided.
5/18/2014
4
DATASET
METHODOLOGY
5/18/2014
5
5/18/2014
6
Create a model to predict load, with good predictive ability as
indicated by:
• Predictor variables
• Low Root Mean Squared Error (RMSE)
• Low Mean Absolute Percentage Error (MAPE)
• Low Mean Absolute Deviation (MAD)
TOOLS
• Tableau : for Visualization and Data Exploration.
• MS Excel : Data cleaning.
• XL Miner: Data preparation, Partitioning, and Predictive analysis.
5/18/2014
7
PROPOSED SOLUTION
DATA EXPLORATION:
VISUALIZATION
5/18/2014
8
5/18/2014
9
ZONE COMPARISON
5/18/2014
10
TIME – LOAD SCATTERPLOTS
5/18/2014
11
TIME – LOAD SCATTERPLOTS
DATA MINING
5/18/2014
12
MULTIPLE LINEAR REGRESSION
• Exhaustive Search
• Stepwise Regression
5/18/2014
13
Training Data scoring
Total SSE RMS Error Average Error
2.68472E+12 37560.3882 -0.00287194
Validation Data scoring
Total SSE RMS Error Average Error
1.80452E+12 37709.43569 -262.536391
18 predictors:
• Peak
• Weekday
• Month
• Year (indexed from 2004)
• Temperature (PC)
Predicted variable:
• Load
NEURAL NETWORK
5/18/2014
14
REGRESSION TREE
5/18/2014
15
Model 1
Model 4
TIME SERIES FORECASTING
5/18/2014
16
MODEL BASED FORECASTING
5/18/2014
17
MULTIPLE LINEAR REGRESSION
5/18/2014
18
AUTO CORRELATION
5/18/2014
19
ARIMA
5/18/2014
20
USING HISTORICALDATAIN VALIDATION
• Need for accuracy in load prediction increases closer to time.
• Used actual historical values rather than forecast.
5/18/2014
21
MOVING AVERAGE
5/18/2014
22
EXPONENTIAL SMOOTHING
5/18/2014
23
DATA BASED FORECASTING
5/18/2014
24
FINAL MODEL SELECTION
5/18/2014
25
TIME SERIES MODEL COMPARISON
5/18/2014
26
MAPE MAD RMSE MAPE MAD RMSE MAPE MAD RMSE MAPE MAD RMSE MAPE MAD RMSE
Overall 9.3% 20282.289 26955.474 10.3% 22822.534 29402.68 11.8% 25824.63 32960.324 14.9% 32894.727 41046.389 15.0% 33037.034 41178.493
Training 9.2% 19813.529 26419.515 10.2% 22215.242 28640.744 11.6% 25076.602 32016.909 14.6% 31821.683 39590.817 14.7% 31963.143 39717.925
Validation 9.4% 21844.821 28669.73 10.7% 24846.841 31810.934 12.2% 28318.057 35926.566 15.7% 36470.074 45561.936 15.7% 36615.205 45709.475
Previous Value Regression +previous residualARIMA Moving Average Exponential Smoothing
Comparison of Holt-Winter’s and secondary modeling combined models
MAPE MAD RMSE MAPE MAD RMSE MAPE MAD RMSE MAPE MAD RMSE MAPE MAD RMSE
Overall 14.0% 29096.732 46952.112 11.1% 23612.089 33612.567 17.6% 36363.833 62105.579 14.9% 32894.727 41046.389 13.3% 27786.061 39603.567
Training 8.3% 17343.106 22809.551 8.6% 17950.258 23664.047 9.0% 18580.25 24266.753 14.6% 31821.683 39590.817 9.6% 19820.69 25696.232
Validation 32.8% 68275.483 88422.762 19.6% 42484.858 55038.137 46.4% 95642.442 121454.5 15.7% 36470.074 45561.936 25.7% 54326.416 67781.677
ARIMA Moving Average ExponentialSmoothing Previous Value Regression +previous residual
Comparison of MLR and secondary modeling combined models
FINAL SELECTION
5/18/2014
27
Regression+ARIMA Regressionwith
temperature
Neural networkwith
temperature
Training
RMSE 26,420 37,560 31,059
MAPE 9.2% 13.80% 11.96%
MAD 19,814 29,347 24,658
Validation
RMSE 28,669 37,709 33,778
MAPE 9.4% 13.63% 12.64%
MAD 21,845 29.125 26,257
RECOMMENDATION
5/18/2014
28
5/18/2014
29
• Use Time-Series based (MLR + ARIMA
order 2) for short-term
• Use Neural Networks based model for
long-term
RECOMMENDATION

Load Demand Forecasting