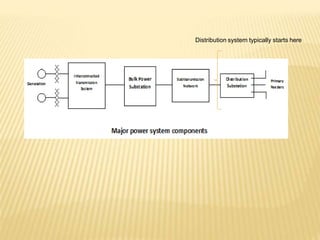
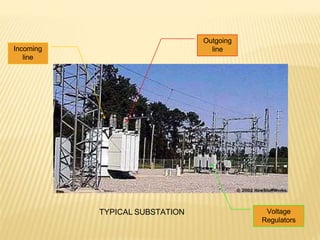
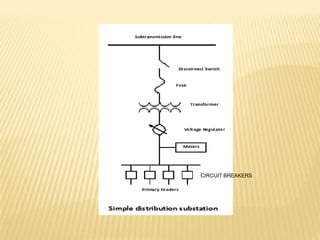
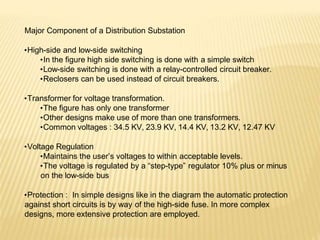
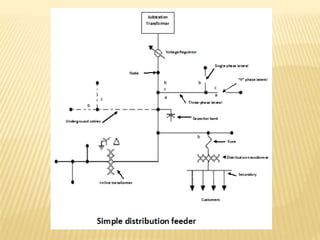
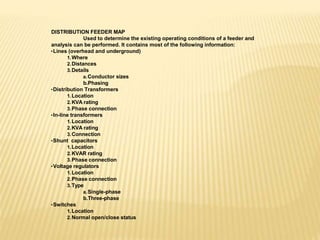
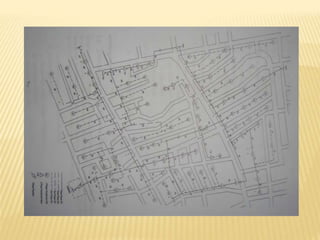
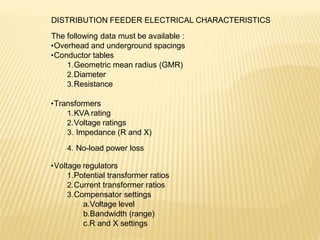
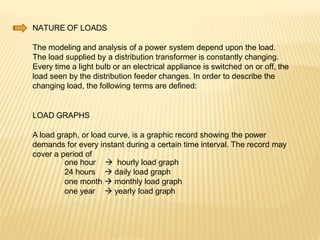
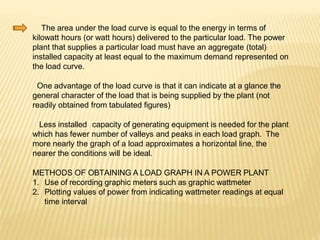
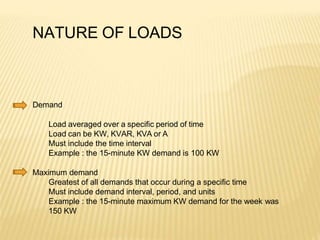
DISTRIBUTION SYSTEM
Distribution system typically starts here
Incoming
line
Outgoing
line
Voltage
Regulators
TYPICAL SUBSTATION
CIRCUIT BREAKERS
Major Component of a Distribution Substation
•High-side and low-side switching
•In the figure high side switching is done with a simple switch
•Low-side switching is done with a relay-controlled circuit breaker.
•Reclosers can be used instead of circuit breakers.
•Transformer for voltage transformation.
•The figure has only one transformer
•Other designs make use of more than one transformers.
•Common voltages : 34.5 KV, 23.9 KV, 14.4 KV, 13.2 KV, 12.47 KV
•Voltage Regulation
•Maintains the user’s voltages to within acceptable levels.
•The voltage is regulated by a “step-type” regulator 10% plus or minus
on the low-side bus
•Protection : In simple designs like in the diagram the automatic protection
against short circuits is by way of the high-side fuse. In more complex
designs, more extensive protection are employed.
DISTRIBUTION FEEDER MAP
Used to determine the existing operating conditions of a feeder and
analysis can be performed. It contains most of the following information:
•Lines (overhead and underground)
1.Where
2.Distances
3.Details
a.Conductor sizes
b.Phasing
•Distribution Transformers
1.Location
2.KVA rating
3.Phase connection
•In-line transformers
1.Location
2.KVA rating
3.Connection
•Shunt capacitors
1.Location
2.KVAR rating
3.Phase connection
•Voltage regulators
1.Location
2.Phase connection
3.Type
a.Single-phase
b.Three-phase
•Switches
1.Location
2.Normal open/close status
DISTRIBUTION FEEDER ELECTRICAL CHARACTERISTICS
The following data must be available :
•Overhead and underground spacings
•Conductor tables
1.Geometric mean radius (GMR)
2.Diameter
3.Resistance
•Transformers
1.KVA rating
2.Voltage ratings
3. Impedance (R and X)
4. No-load power loss
•Voltage regulators
1.Potential transformer ratios
2.Current transformer ratios
3.Compensator settings
a.Voltage level
b.Bandwidth (range)
c.R and X settings
NATURE OF LOADS
NATURE OF LOADS
The modeling and analysis of a power system depend upon the load.
The load supplied by a distribution transformer is constantly changing.
Every time a light bulb or an electrical appliance is switched on or off, the
load seen by the distribution feeder changes. In order to describe the
changing load, the following terms are defined:
LOAD GRAPHS
A load graph, or load curve, is a graphic record showing the power
demands for every instant during a certain time interval. The record may
cover a period of
one hour
24 hours
 hourly load graph
 daily load graph
one month  monthly load graph
one year  yearly load graph
The area under the load curve is equal to the energy in terms of
kilowatt hours (or watt hours) delivered to the particular load. The power
plant that supplies a particular load must have an aggregate (total)
installed capacity at least equal to the maximum demand represented on
the load curve.
One advantage of the load curve is that it can indicate at a glance the
general character of the load that is being supplied by the plant (not
readily obtained from tabulated figures)
Less installed capacity of generating equipment is needed for the plant
which has fewer number of valleys and peaks in each load graph. The
more nearly the graph of a load approximates a horizontal line, the
nearer the conditions will be ideal.
METHODS OF OBTAINING A LOAD GRAPH IN A POWER PLANT
1. Use of recording graphic meters such as graphic wattmeter
2. Plotting values of power from indicating wattmeter readings at equal
time interval
NATURE OF LOADS
Demand
Load averaged over a specific period of time
Load can be KW, KVAR, KVA or A
Must include the time interval
Example : the 15-minute KW demand is 100 KW
Maximum demand
Greatest of all demands that occur during a specific time
Must include demand interval, period, and units
Example : the 15-minute maximum KW demand for the week was
150 KW
Average demand
The average of the demand over a specified period (day, week,
month, …)
Must include demand interval, period, and units
Example : the 15-minute average KW demand for the month was
350 KW
Diversified demand
Sum of demands imposed by a group of loads over a particular
period
Must include demand interval, period and units
Example : the 15-minute diversified KW demand in the period
ending at 9:30 was 200 KW
Maximum diversified demand
Maximum of the sum of the demands imposed by a group of loads
over a particular period
Must include demand interval, period and units
Example : the 15-minute maximum diversified KW demand for the
week was 500 KW.
Load duration curve
The load duration curve plots the 15-minute KW demand vs. the
percent of time the transformer operates at or above the specific KW
demand.
Example : the transformer operates with a 15-minute kw demand of 12
kw or greater 22% of the time.
Maximum noncoincident demand
For a group of loads, the sum of the individual maximum demands
without any restriction that they occur at the same time
Must include demand interval, period, and units
Example : the maximum noncoincident 15-minute KW demand for the
week was 700 KW
Demand factor
The demand factor can be defined for an individual customer
maximum demand
Demand factor =
connected load
Load factor
Ratio of the average demand of any individual customer or
group of customer over a period to the maximum demand over
the same period. It gives an indication of how well the utility’s
facility is being utilized.
Average demand
Load factor =
Maximum demand
Utilization factor
Ratio of the maximum demand to rated capacity. It gives an
indication of how well the capacity of an electrical device is
being utilized.
Maximum demand
Utilization Factor =
Transformer rating
Diversity factor
Ratio of the maximum noncoincident demand of a group of
customers to the maximum diversified demand of the group.
Maximum noncoincident demand
Diversity Factor =
Maximum diversified demand
Plant factor
Ratio of the average generator load to the total rated capacity
of the equipment supplying the load.
Average generator load
Plant Factor =
Total rated capacity
Load diversity
Difference between maximum noncoincident demand and the
maximum diversified demand.
EXAMPLES ….
7
6
5
4
3
2
1
0
1 3 5 7 9 11131517192123252729313335373941434547495153555759616365676971737577798183858789919395
8
7
6
5
4
3
2
1
0
1 6 11 16 21 26 31 36 41 46 51 56 61 66 71 76 81 86 91 96
8
7
6
5
4
3
2
1
0
1 6 11 16 21 26 31 36 41 46 51 56 61 66 71 76 81 86 91 96
7
6
5
4
3
2
1
0
1 3 5 7 9 11131517192123252729313335373941434547495153555759616365676971737577798183858789919395
8
7
6
5
4
3
2
1
0
1 6 11 16 21 26 31 36 41 46 51 56 61 66 71 76 81 86 91 96
ENERGY = 58.75 KW HRS
AVERAGE DEMAND = 58.75/24 = 2.45 KW
AVERAGE
7
6
5
4
3
2
1
0
1 6 11 16 21 26 31 36 41 46 51 56 61 66 71 76 81 86 91 96
LOAD DURATION CURVE
LOAD DURATION CURVE FOR TRANSFORMER 1
10
5
0
15
35
30
25
20
1 6 11 16 21 26 31 36 41 46 51 56 61 66 71 76 81 86 91 96
Series2
EXAMPLES :
1. The total connected load of a system is 400 kW; the daily output is
700 kw-hr and the load factor is 25 %; What is the demand factor?
2. An office building has an aggregate connected load of 100 kW of
tungsten lamps and a demand factor of 50%. The total output for one
year is 84,000 kw-hrs. What is the yearly load factor? If the maximum
daily output was 250 kw-hr, find the load factor for that day.
3. The following three loads have individual maximum demands of (a)
200 kW (b) 300 kW and (c) 600 kW. The maximum diversified demand
for the loads is 1,000 kW. Calculate the diversity factor.
4. Two isolated plants have a capacity of 1,760 kw each and each is fully
loaded for several hours each day. The diversity factor of the two loads
is 1.1. Explain fully the advantages of interconnecting the two plants
giving actual reserve thus obtained.
5. Given the following electrical system:
Motor A : rated input : 1,000 kW
peak: 700 kW
average load : 300 kW
Motor B : rated input : 2,000 kW
peak: 1,100 kW
average load : 500 kW
A 2,000 kW generator C supplying these motors has a maximum load
of 1,200 kW.
a) What are the demand factors for A, B and C?
b) What are the load factors for A, B and C?
c) What is the diversity factor for the combined load A and B?
d) What is the plant factor for the above installation?
EXAMPLES :
1. The total connected load of a system is 400 kW; the daily output is
700 kw-hr and the load factor is 25 %; What is the demand factor?
Demand factor = Maximum Demand/Total Connected load
Load factor = Average Load/Maximum Demand
Maximum demand = Average load / load factor
Average load = 700 kw-hr/24 hrs = 29.17 kw
Maximum Demand = 29.17 / 0.25 = 116.68 kW
Demand Factor = 116.68/400 = 0.2917
2. An office building has an aggregate connected load of 100 kW of
tungsten lamps and a demand factor of 50%. The total output for one
year is 84,000 kw-hrs. What is the yearly load factor? If the maximum
daily output was 250 kw-hr, find the load factor for that day.
Load factor = Average / Maximum
Average = 84,000 / 8760 = 9.59 kW
Demand Factor = Maximum/Total connected load
Maximum = Demand Factor * Total connected load
= 0.50 * 100 kW = 50 kW
Load factor = 9.59/50 = 0.1918
Average = 250 /24 = 10.417
Load factor = 10.417/ 50 = 0.208
3. The following three loads have individual maximum demands of (a) 200 kW (b)
300 kW and (c) 600 kW. The maximum diversified demand for the loads is
1,000 kW. Calculate the diversity factor.
Diversity factor = Sum of non-coincidental demands/max diversified demand
= ( 200 + 300 + 600 ) /1000
= 1.1
4. Two isolated plants have a capacity of 1,760 kw each and each is fully loaded
for several hours each day. The diversity factor of the two loads is 1.1. Explain
fully the advantages of interconnecting the two plants giving actual reserve
thus obtained.
If the two plants are independent from each other they have no reserve since
they are fully loaded for several hours each day.
If the two plants are interconnected together with a diversity factor of 1.1 the
maximum diversified will be
maximum div demand = sum of non-coinc. Dem / div factor
= (1760+1760)/1.1
= 3200 kW
total capacity of plant = 1760+1760 = 3520
There will be an excess capacity (reserve) = 3520-3200=320kW
5. Given the following electrical system:
Motor A : rated input : 1,000 kW
peak: 700 kW
average load : 300 kW
Motor B : rated input : 2,000 kW
peak: 1,100 kW
average load : 500 kW
A 2,000 kW generator C supplying these motors has a maximum load
of 1,200 kW.
a) What are the demand factors f or A, B and C?
Demand factor = maximum demand/total connected load
For Motor A : Demand factor = 700/1000 = 0.7
For Motor B: Demand factor = 1,100/2000 = 0.55
For Generator C : Demand factor = 1200/(1000+2000)=0.4
b) What are the load factors for A, B and C?
Load factor = average load / maximum demand
For motor A : Load factor = 300/700 = 0.428
For motor B : Load factor = 500/1100 = 0.45
For generator C: Load factor = (300+500)/1200=0.667
c) What is the diversity factor for the combined load A and B?
Diversity factor = sum of non-coincidental maximum demand/
maximum diversified demand
=(700+1100)/1200 = 1.5
d) What is the plant factor for the above installation?
Plant factor = average demand/total rated capacity of generator
= (300+500) /2000 =0.4
FEEDER LOADS
Load Allocation
In the analysis of a distribution feeder load, data will
have to be specified. The data provided will depend
upon how detailed the feeder is to be modeled, and
the availability of customer load data.
The most comprehensive model of a feeder will
represent every distribution transformer. In this case,
the load allocated to each transformer will have to be
determined.
Determine the Diversified Demand of the Transformer
The maximum diversified demand becomes the allocated
load for the transformer.
Example :
A single-phase lateral provides service to three
distribution transformers as shown in the following
figure. A load survey has been conducted for
customers in this class, and the customer 15-minute
kw demand is individually obtained.
Single-phase lateral.
DIVERSIFIED DEMAND FOR TRANSFORMER 1
Assuming a power factor of 0.9, the maximum kva diversified
demand on each transformer would be:
17.70
Max. KVAT1 demand = --------- = 19.67 KVA
0.9
35.5
Max. KVAT2 demand = -------- = 39.4 KVA
0.9
48.9
Max. KVAT3 demand = -------- = 54.3 KVA
0.9
The KVA ratings selected for the three transformers would be
(Based from the standard ratings of transformers)
T1 = 15 KVA
T2 = 37.5 KVA
T3 = 50 KVA
Computations
not shown
CALCULATIONS FOR PERMISSIBLE OVERLOAD :
DETERMINE THE FOLLOWING :
- MAXIMUM DEMAND FOR THE TRANSFORMER IS 19.67 KVA
- RATING OF TRANSFORMER (TENTATIVE) IS 15 KVA
- KVA OVERLOAD IS 19.67-15 = 4.67 KVA
CALCULATE THE PERMISSIBLE OVERLOAD :
1. DURATION OF OVERLOAD = 1.75 HOURS
2. TAKE THE AVERAGE LOAD
a) 2 HRS LOAD BEFORE OVERLOAD
11.44 KVA
10.67 KVA
10.22 KVA
10.78 KVA
11.33 KVA
10.89 KVA
11.33 KVA
11.78 KVA
AVE= 11.06 KVA
% LOAD =11.06/15 = 73.73 %
b) 24 HRS DURATION
AVE = 11.16 KVA
% LOAD = 11.16/15 = 74.40% (HIGHER)
USE THE 70% CURVE
USE THE 70% CURVE INITIAL
LOAD AND WITH A 1.75 HRS
DURATION OF OVERLOAD.
THE PERMISSIBLE OVERLOAD
FOR THE TRANSFORMER FOR
1.75 HRS IS 145% OF THE
RATED KVA WHICH IS EQUAL
TO :
1.45 * 15 KVA = 21.75 KVA
HIGHER THAN THE MAX
OVERLOAD OF 19.67 KVA.
Lecture-on-DISTRIBUTION-SYSTEM-edited.pptx

Lecture-on-DISTRIBUTION-SYSTEM-edited.pptx

  • 1.
  • 2.
  • 3.
  • 4.
  • 5.
    Major Component ofa Distribution Substation •High-side and low-side switching •In the figure high side switching is done with a simple switch •Low-side switching is done with a relay-controlled circuit breaker. •Reclosers can be used instead of circuit breakers. •Transformer for voltage transformation. •The figure has only one transformer •Other designs make use of more than one transformers. •Common voltages : 34.5 KV, 23.9 KV, 14.4 KV, 13.2 KV, 12.47 KV •Voltage Regulation •Maintains the user’s voltages to within acceptable levels. •The voltage is regulated by a “step-type” regulator 10% plus or minus on the low-side bus •Protection : In simple designs like in the diagram the automatic protection against short circuits is by way of the high-side fuse. In more complex designs, more extensive protection are employed.
  • 7.
    DISTRIBUTION FEEDER MAP Usedto determine the existing operating conditions of a feeder and analysis can be performed. It contains most of the following information: •Lines (overhead and underground) 1.Where 2.Distances 3.Details a.Conductor sizes b.Phasing •Distribution Transformers 1.Location 2.KVA rating 3.Phase connection •In-line transformers 1.Location 2.KVA rating 3.Connection •Shunt capacitors 1.Location 2.KVAR rating 3.Phase connection •Voltage regulators 1.Location 2.Phase connection 3.Type a.Single-phase b.Three-phase •Switches 1.Location 2.Normal open/close status
  • 9.
    DISTRIBUTION FEEDER ELECTRICALCHARACTERISTICS The following data must be available : •Overhead and underground spacings •Conductor tables 1.Geometric mean radius (GMR) 2.Diameter 3.Resistance •Transformers 1.KVA rating 2.Voltage ratings 3. Impedance (R and X) 4. No-load power loss •Voltage regulators 1.Potential transformer ratios 2.Current transformer ratios 3.Compensator settings a.Voltage level b.Bandwidth (range) c.R and X settings
  • 10.
  • 11.
    NATURE OF LOADS Themodeling and analysis of a power system depend upon the load. The load supplied by a distribution transformer is constantly changing. Every time a light bulb or an electrical appliance is switched on or off, the load seen by the distribution feeder changes. In order to describe the changing load, the following terms are defined: LOAD GRAPHS A load graph, or load curve, is a graphic record showing the power demands for every instant during a certain time interval. The record may cover a period of one hour 24 hours  hourly load graph  daily load graph one month  monthly load graph one year  yearly load graph
  • 12.
    The area underthe load curve is equal to the energy in terms of kilowatt hours (or watt hours) delivered to the particular load. The power plant that supplies a particular load must have an aggregate (total) installed capacity at least equal to the maximum demand represented on the load curve. One advantage of the load curve is that it can indicate at a glance the general character of the load that is being supplied by the plant (not readily obtained from tabulated figures) Less installed capacity of generating equipment is needed for the plant which has fewer number of valleys and peaks in each load graph. The more nearly the graph of a load approximates a horizontal line, the nearer the conditions will be ideal. METHODS OF OBTAINING A LOAD GRAPH IN A POWER PLANT 1. Use of recording graphic meters such as graphic wattmeter 2. Plotting values of power from indicating wattmeter readings at equal time interval
  • 13.
    NATURE OF LOADS Demand Loadaveraged over a specific period of time Load can be KW, KVAR, KVA or A Must include the time interval Example : the 15-minute KW demand is 100 KW Maximum demand Greatest of all demands that occur during a specific time Must include demand interval, period, and units Example : the 15-minute maximum KW demand for the week was 150 KW
  • 14.
    Average demand The averageof the demand over a specified period (day, week, month, …) Must include demand interval, period, and units Example : the 15-minute average KW demand for the month was 350 KW Diversified demand Sum of demands imposed by a group of loads over a particular period Must include demand interval, period and units Example : the 15-minute diversified KW demand in the period ending at 9:30 was 200 KW Maximum diversified demand Maximum of the sum of the demands imposed by a group of loads over a particular period Must include demand interval, period and units Example : the 15-minute maximum diversified KW demand for the week was 500 KW.
  • 15.
    Load duration curve Theload duration curve plots the 15-minute KW demand vs. the percent of time the transformer operates at or above the specific KW demand. Example : the transformer operates with a 15-minute kw demand of 12 kw or greater 22% of the time. Maximum noncoincident demand For a group of loads, the sum of the individual maximum demands without any restriction that they occur at the same time Must include demand interval, period, and units Example : the maximum noncoincident 15-minute KW demand for the week was 700 KW
  • 16.
    Demand factor The demandfactor can be defined for an individual customer maximum demand Demand factor = connected load Load factor Ratio of the average demand of any individual customer or group of customer over a period to the maximum demand over the same period. It gives an indication of how well the utility’s facility is being utilized. Average demand Load factor = Maximum demand
  • 17.
    Utilization factor Ratio ofthe maximum demand to rated capacity. It gives an indication of how well the capacity of an electrical device is being utilized. Maximum demand Utilization Factor = Transformer rating Diversity factor Ratio of the maximum noncoincident demand of a group of customers to the maximum diversified demand of the group. Maximum noncoincident demand Diversity Factor = Maximum diversified demand
  • 18.
    Plant factor Ratio ofthe average generator load to the total rated capacity of the equipment supplying the load. Average generator load Plant Factor = Total rated capacity
  • 19.
    Load diversity Difference betweenmaximum noncoincident demand and the maximum diversified demand. EXAMPLES ….
  • 21.
    7 6 5 4 3 2 1 0 1 3 57 9 11131517192123252729313335373941434547495153555759616365676971737577798183858789919395 8 7 6 5 4 3 2 1 0 1 6 11 16 21 26 31 36 41 46 51 56 61 66 71 76 81 86 91 96
  • 22.
    8 7 6 5 4 3 2 1 0 1 6 1116 21 26 31 36 41 46 51 56 61 66 71 76 81 86 91 96 7 6 5 4 3 2 1 0 1 3 5 7 9 11131517192123252729313335373941434547495153555759616365676971737577798183858789919395
  • 23.
    8 7 6 5 4 3 2 1 0 1 6 1116 21 26 31 36 41 46 51 56 61 66 71 76 81 86 91 96 ENERGY = 58.75 KW HRS AVERAGE DEMAND = 58.75/24 = 2.45 KW AVERAGE
  • 24.
    7 6 5 4 3 2 1 0 1 6 1116 21 26 31 36 41 46 51 56 61 66 71 76 81 86 91 96 LOAD DURATION CURVE
  • 25.
    LOAD DURATION CURVEFOR TRANSFORMER 1 10 5 0 15 35 30 25 20 1 6 11 16 21 26 31 36 41 46 51 56 61 66 71 76 81 86 91 96 Series2
  • 27.
    EXAMPLES : 1. Thetotal connected load of a system is 400 kW; the daily output is 700 kw-hr and the load factor is 25 %; What is the demand factor? 2. An office building has an aggregate connected load of 100 kW of tungsten lamps and a demand factor of 50%. The total output for one year is 84,000 kw-hrs. What is the yearly load factor? If the maximum daily output was 250 kw-hr, find the load factor for that day. 3. The following three loads have individual maximum demands of (a) 200 kW (b) 300 kW and (c) 600 kW. The maximum diversified demand for the loads is 1,000 kW. Calculate the diversity factor. 4. Two isolated plants have a capacity of 1,760 kw each and each is fully loaded for several hours each day. The diversity factor of the two loads is 1.1. Explain fully the advantages of interconnecting the two plants giving actual reserve thus obtained.
  • 28.
    5. Given thefollowing electrical system: Motor A : rated input : 1,000 kW peak: 700 kW average load : 300 kW Motor B : rated input : 2,000 kW peak: 1,100 kW average load : 500 kW A 2,000 kW generator C supplying these motors has a maximum load of 1,200 kW. a) What are the demand factors for A, B and C? b) What are the load factors for A, B and C? c) What is the diversity factor for the combined load A and B? d) What is the plant factor for the above installation?
  • 29.
    EXAMPLES : 1. Thetotal connected load of a system is 400 kW; the daily output is 700 kw-hr and the load factor is 25 %; What is the demand factor? Demand factor = Maximum Demand/Total Connected load Load factor = Average Load/Maximum Demand Maximum demand = Average load / load factor Average load = 700 kw-hr/24 hrs = 29.17 kw Maximum Demand = 29.17 / 0.25 = 116.68 kW Demand Factor = 116.68/400 = 0.2917 2. An office building has an aggregate connected load of 100 kW of tungsten lamps and a demand factor of 50%. The total output for one year is 84,000 kw-hrs. What is the yearly load factor? If the maximum daily output was 250 kw-hr, find the load factor for that day. Load factor = Average / Maximum Average = 84,000 / 8760 = 9.59 kW
  • 30.
    2. An officebuilding has an aggregate connected load of 100 kW of tungsten lamps and a demand factor of 50%. The total output for one year is 84,000 kw-hrs. What is the yearly load factor? If the maximum daily output was 250 kw-hr, find the load factor for that day. Load factor = Average / Maximum Average = 84,000 / 8760 = 9.59 kW Demand Factor = Maximum/Total connected load Maximum = Demand Factor * Total connected load = 0.50 * 100 kW = 50 kW Load factor = 9.59/50 = 0.1918 Average = 250 /24 = 10.417 Load factor = 10.417/ 50 = 0.208
  • 31.
    3. The followingthree loads have individual maximum demands of (a) 200 kW (b) 300 kW and (c) 600 kW. The maximum diversified demand for the loads is 1,000 kW. Calculate the diversity factor. Diversity factor = Sum of non-coincidental demands/max diversified demand = ( 200 + 300 + 600 ) /1000 = 1.1 4. Two isolated plants have a capacity of 1,760 kw each and each is fully loaded for several hours each day. The diversity factor of the two loads is 1.1. Explain fully the advantages of interconnecting the two plants giving actual reserve thus obtained. If the two plants are independent from each other they have no reserve since they are fully loaded for several hours each day. If the two plants are interconnected together with a diversity factor of 1.1 the maximum diversified will be maximum div demand = sum of non-coinc. Dem / div factor = (1760+1760)/1.1 = 3200 kW total capacity of plant = 1760+1760 = 3520 There will be an excess capacity (reserve) = 3520-3200=320kW
  • 32.
    5. Given thefollowing electrical system: Motor A : rated input : 1,000 kW peak: 700 kW average load : 300 kW Motor B : rated input : 2,000 kW peak: 1,100 kW average load : 500 kW A 2,000 kW generator C supplying these motors has a maximum load of 1,200 kW. a) What are the demand factors f or A, B and C? Demand factor = maximum demand/total connected load For Motor A : Demand factor = 700/1000 = 0.7 For Motor B: Demand factor = 1,100/2000 = 0.55 For Generator C : Demand factor = 1200/(1000+2000)=0.4
  • 33.
    b) What arethe load factors for A, B and C? Load factor = average load / maximum demand For motor A : Load factor = 300/700 = 0.428 For motor B : Load factor = 500/1100 = 0.45 For generator C: Load factor = (300+500)/1200=0.667 c) What is the diversity factor for the combined load A and B? Diversity factor = sum of non-coincidental maximum demand/ maximum diversified demand =(700+1100)/1200 = 1.5 d) What is the plant factor for the above installation? Plant factor = average demand/total rated capacity of generator = (300+500) /2000 =0.4
  • 37.
    FEEDER LOADS Load Allocation Inthe analysis of a distribution feeder load, data will have to be specified. The data provided will depend upon how detailed the feeder is to be modeled, and the availability of customer load data. The most comprehensive model of a feeder will represent every distribution transformer. In this case, the load allocated to each transformer will have to be determined.
  • 38.
    Determine the DiversifiedDemand of the Transformer The maximum diversified demand becomes the allocated load for the transformer.
  • 39.
    Example : A single-phaselateral provides service to three distribution transformers as shown in the following figure. A load survey has been conducted for customers in this class, and the customer 15-minute kw demand is individually obtained.
  • 40.
  • 41.
  • 42.
    Assuming a powerfactor of 0.9, the maximum kva diversified demand on each transformer would be: 17.70 Max. KVAT1 demand = --------- = 19.67 KVA 0.9 35.5 Max. KVAT2 demand = -------- = 39.4 KVA 0.9 48.9 Max. KVAT3 demand = -------- = 54.3 KVA 0.9 The KVA ratings selected for the three transformers would be (Based from the standard ratings of transformers) T1 = 15 KVA T2 = 37.5 KVA T3 = 50 KVA Computations not shown
  • 43.
    CALCULATIONS FOR PERMISSIBLEOVERLOAD : DETERMINE THE FOLLOWING : - MAXIMUM DEMAND FOR THE TRANSFORMER IS 19.67 KVA - RATING OF TRANSFORMER (TENTATIVE) IS 15 KVA - KVA OVERLOAD IS 19.67-15 = 4.67 KVA CALCULATE THE PERMISSIBLE OVERLOAD : 1. DURATION OF OVERLOAD = 1.75 HOURS 2. TAKE THE AVERAGE LOAD a) 2 HRS LOAD BEFORE OVERLOAD 11.44 KVA 10.67 KVA 10.22 KVA 10.78 KVA 11.33 KVA 10.89 KVA 11.33 KVA 11.78 KVA AVE= 11.06 KVA % LOAD =11.06/15 = 73.73 % b) 24 HRS DURATION AVE = 11.16 KVA % LOAD = 11.16/15 = 74.40% (HIGHER) USE THE 70% CURVE
  • 44.
    USE THE 70%CURVE INITIAL LOAD AND WITH A 1.75 HRS DURATION OF OVERLOAD. THE PERMISSIBLE OVERLOAD FOR THE TRANSFORMER FOR 1.75 HRS IS 145% OF THE RATED KVA WHICH IS EQUAL TO : 1.45 * 15 KVA = 21.75 KVA HIGHER THAN THE MAX OVERLOAD OF 19.67 KVA.