Download as PDF, PPTX

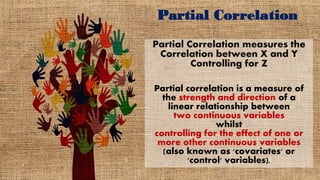
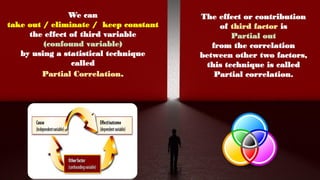
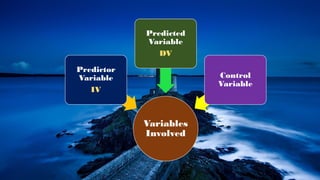
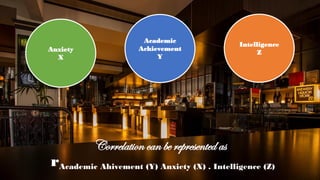
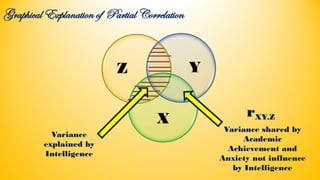
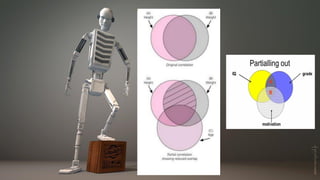
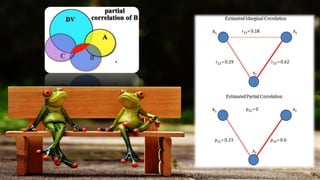
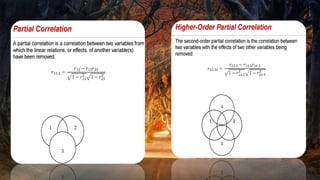

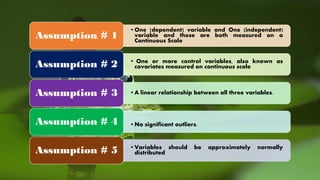
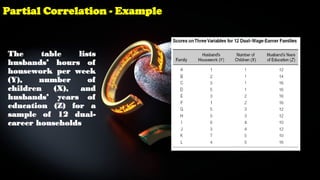
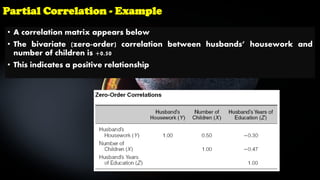
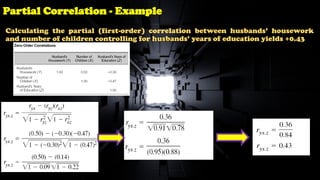
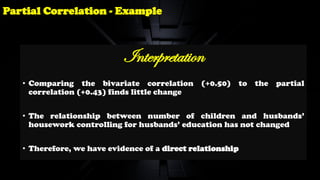
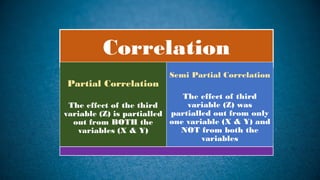
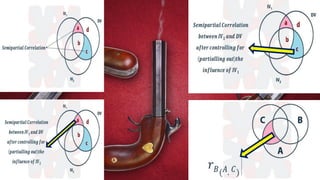
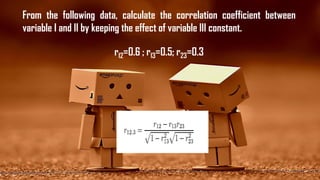


Partial correlation is a statistical method used to measure the strength and direction of a linear relationship between two continuous variables while controlling for one or more other variables, known as covariates. It eliminates the effects of confounding variables to reveal the true relationship between the primary variables. The document also includes assumptions for conducting partial correlation and provides illustrative examples detailing calculations and interpretations.