Downloaded 114 times


![Finding the Median
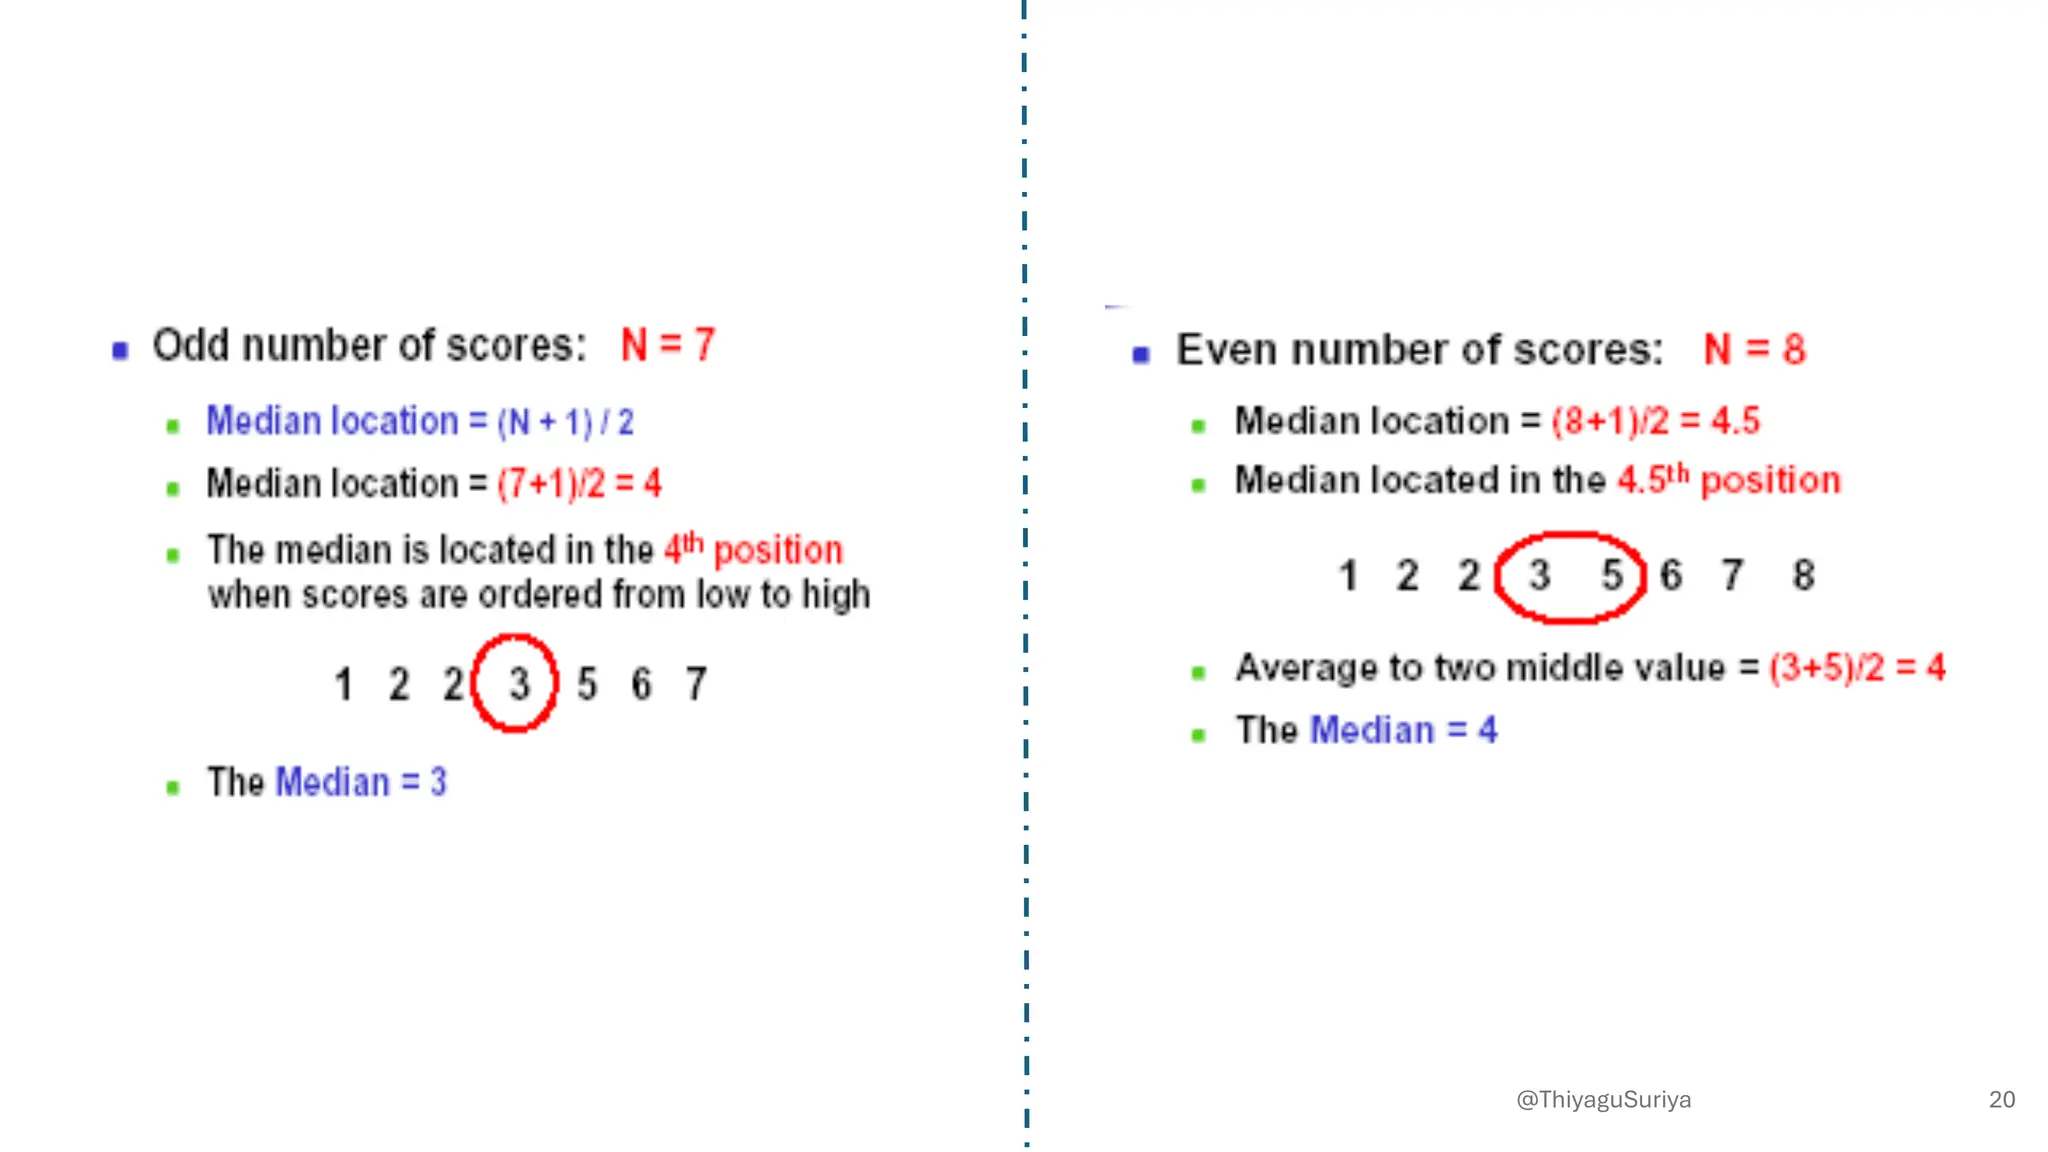
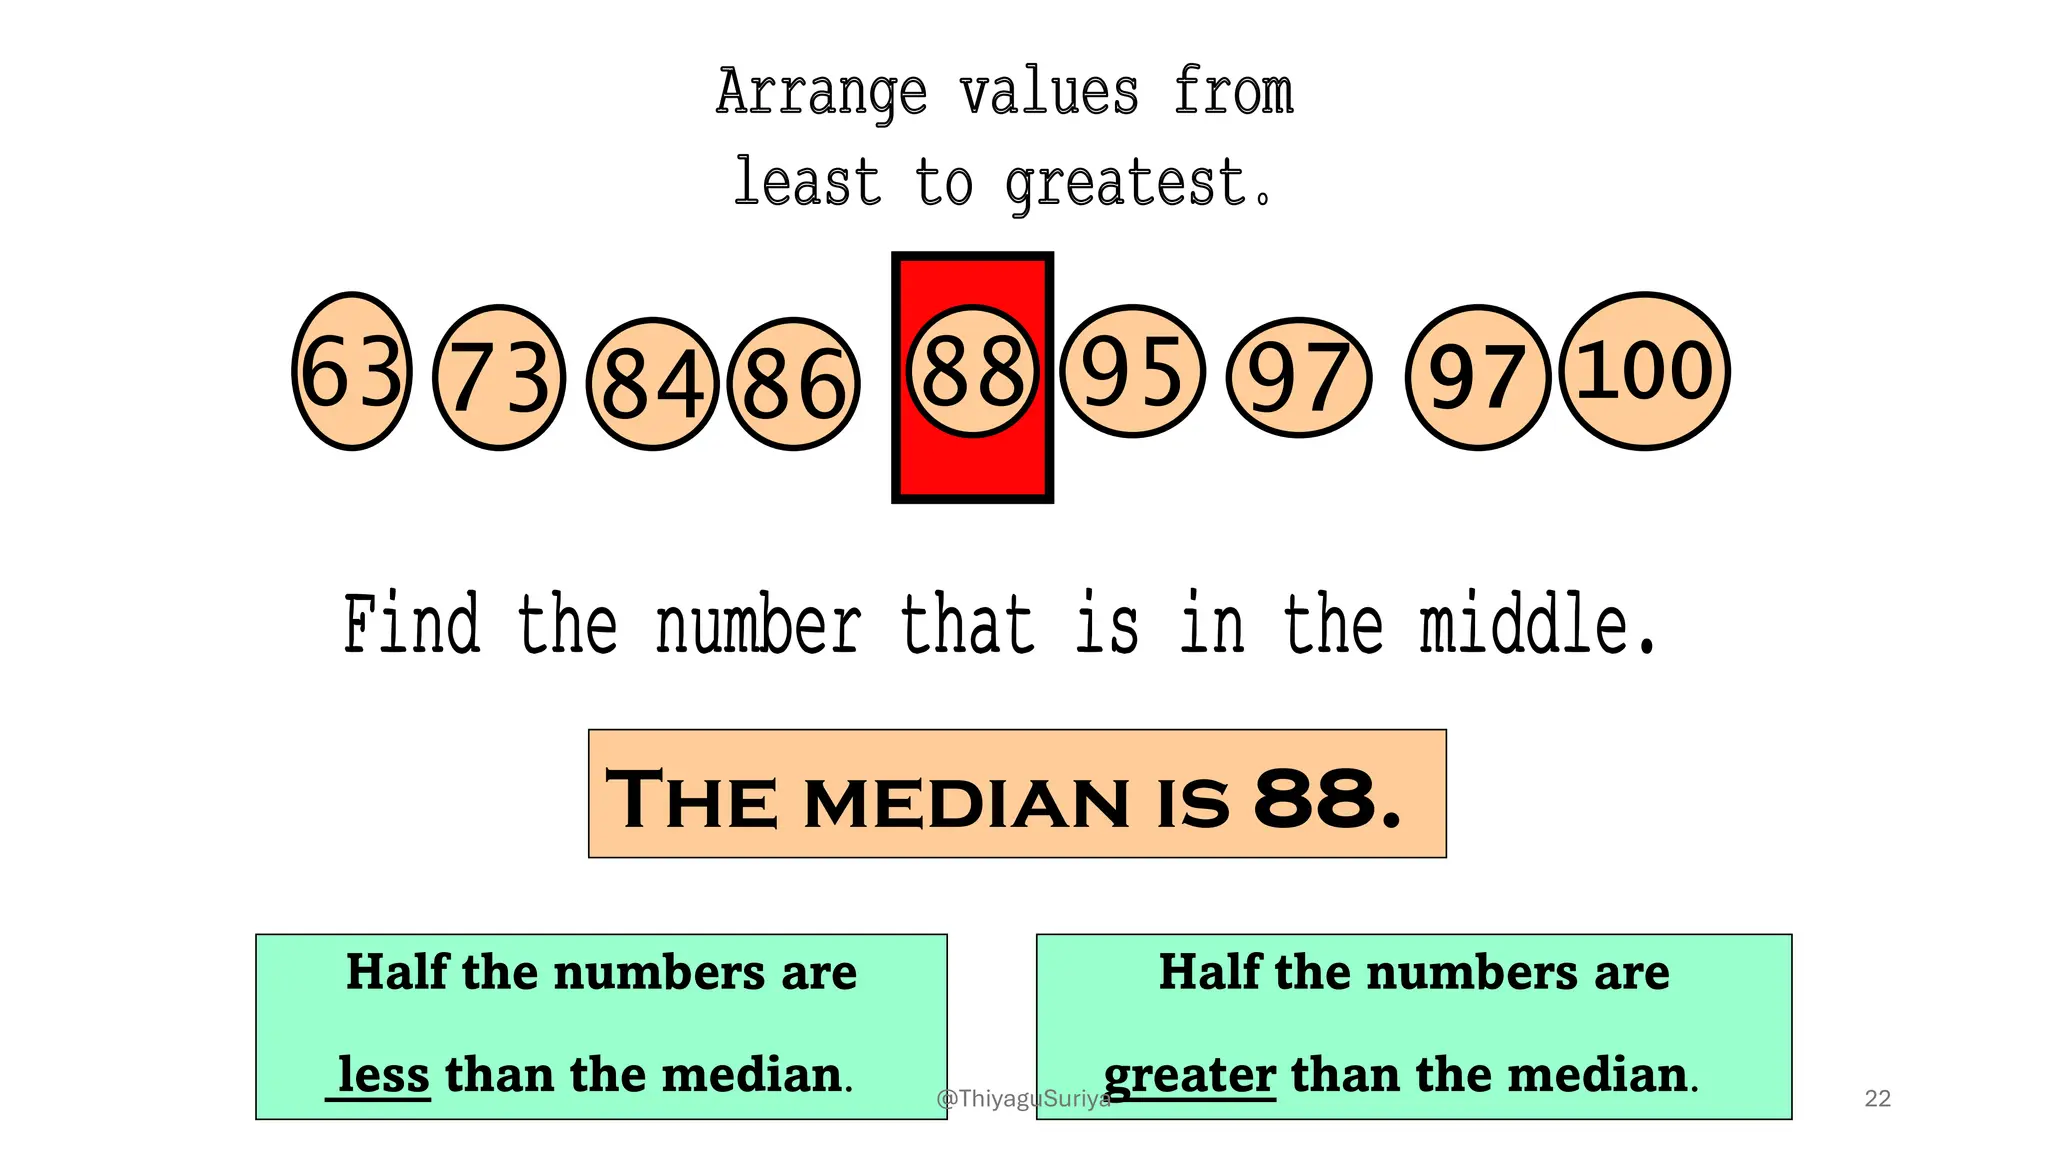
1. Arrange the scores in ascending or
descending numerical order
2. Calculate the value of [(N+1)/2]
3. round the {(N+1)/2]th item
17
@ThiyaguSuriya](https://image.slidesharecdn.com/measuresofcentraltendency-240430124557-b243a537/75/Measures-of-Central-Tendency-Mean-Median-and-Mode-17-2048.jpg)


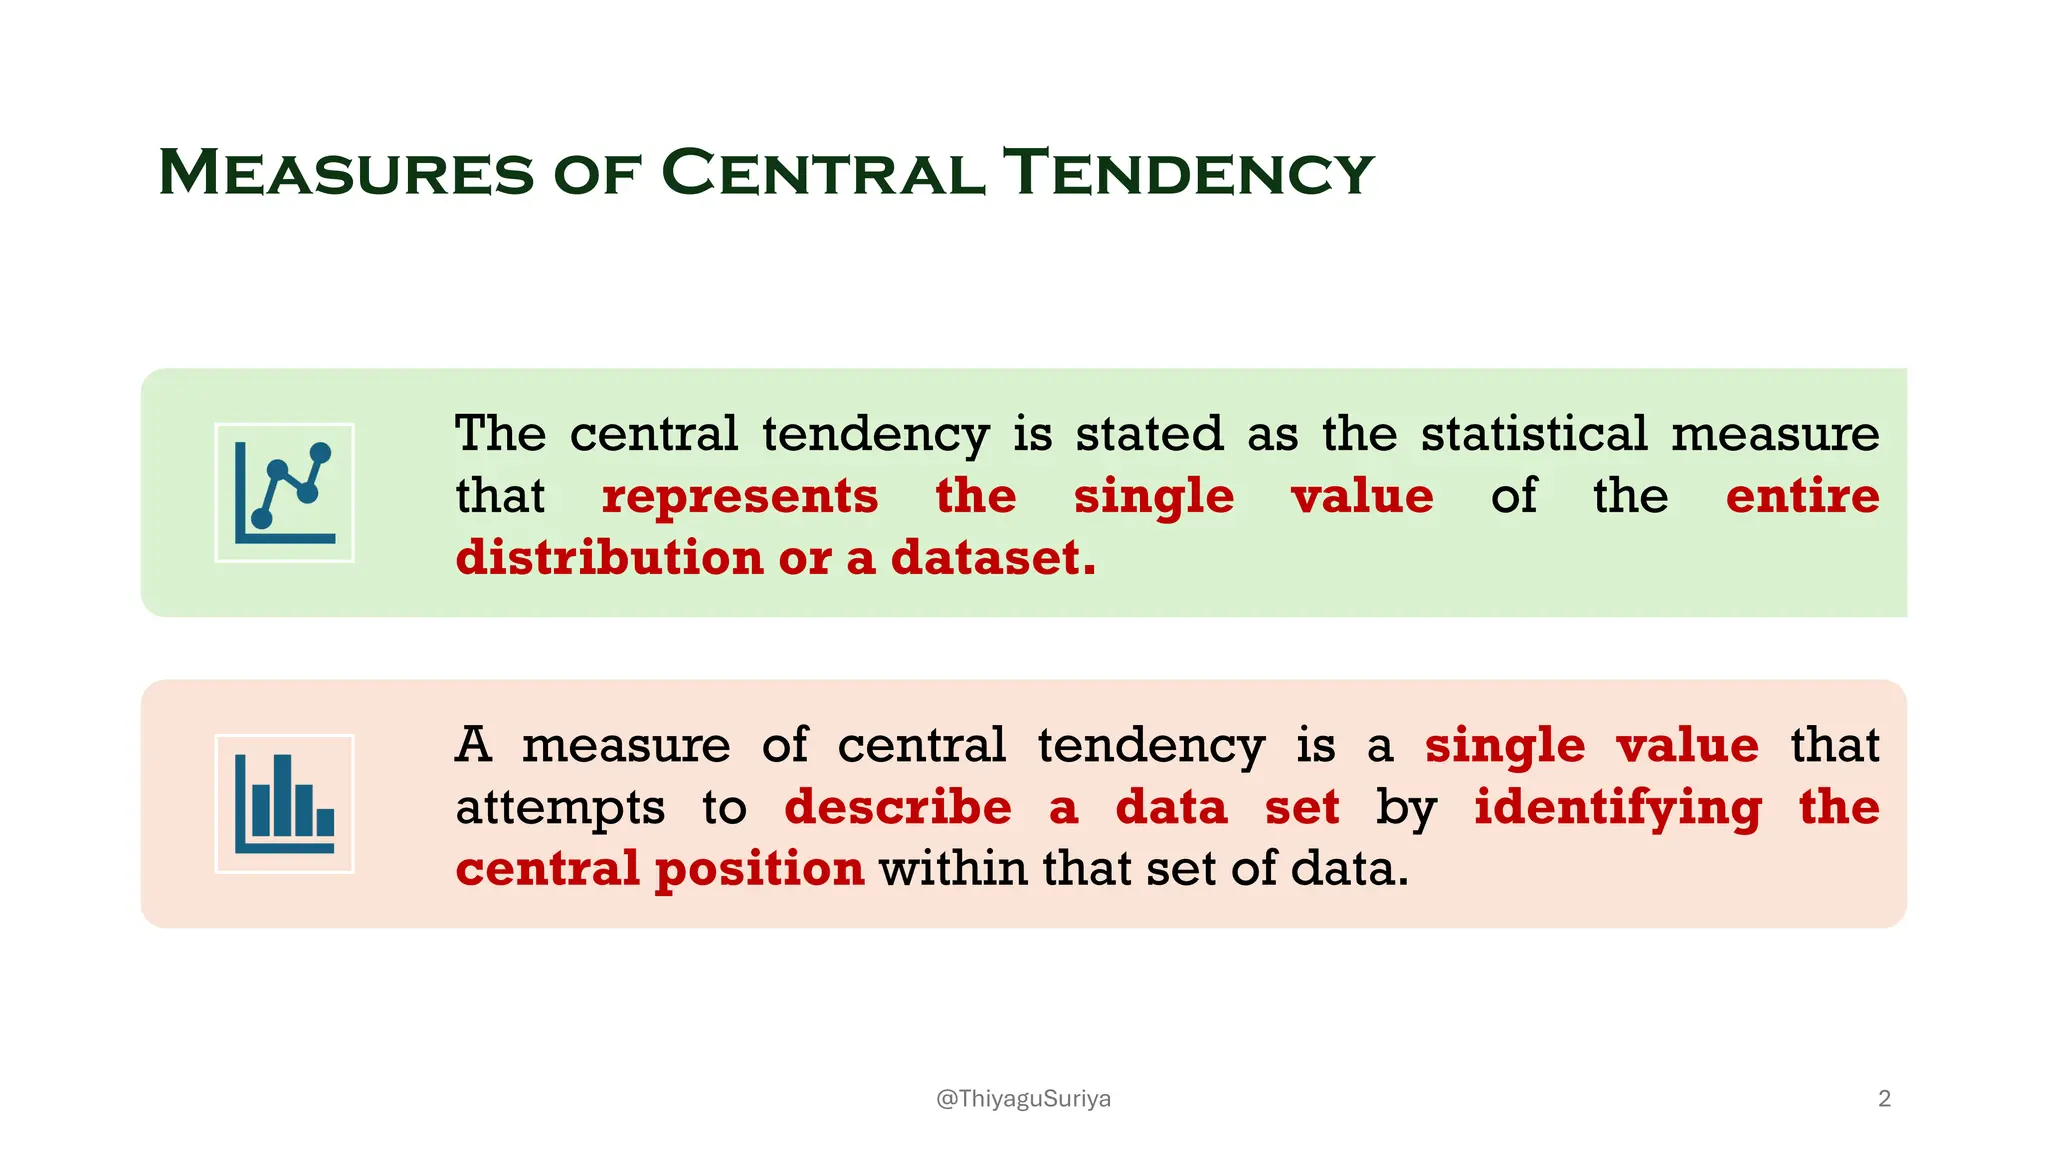
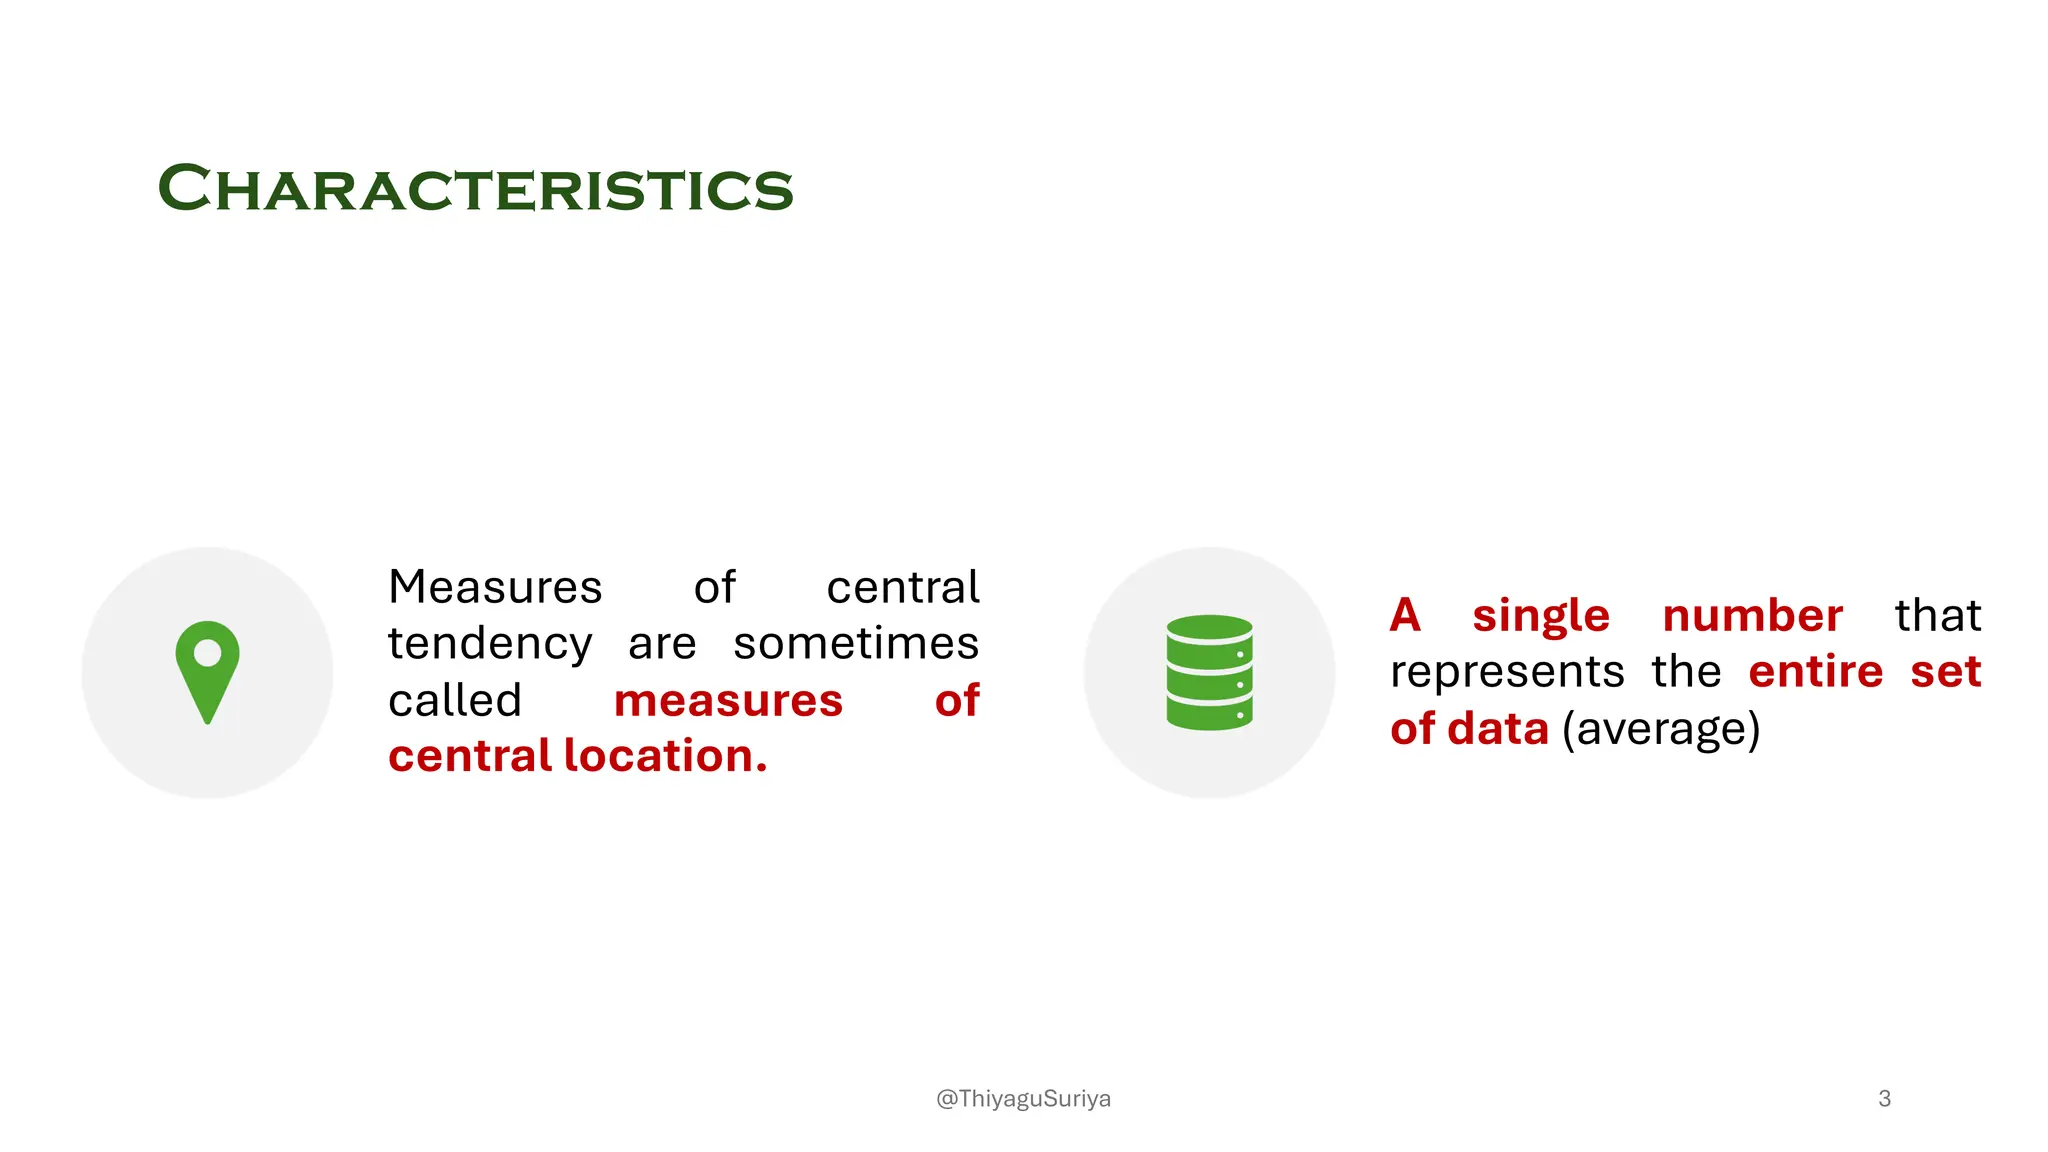
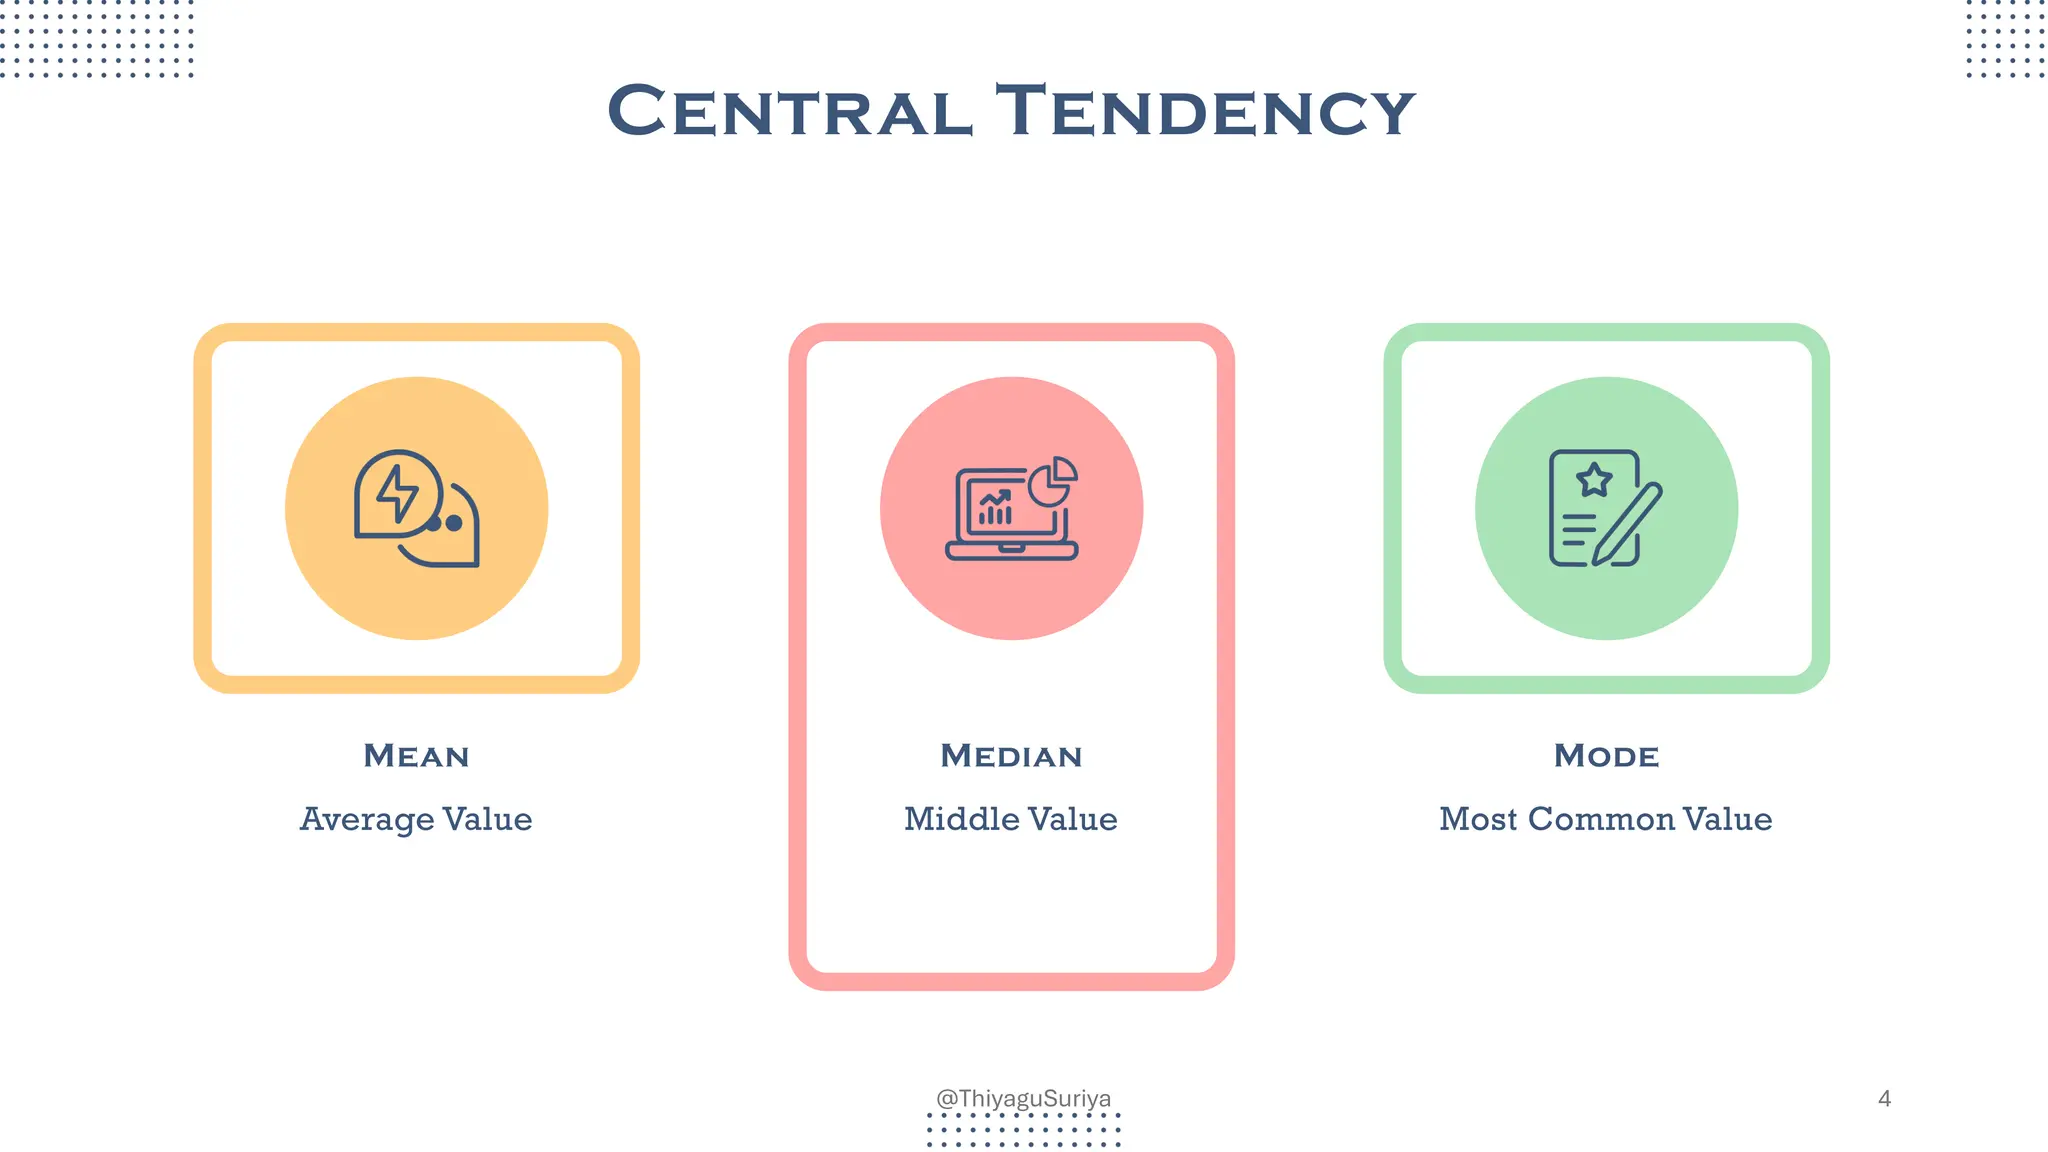
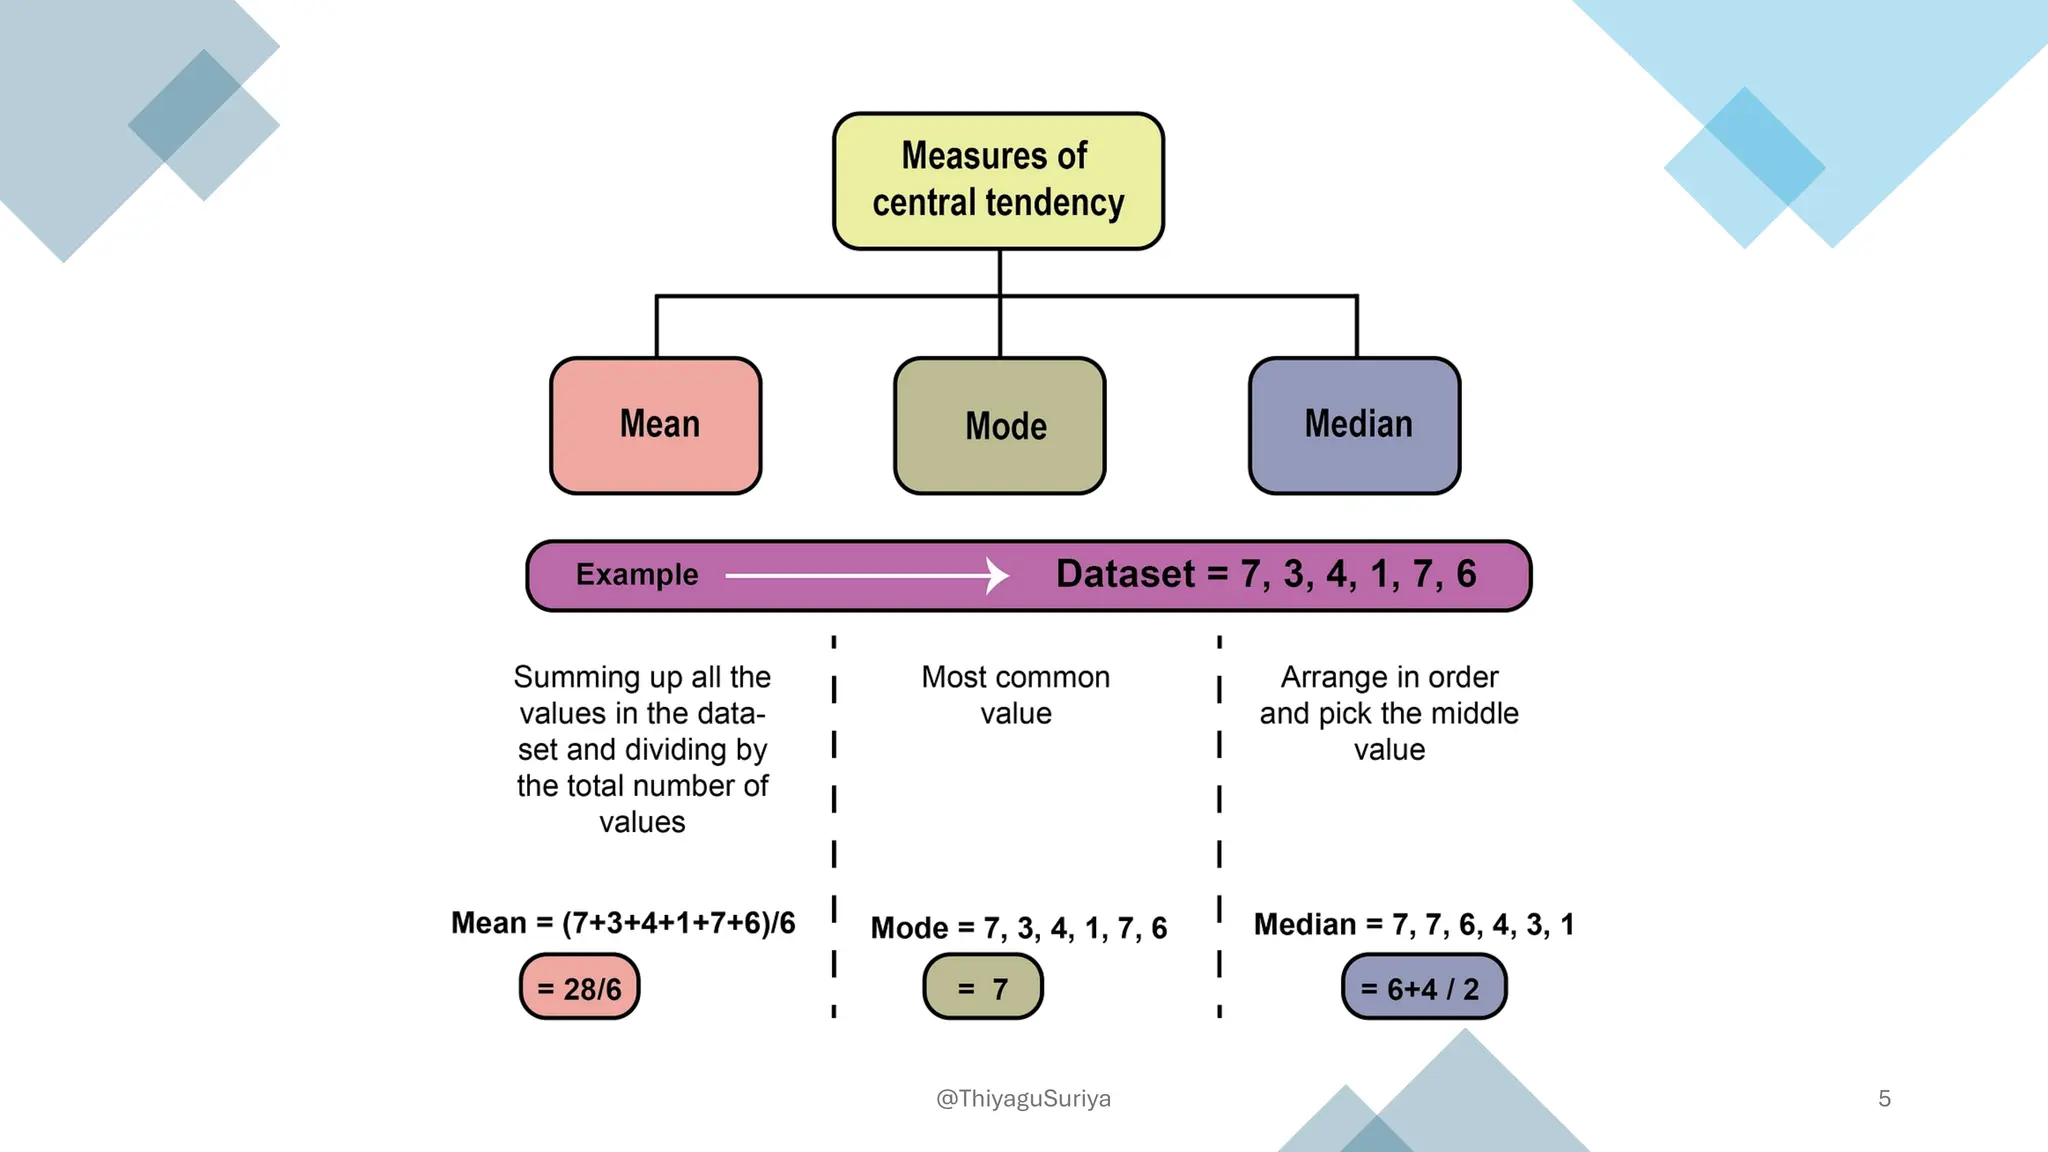
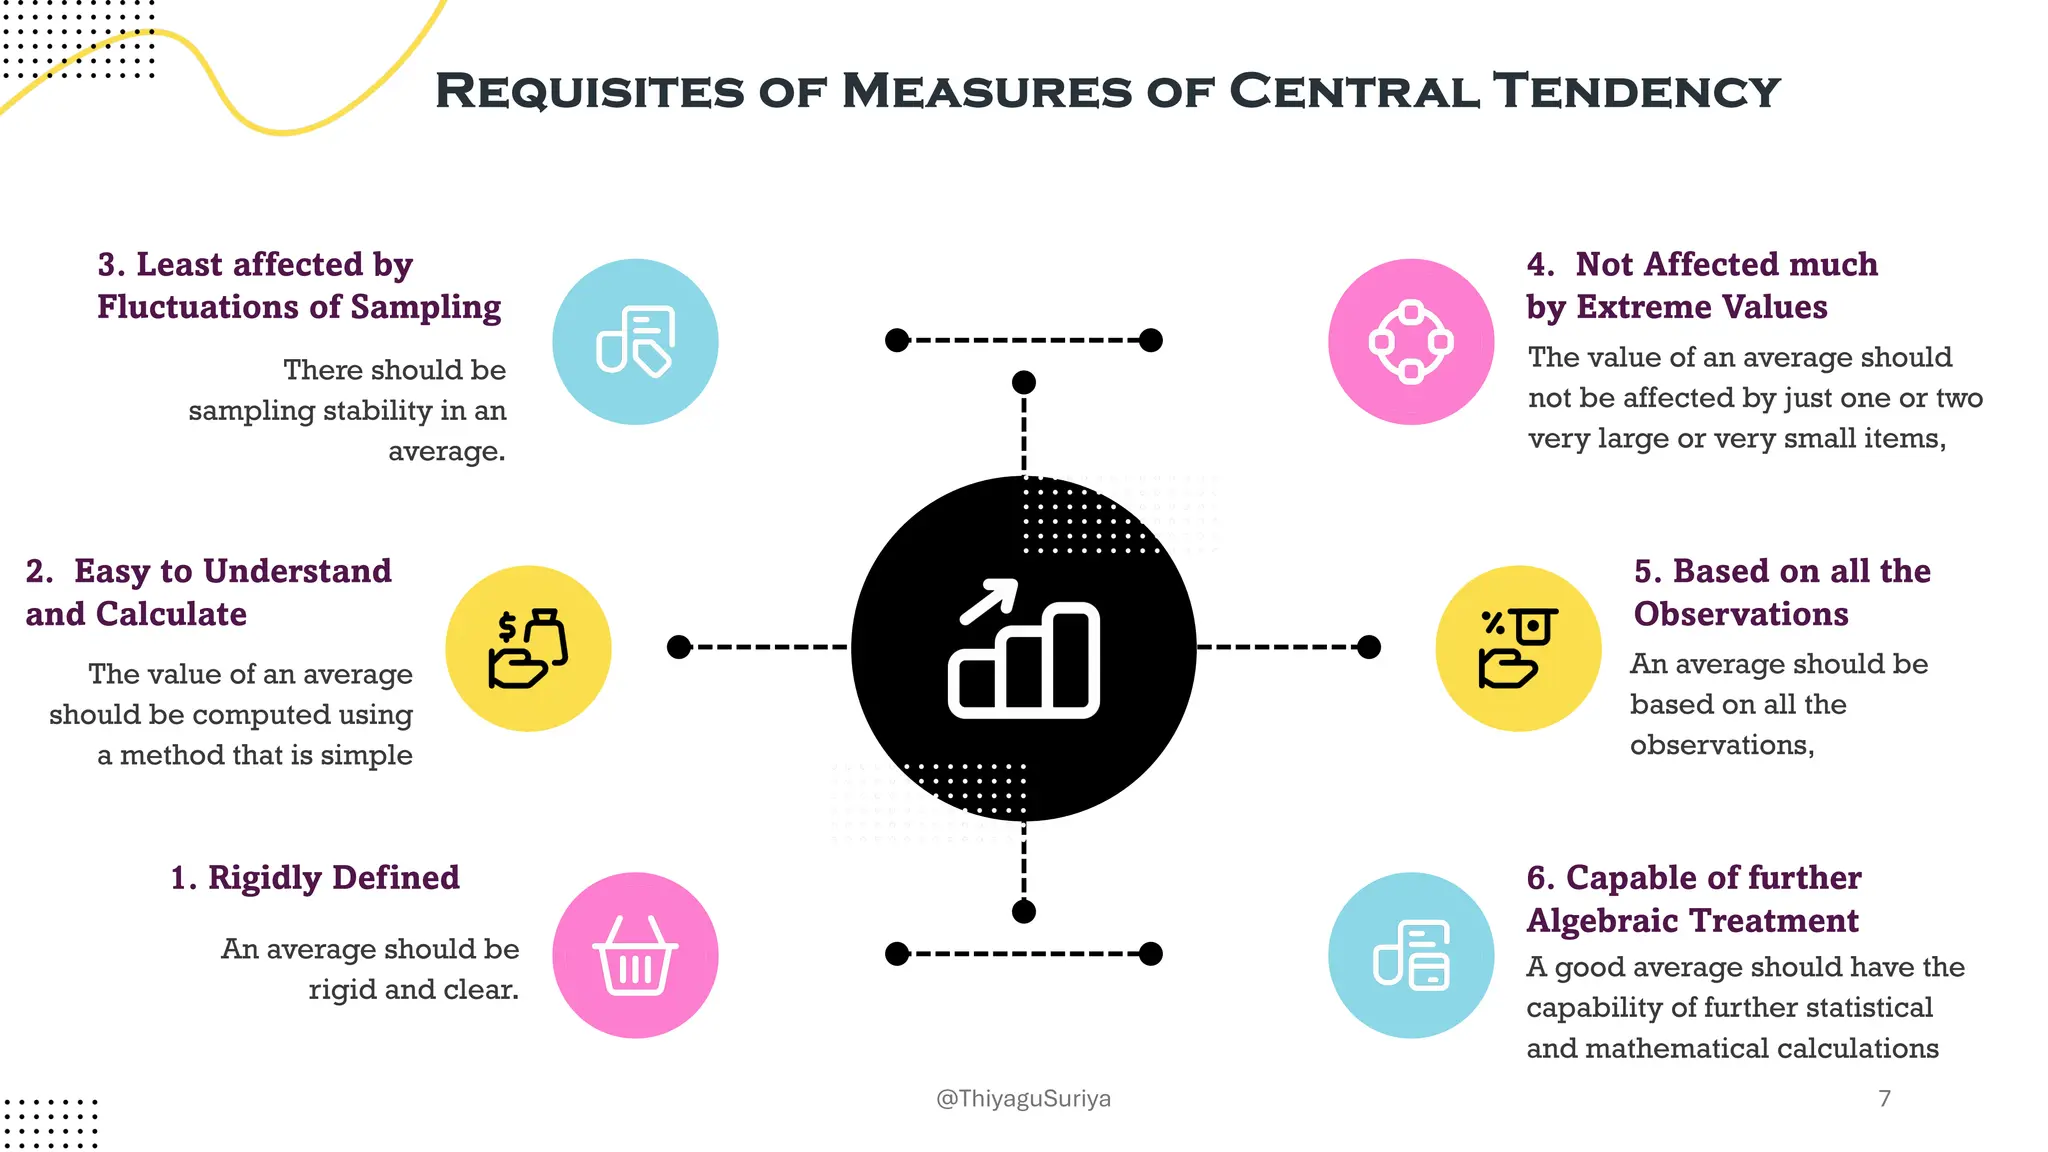
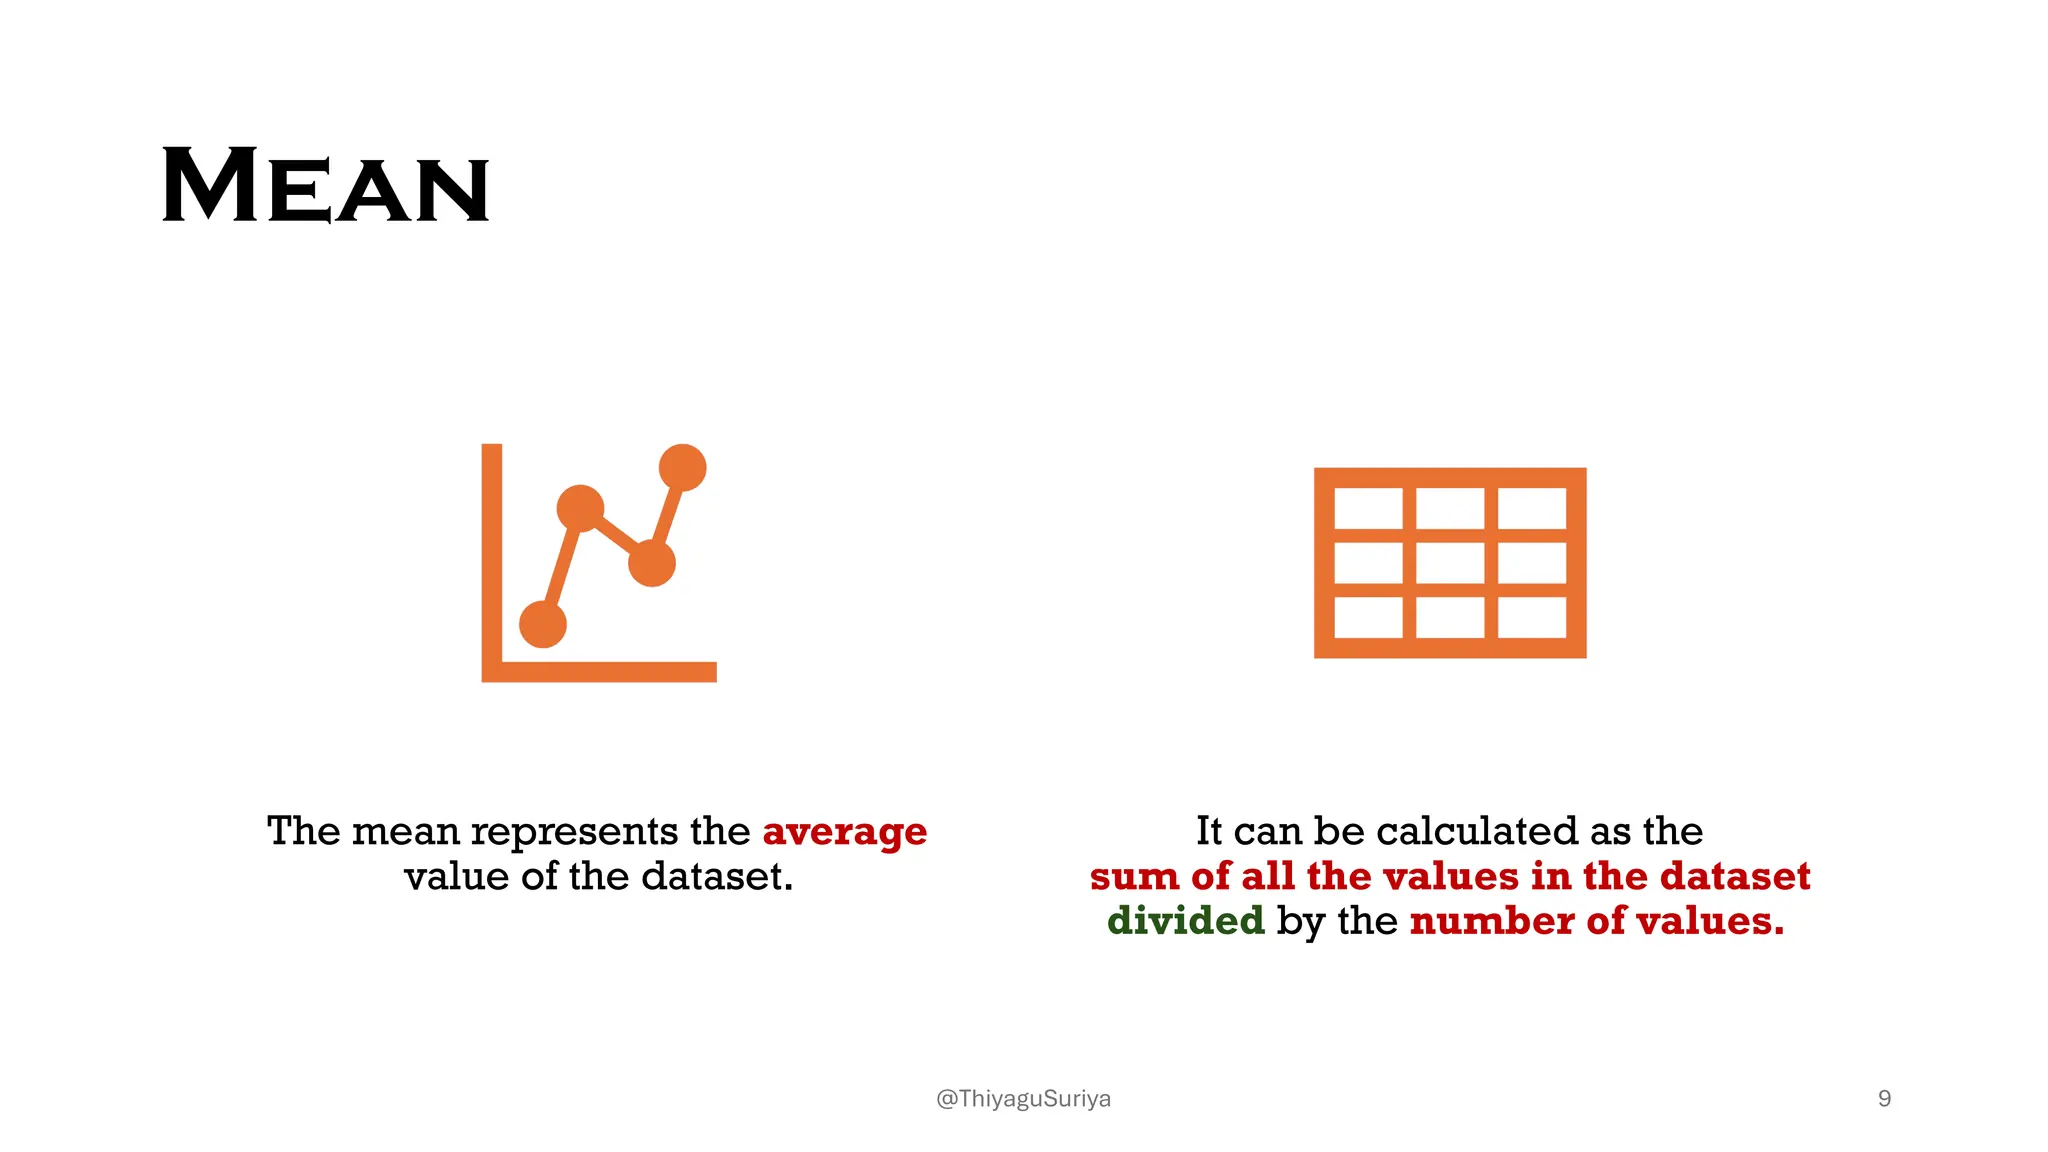
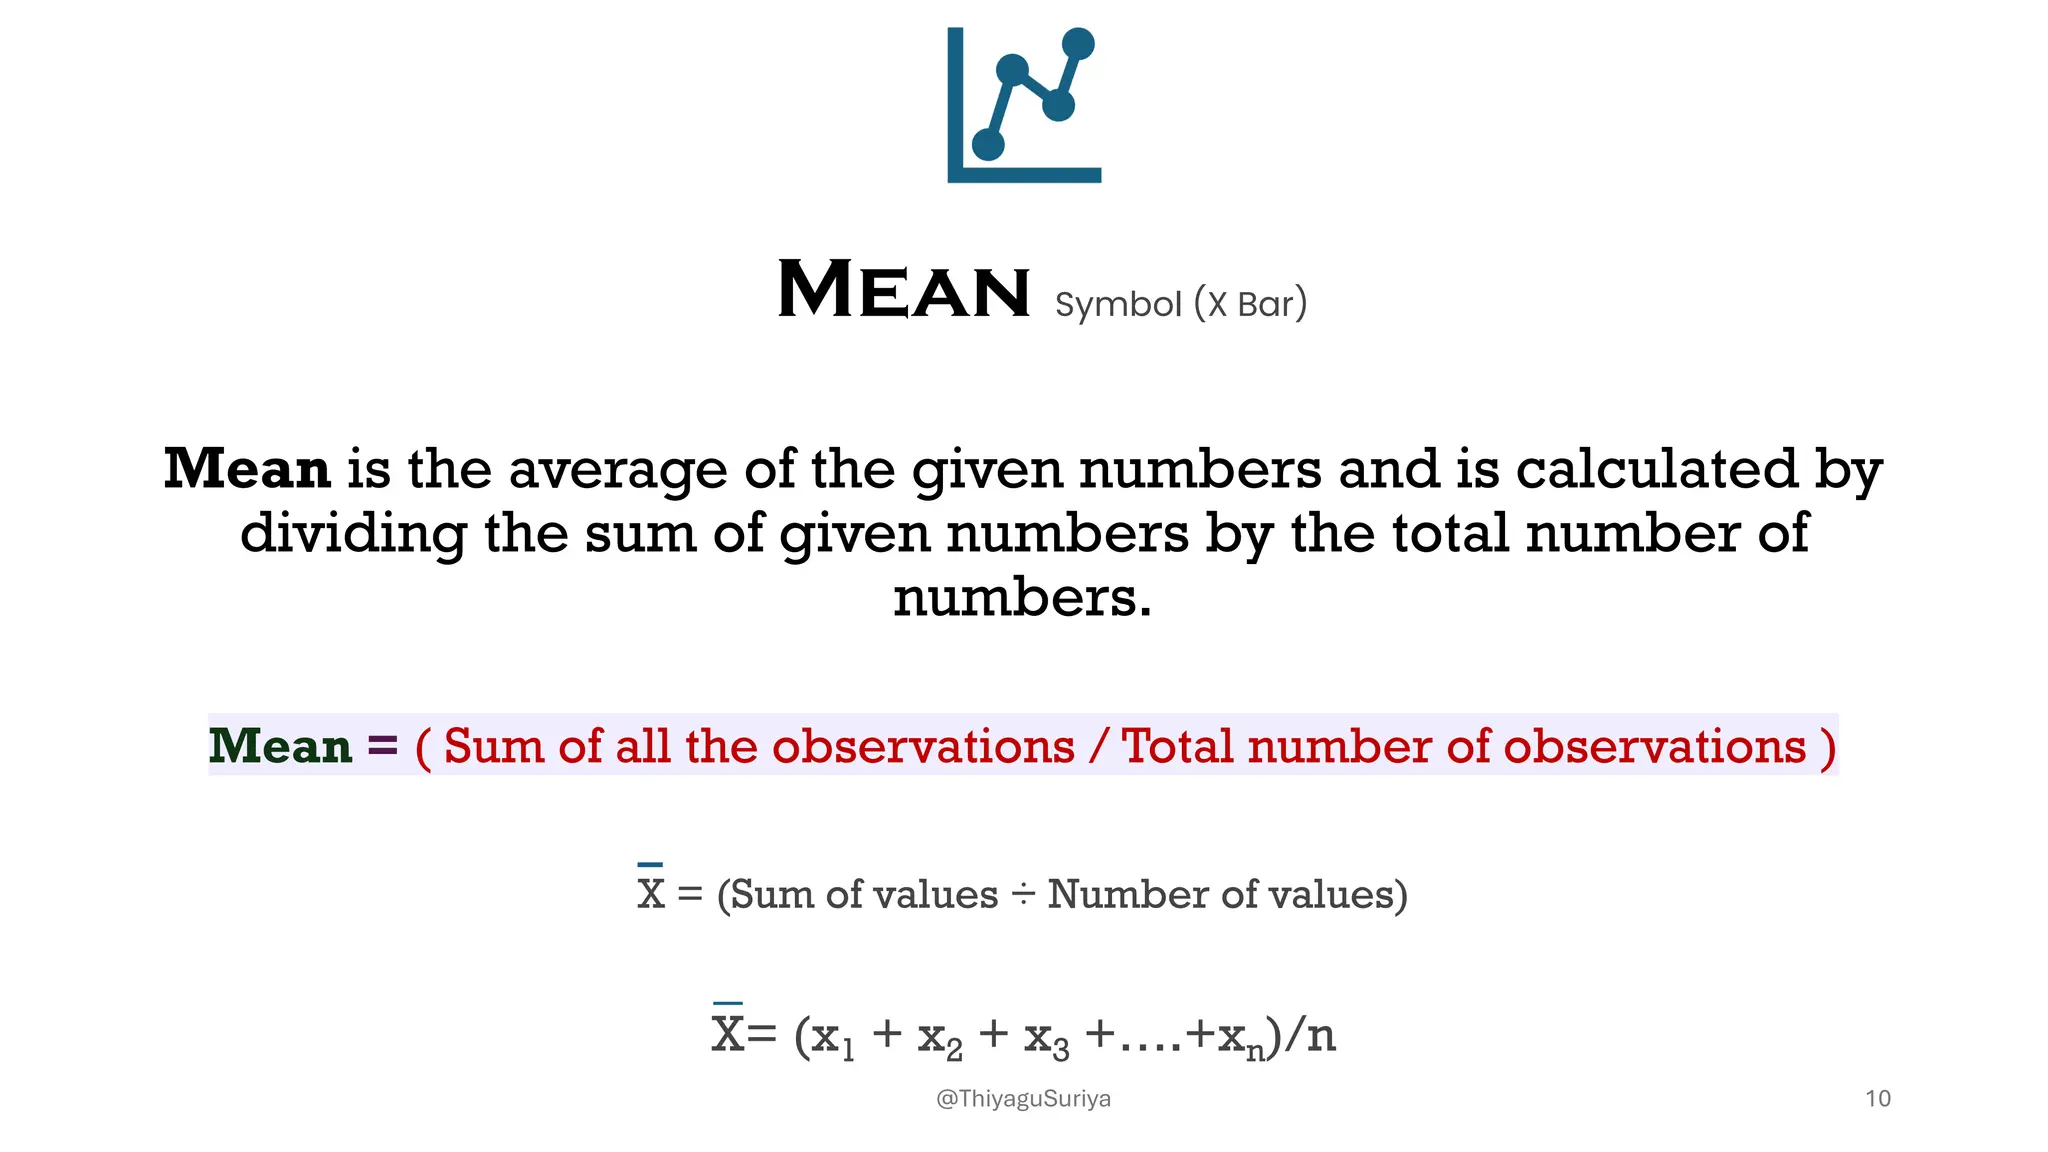
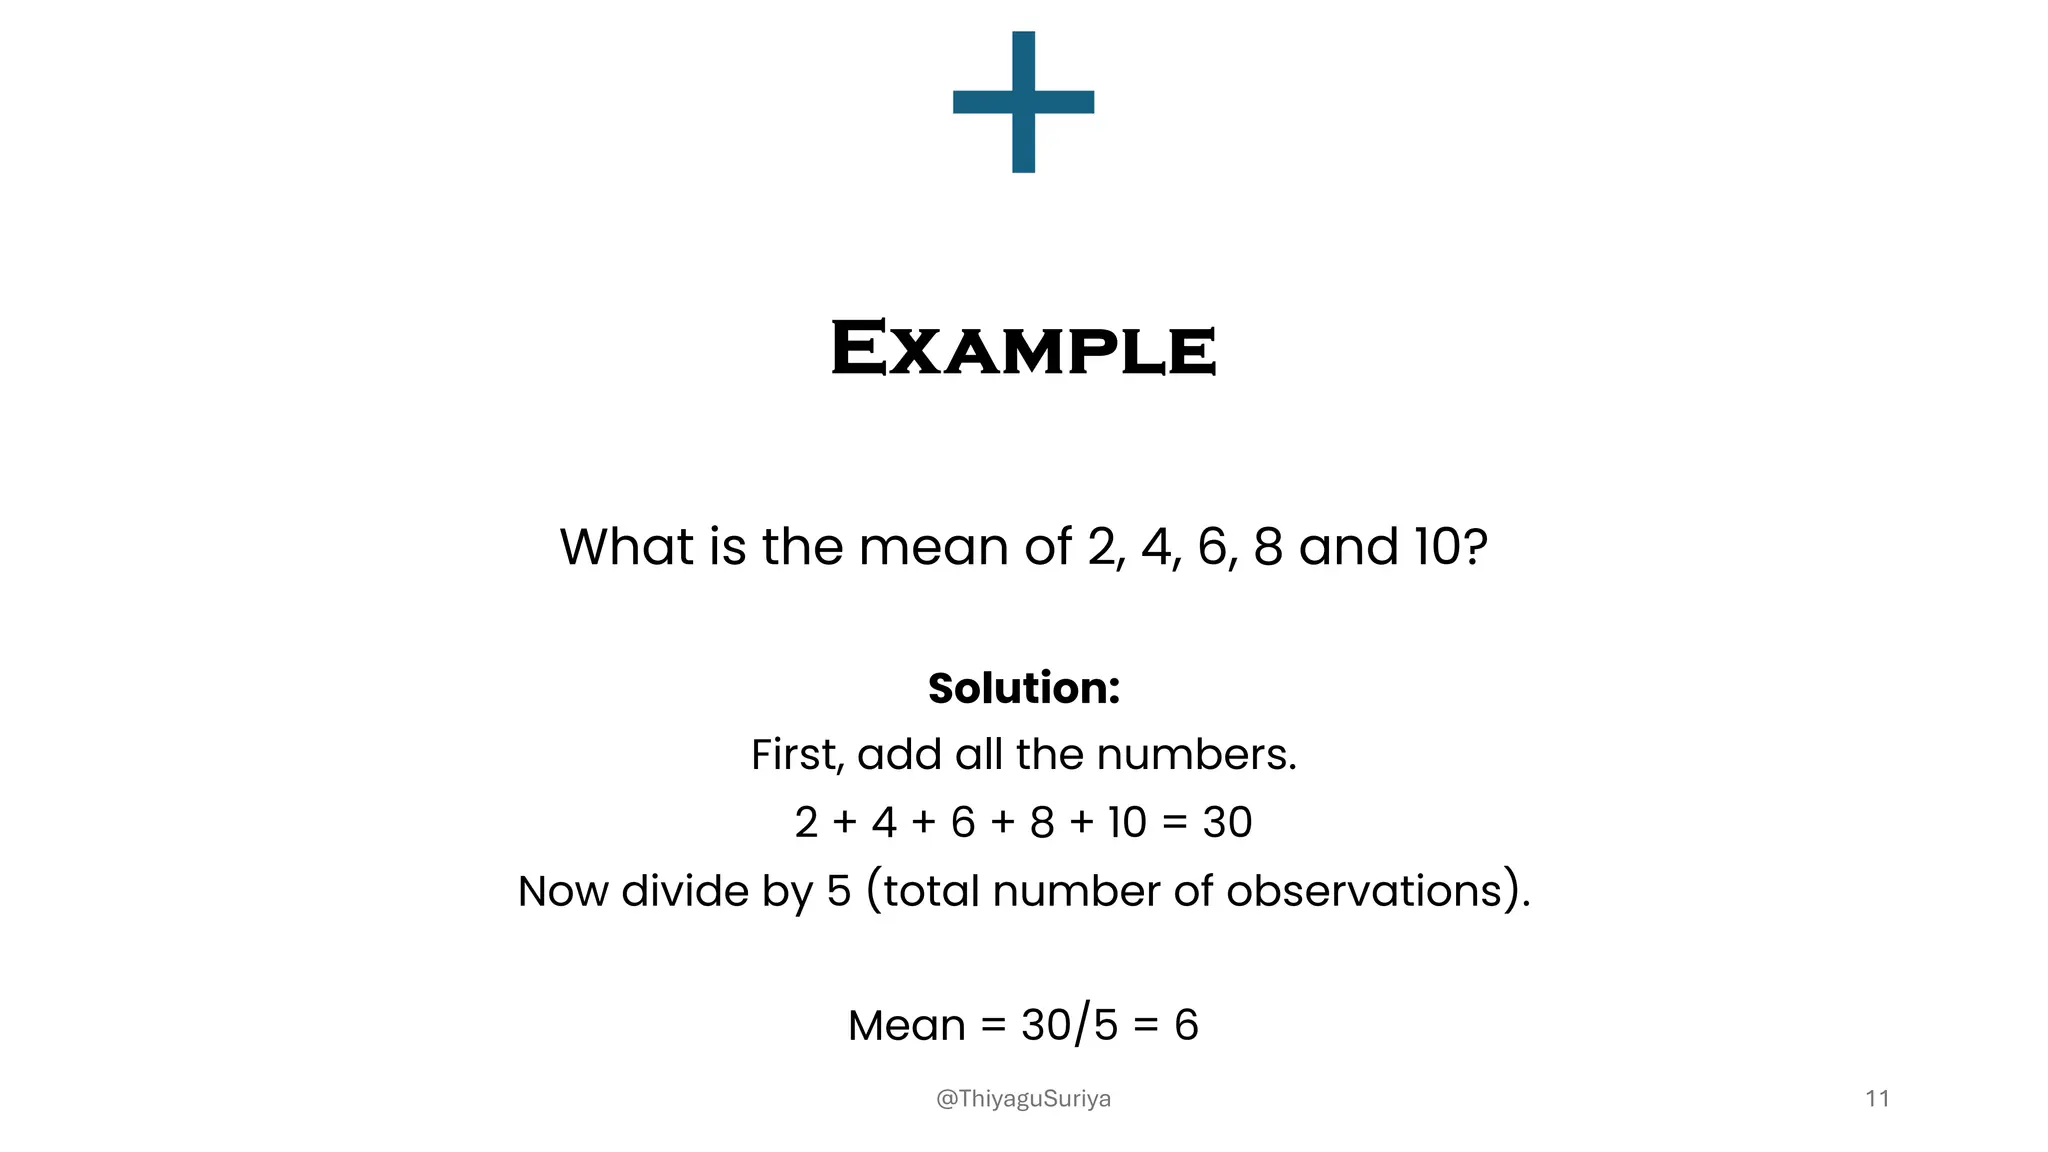
The document discusses measures of central tendency, which summarize a dataset with a single value representing its central position. It outlines the definitions and calculations of the mean, median, and mode, detailing how to derive each measure and providing examples. Additionally, it highlights the merits and demerits of these measures, including their applicability based on data characteristics.