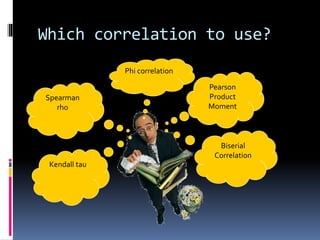
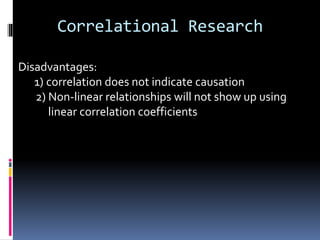
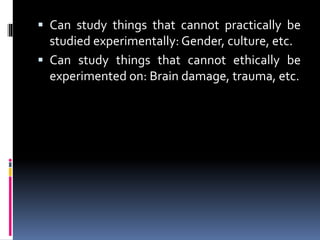
CORRELATIONAL RESEARCH
 A type of descriptive research;
 Widely used in Social Sciences;
 Focus: to study the existing relationships between two or more
variables,
 To discover what is presently unknown but also to predict the
future relationships between various variables.
 Relationship means that an individuals status on one variable
tends to reflect his or her status on the other.
 Helps us understand related events, conditions, and
behaviors.
 Is there a relationship between educational levels of farmers
and crop yields?
 To make predictions of how one variable might predict
another
 Can high school grades be used to predict college grades?
Correlational Research
 To examine the possible existence of
causation
 Does physical exercise cause people to lose
weight?
CAUTION: In correlational research you CAN NOT absolutely say once
variable causes something to happen.This can only be done through
experimental research.You can say one variable might cause something else
to happen.
 X (f) Y i.e. X is the function (f) of Y, and this is
possible only because both are correlated.
 X refers to the behaviour of the pigeon;
 Y refers to the reinforcement given to the pigeon
after it performs some particular behavior (e.g.,
pecking at a tray).
 The pigeon learns to peck at the tray because it
leads to some reward (food).
 One thing caused another: the proper
administration of reinforcement led or caused the
bird to behave in a certain manner.
Terminology
 “Predictor” variable – the variable(s) that are
believed to predict the outcome.
 Could be called an independent variable
Terminology
 “Criterion” variable – the variable to be
predicted, the outcome
 Could be called the dependent variable
Terminology
 Is level of education (predictor variable)
related to family income (criterion variable)?
 Do people who eat more eggs (predictor
variable) have higher cholesterol levels
(criterion variable)?
Where does the data come
from for correlational
research?
 Surveys
 Scores on various tests or rating scales
 Demographic information
Correlational Research
Process
 Variables to be study are identified
 Questions and/or hypotheses are stated
 A sample is selected (a minimum of 30 is needed)
 Data are collected
 Correlations are calculated
 Results are reported
Which correlation to use?
Pearson
Product
Moment
Kendall tau
Biserial
Correlation
Spearman
rho
Phi correlation
 Pearson r : It is the most commonly used
correlational procedure.
 Used when both the criterion and predictor
variable contain continuous interval data such as
test scores, years of experience, money, etc.
 We need pairs of raw scores on two tests, one
pair for each subject of the sample.
Test of science Test of math
 Spearman r :
 Sometimes we cannot obtain raw scores but we
obtain the ranking of the subjects.
 When the both the predictor and criterion
variables are rankings, use either the Spearman
rho correlation.
 For example, to explore the relationship
between using marijuana in schools and
students’ attitudes. Here we may be unable to
obtain the raw scores of the subjects on these
two variables but we may rank them on these.
Using Marijuana Success in school
20 students who are addicted to marijuana
Using Marijuana School Success
20 students who often use marijuana
Using marijuana School Success
20 students who seldom used marijuana
Using marijuana School success
20 students who never used marijuana
Using marijuana School success
20 students who never heard about marijuana
Point Biserial Correlation
 When the predictor variable is a natural (real)
dichotomy (two categories) and the criterion
variable is interval or continuous, the point
biserial correlation is used.
Biserial Correlation:
 When the predictor variable is a natural (real)
dichotomy (two categories) and the criterion
variable is interval or continuous, the point biserial
correlation is used.
 It is calculated when we have scores of the subjects
on one variable or trait, but on the second variable,
we have to put them into a dichotomy
(dichotomous means 'cut into two parts'), which
means that we have to place them in either this or
another category.
PredictorVariable CriterionVariable
Male/ or Female
Good looking/ or ugly
Salary
 When the both the predictor and criterion
variables are natural dichotomies (two
categories), the phi correlation is used.
 If the dichotomies are artificial, the tetrachoric
correlation is used.This is rarely the case in
educational research
 Tetrachoric r / Cross- Leged Panel Correlation
 Sometimes we may get both the variables dichotomous (or a
2 x 2 or four-fold table). Then we have to compute
tetrachoric r.
 Here our both variables are not measured in scores but are
capable of being separated into two categories. For
example, we may wish to discover the relationship between
intelligence (above average/below average) and Lge
proficiency (above average/below average).
 Here we have, as per our research objectives, decided to
study the relationship between two categories of
intelligence and two categories of Lge Profiency.
Phi Correlation
Preference
ViolentTV in the
third grade
Preference
ViolentTV in the
13 grade
Agression in
the third
grade
Agression in
the 13 grade
Partial Correlation :
 In correlational approach, mostly the third variable
problem refrains us from drawing inferences on the
basis of the observed r between two variables.
 According to Christensen (1994), "the third variable
problem refers to the fact that the two variables
may be correlated not because they are causally
related but because some third variable caused
both of them."
 For example, it is found that reading ability and
vocabulary are highly correlated, but, in fact, both
of these variables are strongly affected by
intelligence.
Domestic violence
Agresion in school
Watching violent
TV
Analysis and Interpretation of Data :
 The next step is to treat the data statistically by applying
appropriate correlational technique to compute the correlation
between the two sets of scores.
 Then we interpret our findings in the light of:
 The Size of the Correlation: The degree or size or strength of
the relationship between two variables is expressed by the
coefficient of correlation.
 The Direction of the Correlation: You can find the two
variables correlated in either positive or negative direction.
 Significance Level of Correlation:
 We first compute the standard error (SE) of the correlation
and then multiply this SE by 1.96 or by 2.56 (for .01 level of
significance).
 The obtained correlation is considered significant if it is larger
than the value obtained by the multiplication of SE with
either 1.96 or 2.56.
More Principles to Remember
 A correlation is reported as r such as r=.36.
 In reporting correlations in research reports
you report both the r value and the p
More Principles to Remember
 The statistical probability is reported as p.
 Some researchers report the probability of the
correlation happening by chance was p>.05 (more
than 5 out of 100) or p<.05 (less than 5 out of 100)
Interpretation of the
Strength of Correlations
 .00 - .20 –VeryWeak
 .21 - .40 –Weak
 .41 - .60 – Moderate
 .61 - .80 – Strong
 .81 – 1.00 -Very Strong
Different statisticians may have similar
but slightly different scales
.
Correlations
 Scatter plots are often used to depict
correlations
0
1000
2000
3000
4000
5000
6000
100 150 200 250 300 350 400
Weight
Caloriesperday
This chart shows
a strong positive
correlation
Correlations
 Scatter plots are often used to depict
correlations
0
20
40
60
80
100
120
140
160
100 150 200 250 300 350 400
Weight
MinutesofExerciseperday
This chart shows
a strong negative
correlation
Correlations
 Scatter plots are often used to depict
correlations
0
5
10
15
20
25
30
35
40
45
100 150 200 250 300 350 400
Weight
MilesfromKrispyCreme
This chart shows
virtually no
correlation
How can I calculate
correlations?
 Excel has a statistical function. It calculates
Pearson Product Moment correlations.
 SPSS (a statistical software program for personal
computers used by graduate students) calculates
correlations.
Correlational Research
Disadvantages:
1) correlation does not indicate causation
2) Non-linear relationships will not show up using
linear correlation coefficients
 Can study things that cannot practically be
studied experimentally: Gender, culture, etc.
 Can study things that cannot ethically be
experimented on: Brain damage, trauma, etc.

Correltional research

  • 1.
  • 2.
     A typeof descriptive research;  Widely used in Social Sciences;  Focus: to study the existing relationships between two or more variables,  To discover what is presently unknown but also to predict the future relationships between various variables.  Relationship means that an individuals status on one variable tends to reflect his or her status on the other.  Helps us understand related events, conditions, and behaviors.  Is there a relationship between educational levels of farmers and crop yields?  To make predictions of how one variable might predict another  Can high school grades be used to predict college grades?
  • 3.
    Correlational Research  Toexamine the possible existence of causation  Does physical exercise cause people to lose weight? CAUTION: In correlational research you CAN NOT absolutely say once variable causes something to happen.This can only be done through experimental research.You can say one variable might cause something else to happen.
  • 4.
     X (f)Y i.e. X is the function (f) of Y, and this is possible only because both are correlated.  X refers to the behaviour of the pigeon;  Y refers to the reinforcement given to the pigeon after it performs some particular behavior (e.g., pecking at a tray).  The pigeon learns to peck at the tray because it leads to some reward (food).  One thing caused another: the proper administration of reinforcement led or caused the bird to behave in a certain manner.
  • 6.
    Terminology  “Predictor” variable– the variable(s) that are believed to predict the outcome.  Could be called an independent variable
  • 7.
    Terminology  “Criterion” variable– the variable to be predicted, the outcome  Could be called the dependent variable
  • 8.
    Terminology  Is levelof education (predictor variable) related to family income (criterion variable)?  Do people who eat more eggs (predictor variable) have higher cholesterol levels (criterion variable)?
  • 9.
    Where does thedata come from for correlational research?  Surveys  Scores on various tests or rating scales  Demographic information
  • 10.
    Correlational Research Process  Variablesto be study are identified  Questions and/or hypotheses are stated  A sample is selected (a minimum of 30 is needed)  Data are collected  Correlations are calculated  Results are reported
  • 11.
    Which correlation touse? Pearson Product Moment Kendall tau Biserial Correlation Spearman rho Phi correlation
  • 12.
     Pearson r: It is the most commonly used correlational procedure.  Used when both the criterion and predictor variable contain continuous interval data such as test scores, years of experience, money, etc.  We need pairs of raw scores on two tests, one pair for each subject of the sample. Test of science Test of math
  • 13.
     Spearman r:  Sometimes we cannot obtain raw scores but we obtain the ranking of the subjects.  When the both the predictor and criterion variables are rankings, use either the Spearman rho correlation.  For example, to explore the relationship between using marijuana in schools and students’ attitudes. Here we may be unable to obtain the raw scores of the subjects on these two variables but we may rank them on these.
  • 14.
    Using Marijuana Successin school 20 students who are addicted to marijuana
  • 15.
    Using Marijuana SchoolSuccess 20 students who often use marijuana
  • 16.
    Using marijuana SchoolSuccess 20 students who seldom used marijuana
  • 17.
    Using marijuana Schoolsuccess 20 students who never used marijuana
  • 18.
    Using marijuana Schoolsuccess 20 students who never heard about marijuana
  • 19.
    Point Biserial Correlation When the predictor variable is a natural (real) dichotomy (two categories) and the criterion variable is interval or continuous, the point biserial correlation is used.
  • 20.
    Biserial Correlation:  Whenthe predictor variable is a natural (real) dichotomy (two categories) and the criterion variable is interval or continuous, the point biserial correlation is used.  It is calculated when we have scores of the subjects on one variable or trait, but on the second variable, we have to put them into a dichotomy (dichotomous means 'cut into two parts'), which means that we have to place them in either this or another category.
  • 21.
    PredictorVariable CriterionVariable Male/ orFemale Good looking/ or ugly Salary
  • 22.
     When theboth the predictor and criterion variables are natural dichotomies (two categories), the phi correlation is used.  If the dichotomies are artificial, the tetrachoric correlation is used.This is rarely the case in educational research
  • 23.
     Tetrachoric r/ Cross- Leged Panel Correlation  Sometimes we may get both the variables dichotomous (or a 2 x 2 or four-fold table). Then we have to compute tetrachoric r.  Here our both variables are not measured in scores but are capable of being separated into two categories. For example, we may wish to discover the relationship between intelligence (above average/below average) and Lge proficiency (above average/below average).  Here we have, as per our research objectives, decided to study the relationship between two categories of intelligence and two categories of Lge Profiency. Phi Correlation
  • 24.
    Preference ViolentTV in the thirdgrade Preference ViolentTV in the 13 grade Agression in the third grade Agression in the 13 grade
  • 25.
    Partial Correlation : In correlational approach, mostly the third variable problem refrains us from drawing inferences on the basis of the observed r between two variables.  According to Christensen (1994), "the third variable problem refers to the fact that the two variables may be correlated not because they are causally related but because some third variable caused both of them."  For example, it is found that reading ability and vocabulary are highly correlated, but, in fact, both of these variables are strongly affected by intelligence.
  • 26.
    Domestic violence Agresion inschool Watching violent TV
  • 27.
    Analysis and Interpretationof Data :  The next step is to treat the data statistically by applying appropriate correlational technique to compute the correlation between the two sets of scores.  Then we interpret our findings in the light of:  The Size of the Correlation: The degree or size or strength of the relationship between two variables is expressed by the coefficient of correlation.  The Direction of the Correlation: You can find the two variables correlated in either positive or negative direction.  Significance Level of Correlation:  We first compute the standard error (SE) of the correlation and then multiply this SE by 1.96 or by 2.56 (for .01 level of significance).  The obtained correlation is considered significant if it is larger than the value obtained by the multiplication of SE with either 1.96 or 2.56.
  • 28.
    More Principles toRemember  A correlation is reported as r such as r=.36.  In reporting correlations in research reports you report both the r value and the p
  • 29.
    More Principles toRemember  The statistical probability is reported as p.  Some researchers report the probability of the correlation happening by chance was p>.05 (more than 5 out of 100) or p<.05 (less than 5 out of 100)
  • 30.
    Interpretation of the Strengthof Correlations  .00 - .20 –VeryWeak  .21 - .40 –Weak  .41 - .60 – Moderate  .61 - .80 – Strong  .81 – 1.00 -Very Strong Different statisticians may have similar but slightly different scales .
  • 31.
    Correlations  Scatter plotsare often used to depict correlations 0 1000 2000 3000 4000 5000 6000 100 150 200 250 300 350 400 Weight Caloriesperday This chart shows a strong positive correlation
  • 32.
    Correlations  Scatter plotsare often used to depict correlations 0 20 40 60 80 100 120 140 160 100 150 200 250 300 350 400 Weight MinutesofExerciseperday This chart shows a strong negative correlation
  • 33.
    Correlations  Scatter plotsare often used to depict correlations 0 5 10 15 20 25 30 35 40 45 100 150 200 250 300 350 400 Weight MilesfromKrispyCreme This chart shows virtually no correlation
  • 34.
    How can Icalculate correlations?  Excel has a statistical function. It calculates Pearson Product Moment correlations.  SPSS (a statistical software program for personal computers used by graduate students) calculates correlations.
  • 35.
    Correlational Research Disadvantages: 1) correlationdoes not indicate causation 2) Non-linear relationships will not show up using linear correlation coefficients
  • 36.
     Can studythings that cannot practically be studied experimentally: Gender, culture, etc.  Can study things that cannot ethically be experimented on: Brain damage, trauma, etc.