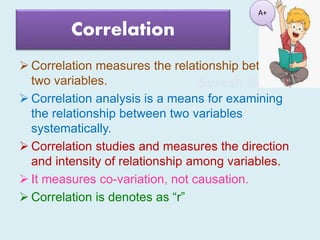
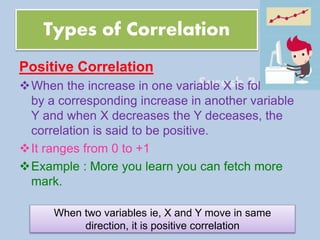
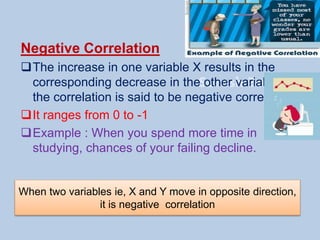
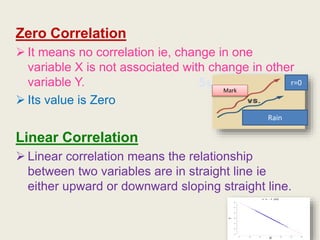
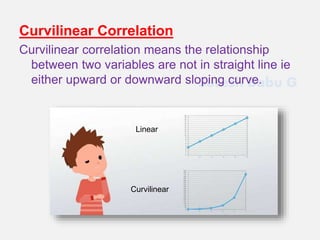
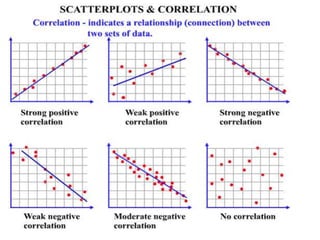
Suresh Babu G
Correlation Analysis
Suresh Babu G
Assistant Professor
CTE CPAS Paippad, Kottayam
If you study well you
can score more mark
Suresh Babu G
Correlation
 Correlation measures the relationship between
two variables.
 Correlation analysis is a means for examining
the relationship between two variables
systematically.
 Correlation studies and measures the direction
and intensity of relationship among variables.
 It measures co-variation, not causation.
 Correlation is denotes as “r”
A+
Suresh Babu G
Types of Correlation
Positive Correlation
When the increase in one variable X is followed
by a corresponding increase in another variable
Y and when X decreases the Y deceases, the
correlation is said to be positive.
It ranges from 0 to +1
Example : More you learn you can fetch more
mark.
When two variables ie, X and Y move in same
direction, it is positive correlation
Suresh Babu G
Negative Correlation
The increase in one variable X results in the
corresponding decrease in the other variable Y,
the correlation is said to be negative correlation.
It ranges from 0 to -1
Example : When you spend more time in
studying, chances of your failing decline.
When two variables ie, X and Y move in opposite direction,
it is negative correlation
Suresh Babu G
Zero Correlation
 It means no correlation ie, change in one
variable X is not associated with change in other
variable Y.
 Its value is Zero
Linear Correlation
 Linear correlation means the relationship
between two variables are in straight line ie
either upward or downward sloping straight line.
Mark
Rain
r=0
Suresh Babu G
Curvilinear Correlation
Curvilinear correlation means the relationship
between two variables are not in straight line ie
either upward or downward sloping curve.
Linear
Curvilinear
Suresh Babu G
Suresh Babu G
Suresh Babu G
Properties of Coefficient of
Correlation
• r has no units.
• A negative value of r indicates an
inverse relation.
• If r is positive the two variables
move in the same direction.
• The value of the correlation
coefficient lies between minus one
and plus one ( -1 ≤ r ≥ +1 )
• If r=0 the two variables are
uncorrelated.
Suresh Babu G
• If r = +1 or r = -1 the correlation is prefect.
• If the value is said to be high, when it is close to
+1 or -1.
• If the value is sais to be low, when it is close to
zero.
• The value of r is unaffected by the change of
origin and change of scale.
Properties of Coefficient of Correlation
It is important
learn it
Suresh Babu G
Karl Person’s Coefficient of
Correlation
It is also known as Product Moment
Correlation and Simple Correlation
Coefficient.
It gives a precise numerical value of the degree
of linear relationship between two variables X
and Y.
  
  

)2(2)2(2
))((
YYNXXN
YXXYN
r
Suresh Babu G
Example
 Calculate the Correlation Coefficient of the
following data.
No. of years of
schooling
Annual yield in
thousand
0 4
2 4
4 6
6 10
8 10
10 8
12 7
Suresh Babu G
X Y XY X2 Y2
0 4 0 0 16
2 4 8 4 16
4 6 24 16 36
6 10 60 36 100
8 10 80 64 100
10 8 80 100 64
12 7 84 144 49
ΣX = 42 ΣY = 49 ΣXY = 336 ΣX2 = 364 ΣY2 = 381
  
  

)2(2)2(2
))((
YYNXXN
YXXYN
r
Suresh Babu G
49238174223647
49423367

r
2401266717642548
20582352

r
266784
294r
644.0
4.456
294
3.1628
294 

r
r = 0.644
Positive Correlation
Suresh Babu G
Spearman’s Rank Correlation
 Spearman’s rank correlation was developed by
British psychologist C.E.Spearman.
 It is used when the variables cannot be
measured meaningfully ie, attributes.
 It is the Product Movement Correlation
between ranks.
nn
D
rs


3
26
1
Where
D = R1 –R2
R1 = Rank 1
R2 = Rank 2
n = Number of
pairs
Suresh Babu G
Case 1 : When Rank is Given
Example 1
• Rank given by two judges A and B of arts fest
are given. Find rank correlation.
Competitors
Judge 1 2 3 4 5
A 1 2 3 4 5
B 2 4 1 5 3
Suresh Babu G
A B D = R1 – R2 D2
1 2 -1 1
2 4 -2 4
3 1 2 4
4 5 -1 1
5 3 2 2
ΣD2 = 14
3.07.01
120
841
535
1461



rs
nn
D
rs


3
26
1
rs = 0.3
Low positive correlation
Suresh Babu G
Case 2 : When the rank are not given
Example 2
• Percentage of marks of 5 students in psychology
and Technology is given find rank correlation
Student Marks in
Psychology
Marks in
Technology
A 85 60
B 60 48
C 55 49
D 65 50
E 75 55
Suresh Babu G
Student x y R1 R2 D = R1 – R2 D2
A 85 60 1 1 0 0
B 60 48 4 5 -1 1
C 55 49 5 4 1 1
D 65 50 3 3 0 0
E 75 55 2 2 0 0
ΣD2 = 2
nn
D
rs


3
26
1
9.01.01
120
121
535
261



rs
rs = 0.9
Strong correlation
Suresh Babu G
Case 3 : When the ranks are repeated
Example 3
• The value of X and Y are given as
n3n
....
12
)2m3
2(m
12
)1m3
1(m2D6
1rs

 









X 25 45 35 40 15 19 35 42
Y 55 60 30 35 40 42 36 48
Where m1, m2, …. Are the
number of repetitions of ranks
Suresh Babu G
X Y R1 R2 D = R1 – R2 D2
25 55 6 2 4 16
45 60 1 1 0 0
35 30 4.5 8 3.5 12.25
40 35 3 7 -4 16
15 40 8 5 3 9
19 42 7 4 3 9
35 36 4.5 6 -1.5 2.25
42 48 2 3 -1 1
ΣD2 = 65.5
n3n
12
)1m3
1(m2D6
1rs









Suresh Babu G
35 occurs 2 times
so m1 = 2
883
12
232
5.656
1rs
















214.0786.01
504
396
1
504
5.05.656
1rs



 



rs = 0.214
Low positive correlation
Suresh Babu G

Correlation Analysis

  • 1.
    Suresh Babu G CorrelationAnalysis Suresh Babu G Assistant Professor CTE CPAS Paippad, Kottayam If you study well you can score more mark
  • 2.
    Suresh Babu G Correlation Correlation measures the relationship between two variables.  Correlation analysis is a means for examining the relationship between two variables systematically.  Correlation studies and measures the direction and intensity of relationship among variables.  It measures co-variation, not causation.  Correlation is denotes as “r” A+
  • 3.
    Suresh Babu G Typesof Correlation Positive Correlation When the increase in one variable X is followed by a corresponding increase in another variable Y and when X decreases the Y deceases, the correlation is said to be positive. It ranges from 0 to +1 Example : More you learn you can fetch more mark. When two variables ie, X and Y move in same direction, it is positive correlation
  • 4.
    Suresh Babu G NegativeCorrelation The increase in one variable X results in the corresponding decrease in the other variable Y, the correlation is said to be negative correlation. It ranges from 0 to -1 Example : When you spend more time in studying, chances of your failing decline. When two variables ie, X and Y move in opposite direction, it is negative correlation
  • 5.
    Suresh Babu G ZeroCorrelation  It means no correlation ie, change in one variable X is not associated with change in other variable Y.  Its value is Zero Linear Correlation  Linear correlation means the relationship between two variables are in straight line ie either upward or downward sloping straight line. Mark Rain r=0
  • 6.
    Suresh Babu G CurvilinearCorrelation Curvilinear correlation means the relationship between two variables are not in straight line ie either upward or downward sloping curve. Linear Curvilinear
  • 7.
  • 8.
  • 9.
    Suresh Babu G Propertiesof Coefficient of Correlation • r has no units. • A negative value of r indicates an inverse relation. • If r is positive the two variables move in the same direction. • The value of the correlation coefficient lies between minus one and plus one ( -1 ≤ r ≥ +1 ) • If r=0 the two variables are uncorrelated.
  • 10.
    Suresh Babu G •If r = +1 or r = -1 the correlation is prefect. • If the value is said to be high, when it is close to +1 or -1. • If the value is sais to be low, when it is close to zero. • The value of r is unaffected by the change of origin and change of scale. Properties of Coefficient of Correlation It is important learn it
  • 11.
    Suresh Babu G KarlPerson’s Coefficient of Correlation It is also known as Product Moment Correlation and Simple Correlation Coefficient. It gives a precise numerical value of the degree of linear relationship between two variables X and Y.        )2(2)2(2 ))(( YYNXXN YXXYN r
  • 12.
    Suresh Babu G Example Calculate the Correlation Coefficient of the following data. No. of years of schooling Annual yield in thousand 0 4 2 4 4 6 6 10 8 10 10 8 12 7
  • 13.
    Suresh Babu G XY XY X2 Y2 0 4 0 0 16 2 4 8 4 16 4 6 24 16 36 6 10 60 36 100 8 10 80 64 100 10 8 80 100 64 12 7 84 144 49 ΣX = 42 ΣY = 49 ΣXY = 336 ΣX2 = 364 ΣY2 = 381        )2(2)2(2 ))(( YYNXXN YXXYN r
  • 14.
  • 15.
    Suresh Babu G Spearman’sRank Correlation  Spearman’s rank correlation was developed by British psychologist C.E.Spearman.  It is used when the variables cannot be measured meaningfully ie, attributes.  It is the Product Movement Correlation between ranks. nn D rs   3 26 1 Where D = R1 –R2 R1 = Rank 1 R2 = Rank 2 n = Number of pairs
  • 16.
    Suresh Babu G Case1 : When Rank is Given Example 1 • Rank given by two judges A and B of arts fest are given. Find rank correlation. Competitors Judge 1 2 3 4 5 A 1 2 3 4 5 B 2 4 1 5 3
  • 17.
    Suresh Babu G AB D = R1 – R2 D2 1 2 -1 1 2 4 -2 4 3 1 2 4 4 5 -1 1 5 3 2 2 ΣD2 = 14 3.07.01 120 841 535 1461    rs nn D rs   3 26 1 rs = 0.3 Low positive correlation
  • 18.
    Suresh Babu G Case2 : When the rank are not given Example 2 • Percentage of marks of 5 students in psychology and Technology is given find rank correlation Student Marks in Psychology Marks in Technology A 85 60 B 60 48 C 55 49 D 65 50 E 75 55
  • 19.
    Suresh Babu G Studentx y R1 R2 D = R1 – R2 D2 A 85 60 1 1 0 0 B 60 48 4 5 -1 1 C 55 49 5 4 1 1 D 65 50 3 3 0 0 E 75 55 2 2 0 0 ΣD2 = 2 nn D rs   3 26 1 9.01.01 120 121 535 261    rs rs = 0.9 Strong correlation
  • 20.
    Suresh Babu G Case3 : When the ranks are repeated Example 3 • The value of X and Y are given as n3n .... 12 )2m3 2(m 12 )1m3 1(m2D6 1rs             X 25 45 35 40 15 19 35 42 Y 55 60 30 35 40 42 36 48 Where m1, m2, …. Are the number of repetitions of ranks
  • 21.
    Suresh Babu G XY R1 R2 D = R1 – R2 D2 25 55 6 2 4 16 45 60 1 1 0 0 35 30 4.5 8 3.5 12.25 40 35 3 7 -4 16 15 40 8 5 3 9 19 42 7 4 3 9 35 36 4.5 6 -1.5 2.25 42 48 2 3 -1 1 ΣD2 = 65.5 n3n 12 )1m3 1(m2D6 1rs         
  • 22.
    Suresh Babu G 35occurs 2 times so m1 = 2 883 12 232 5.656 1rs                 214.0786.01 504 396 1 504 5.05.656 1rs         rs = 0.214 Low positive correlation
  • 23.