SlideShare a Scribd company logo
1 of 33
Download to read offline
Z-Score
T-Score
Percentile Rank
&
Box-Plot Graph
K.THIYAGU,
Assistant Professor,
Department of Education,
Central University of Kerala, Kasaragod
ThiyaguSuriya 1
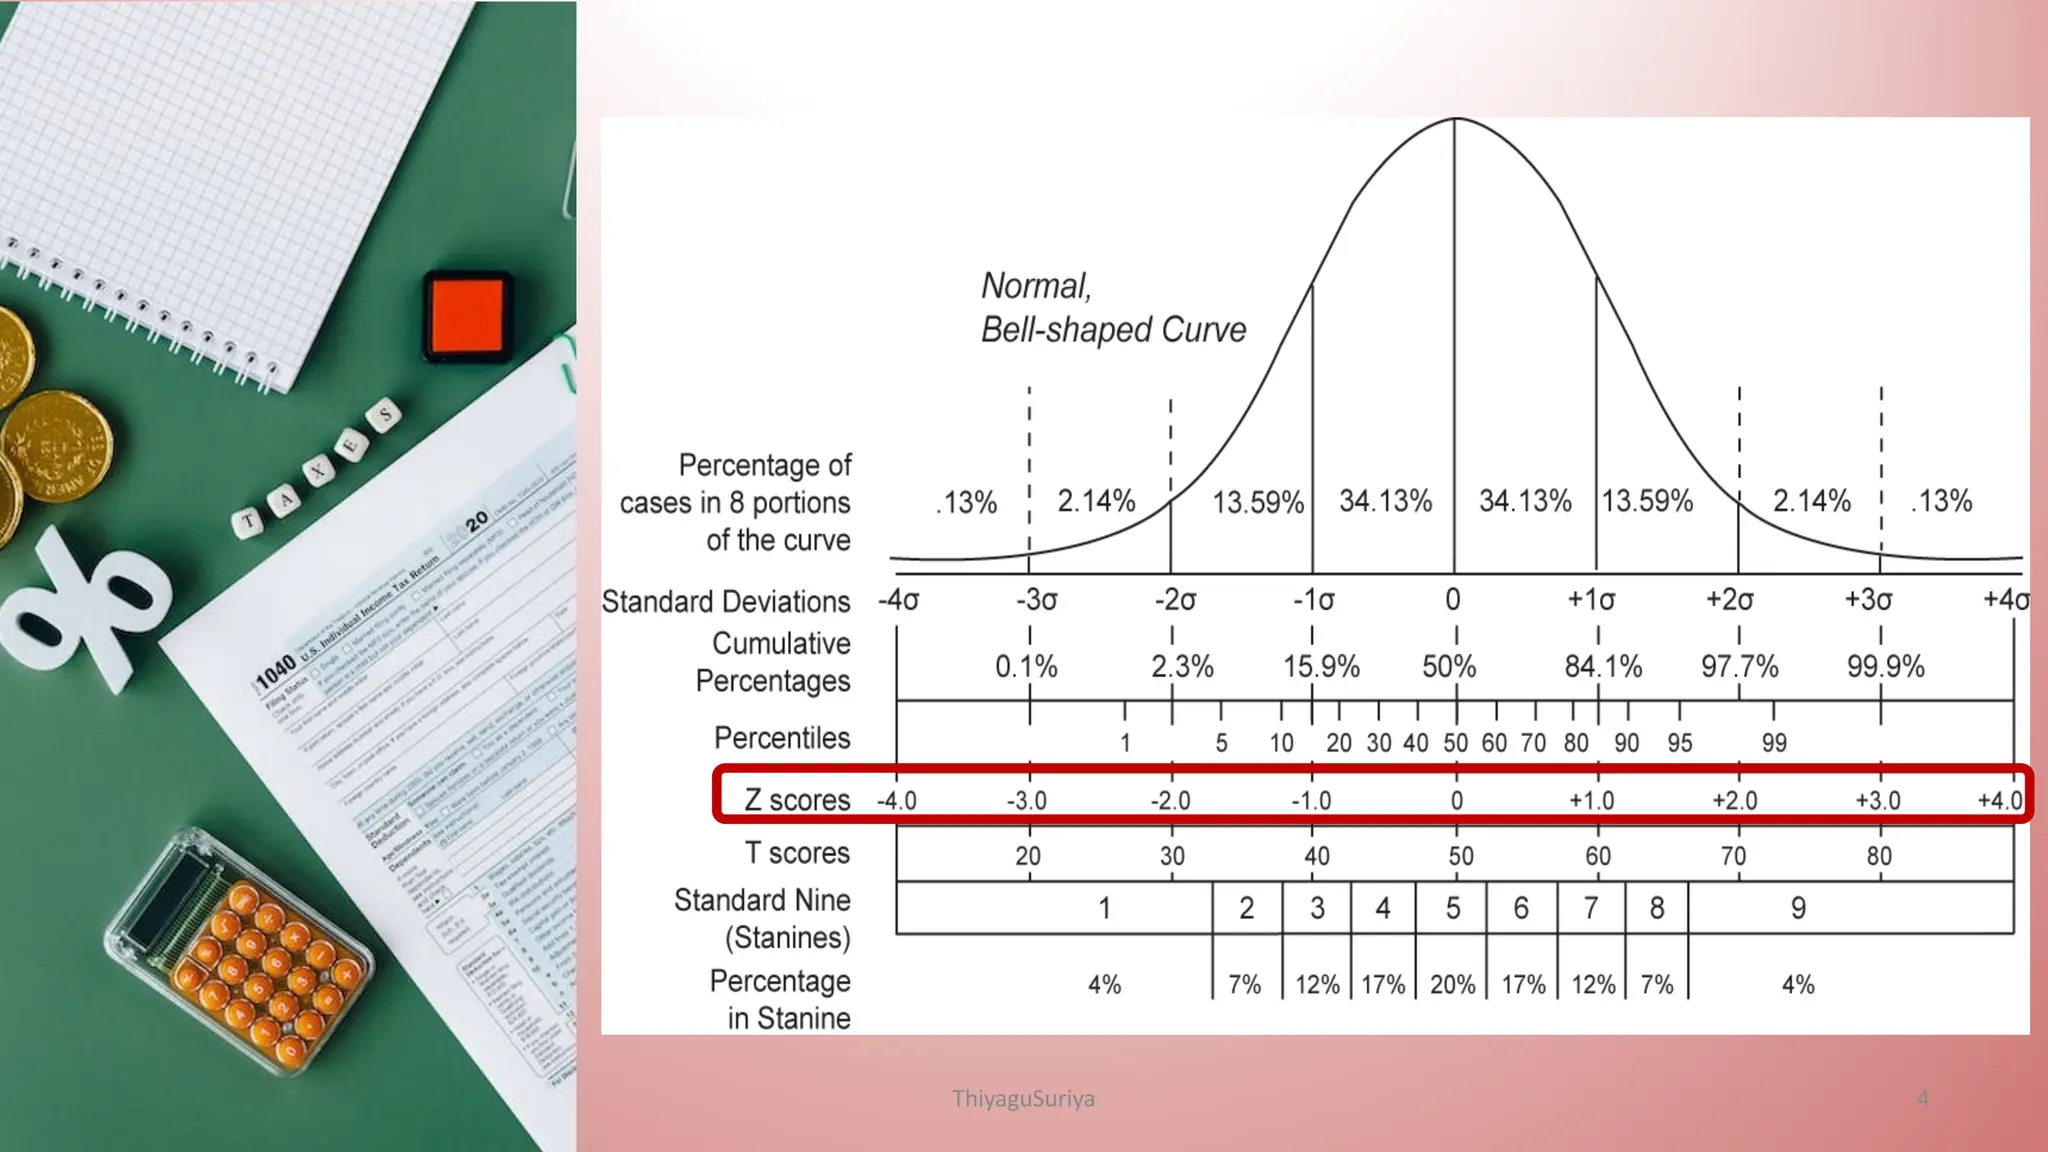
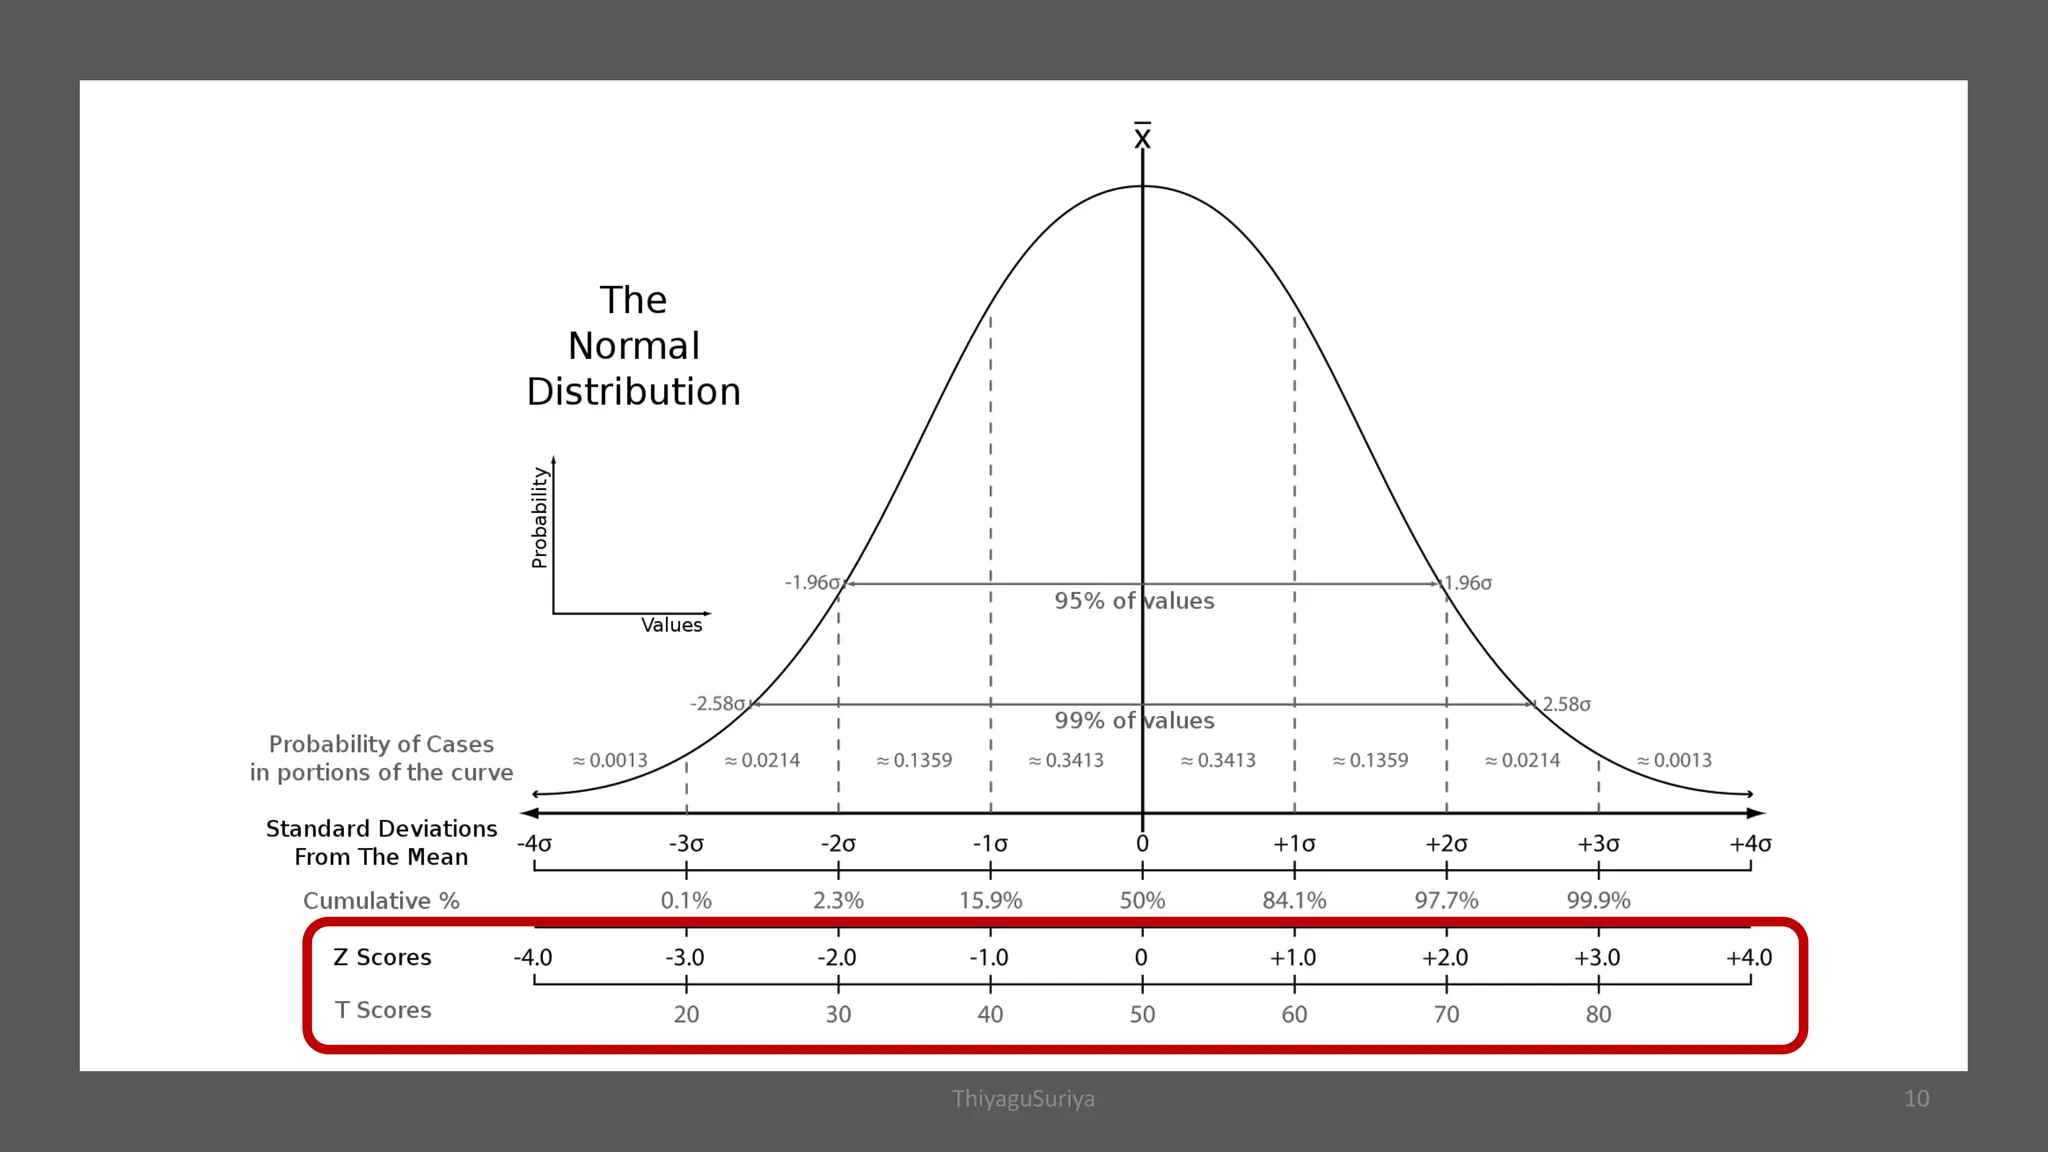
Z-Score
ThiyaguSuriya 2
Z-Score
Z-Score (Z-value, Standard Score, and Normal Score)
Z-score is the
number of standard deviations
from the mean, a data point is
It’s a measure of how many
standard deviations
below or above the population mean
The basic Z score formula for a sample is:
Z =
(𝒙#𝝁)
𝝈 Deviation
Std
core
DeviationS
score
Z
.
=
-
ThiyaguSuriya 3
ThiyaguSuriya 4
Z-score (Standard Deviations) p-value (Probability) Confidence level
< -1.65 or > +1.65 < 0.10 90%
< -1.96 or > +1.96 < 0.05 95%
< -2.58 or > +2.58 < 0.01 99%
https://pro.arcgis.com/en/pro-app/latest/tool-reference/spatial-statistics/what-is-a-z-score-what-is-a-p-value.htm
ThiyaguSuriya 5
Example # 1
Let’s say you have a test score of 190.
The test has a mean (µ) of 150 and a
standard deviation (σ) of 25.
Assuming a normal distribution,
Your Z-score would be:
Z = (x – µ) / σ = 190 – 150 / 25 = 1.6.
The Z score tells you how many standard deviations
from the mean your score is.
In this example,
Your score is 1.6 Standard Deviations above the Mean.
ThiyaguSuriya 6
Ahalya has secured 50 marks in English; the
class mean is 60, and the standard deviation is
10. What is the Z-score of Ahalya?
D
S
M
X
Z
.
-
= s
1
10
10
10
60
50
-
=
-
=
-
=
Z
Example # 2
Answer:
The raw score of 50 may be converted to Z-score by
applying the formula.
So, Ahalya’s Z-score is
Ahalya’s score is 1-Sigma distance below the Mean.
ThiyaguSuriya 7
T-Score
ThiyaguSuriya 8
T-Score
T-score is a type of standard score computed
by multiplying a Z-score by 10 and adding 50.
T-scores tell individuals
How far is their score from the mean?
T-scores have a mean of 50 and
a standard deviation of 10.
T-score was 70 it would, in turn, mean that their
score was 20 points above the mean.
ThiyaguSuriya 9
ThiyaguSuriya 10
Z-Score
vs
T-Score
https://www.educba.com/z-score-vs-t-score/
ThiyaguSuriya 11
https://www.educba.com/z-score-vs-t-score/
Z-Score
vs
T-Score
ThiyaguSuriya 12
T = (Z x 10) + 50.
T = 10 Z + 50.
ThiyaguSuriya 13
Example
Amartya secured 60 marks in English,
which has a mean of 40, and an S.D. of 8.
She secured 50 marks in the mother tongue
test, having a mean of 50 and an S.D. of 6.
Convert all raw scores into T-scores. In
which subject has Amartya done better?
T = 10 Z + 50
ThiyaguSuriya 14
Answer:
Amartya secures 60 in English.
Where Mean = 40 and S.D = 8
Answer:
Amartya secures 50 in Mother Tongue
Where Mean = 50 and S.D = 6
𝑇 = 10 [
𝑥 − 𝑀
𝑆𝐷
] + 50
T = 10 [
!"#!"
$
] + 50
T = 10 [
"
$
] + 50
T = 0 + 50
T = 50
𝑇 = 10 [
𝑥 − 𝑀
𝑆𝐷
] + 50 T = 10 [
$"#%"
&
] + 50
T = 10 [
/0
1
] + 50
T = 10 [
2
/
] + 50
T = 25 + 50 = 75
From the above two T-Scores, Amartya Secures better in English subject than Mother Tongue.
ThiyaguSuriya 15
T-Score vs. Z-Score: When to Use Each
https://www.statology.org/t-score-vs-z-score/
Do you know the population SD?
Use a t-score
Is the sample size (n) greater than 30?
N
o
Y
e
s
Use a t-score Use a z-score
N
o
Yes
ThiyaguSuriya 16
Percentile
Rank
ThiyaguSuriya 17
Percentile Rank
The nth percentile is that scale
value or score point below which
‘n’ percent of the cases in the
distribution fall. The scale value is
the percentile, while its
corresponding percentage value is
its percentile rank.
Percentile
Rank
ThiyaguSuriya 18
Percentile Rank
Calculation of Percentile Rank
from Ungrouped Data
ú
û
ù
ê
ë
é -
-
=
N
R
PR
50
100
100
Where,
PR = Percentile Rank
R = Rank position of the score of an individual
whose percentile rank is to be determined.
ThiyaguSuriya 19
Example
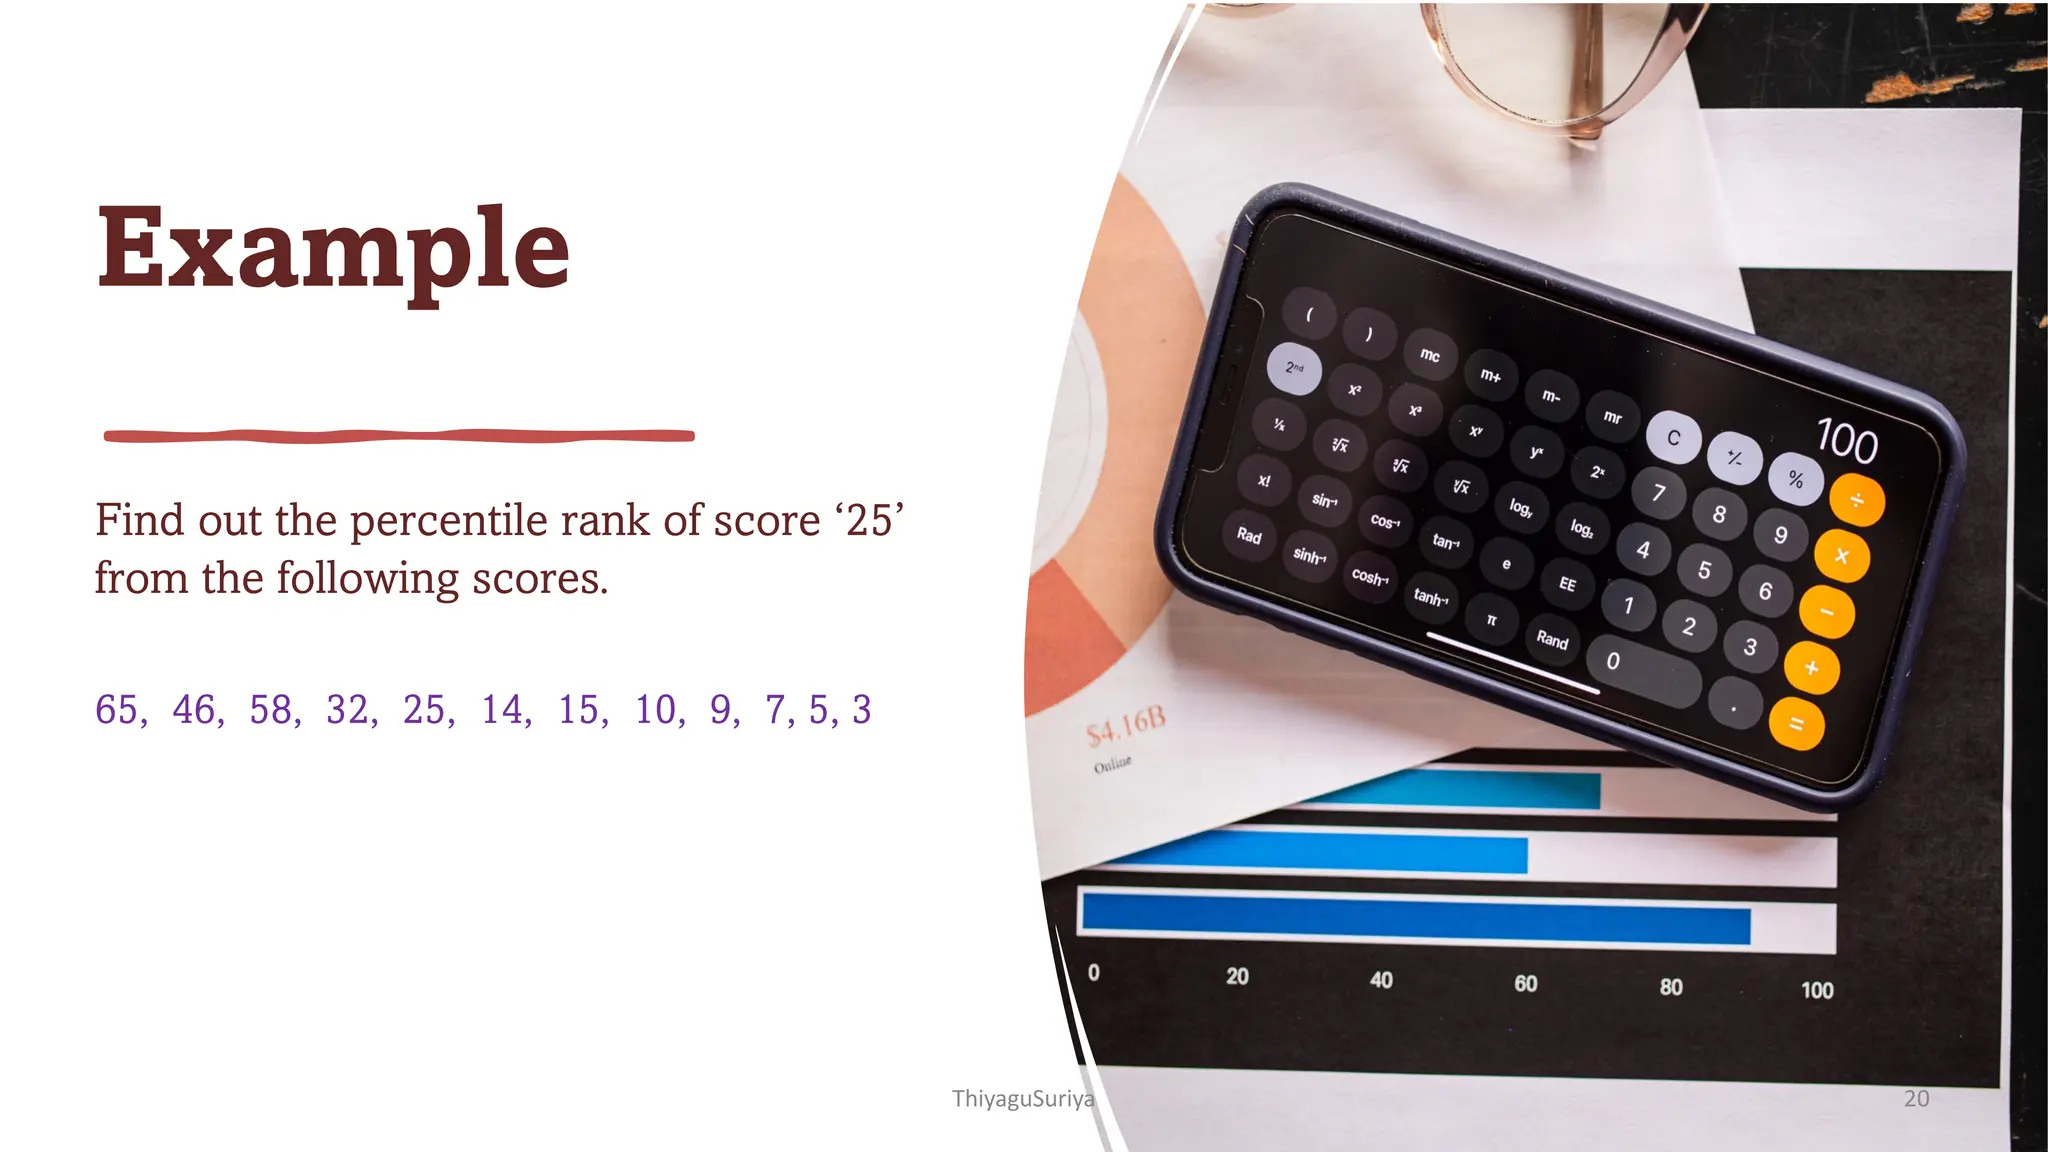
Find out the percentile rank of score ‘25’
from the following scores.
65, 46, 58, 32, 25, 14, 15, 10, 9, 7, 5, 3
ThiyaguSuriya 20
ThiyaguSuriya 21
Group Data
ú
û
ù
ê
ë
é
÷
ø
ö
ç
è
æ -
+
= w
b f
i
L
K
cf
N
PR
100
• Cfb=cumulative frequency below the class interval which k
lies / containing k
• K = Score for which we want to find percentile rank
• L = Actual exact lower limit of the class interval containing
K
• Fw= frequency within the class interval containing k
ThiyaguSuriya 22
CI ECI /CCI f cf
91 – 100 90.5 – 100.5 3 30
81 – 90 80.5 – 90.5 7 27 K
71 – 80 70.5 – 80.5 8 20
61 – 50 60.5 – 50.5 5 12
51 – 60 50.5 – 60.5 4 7
41 – 50 40.5 – 50.5 3 3
Find out the percentile rank of 82 scores of the following frequency distribution.
ThiyaguSuriya 23
ThiyaguSuriya 24
Box Plot
Graph
ThiyaguSuriya 25
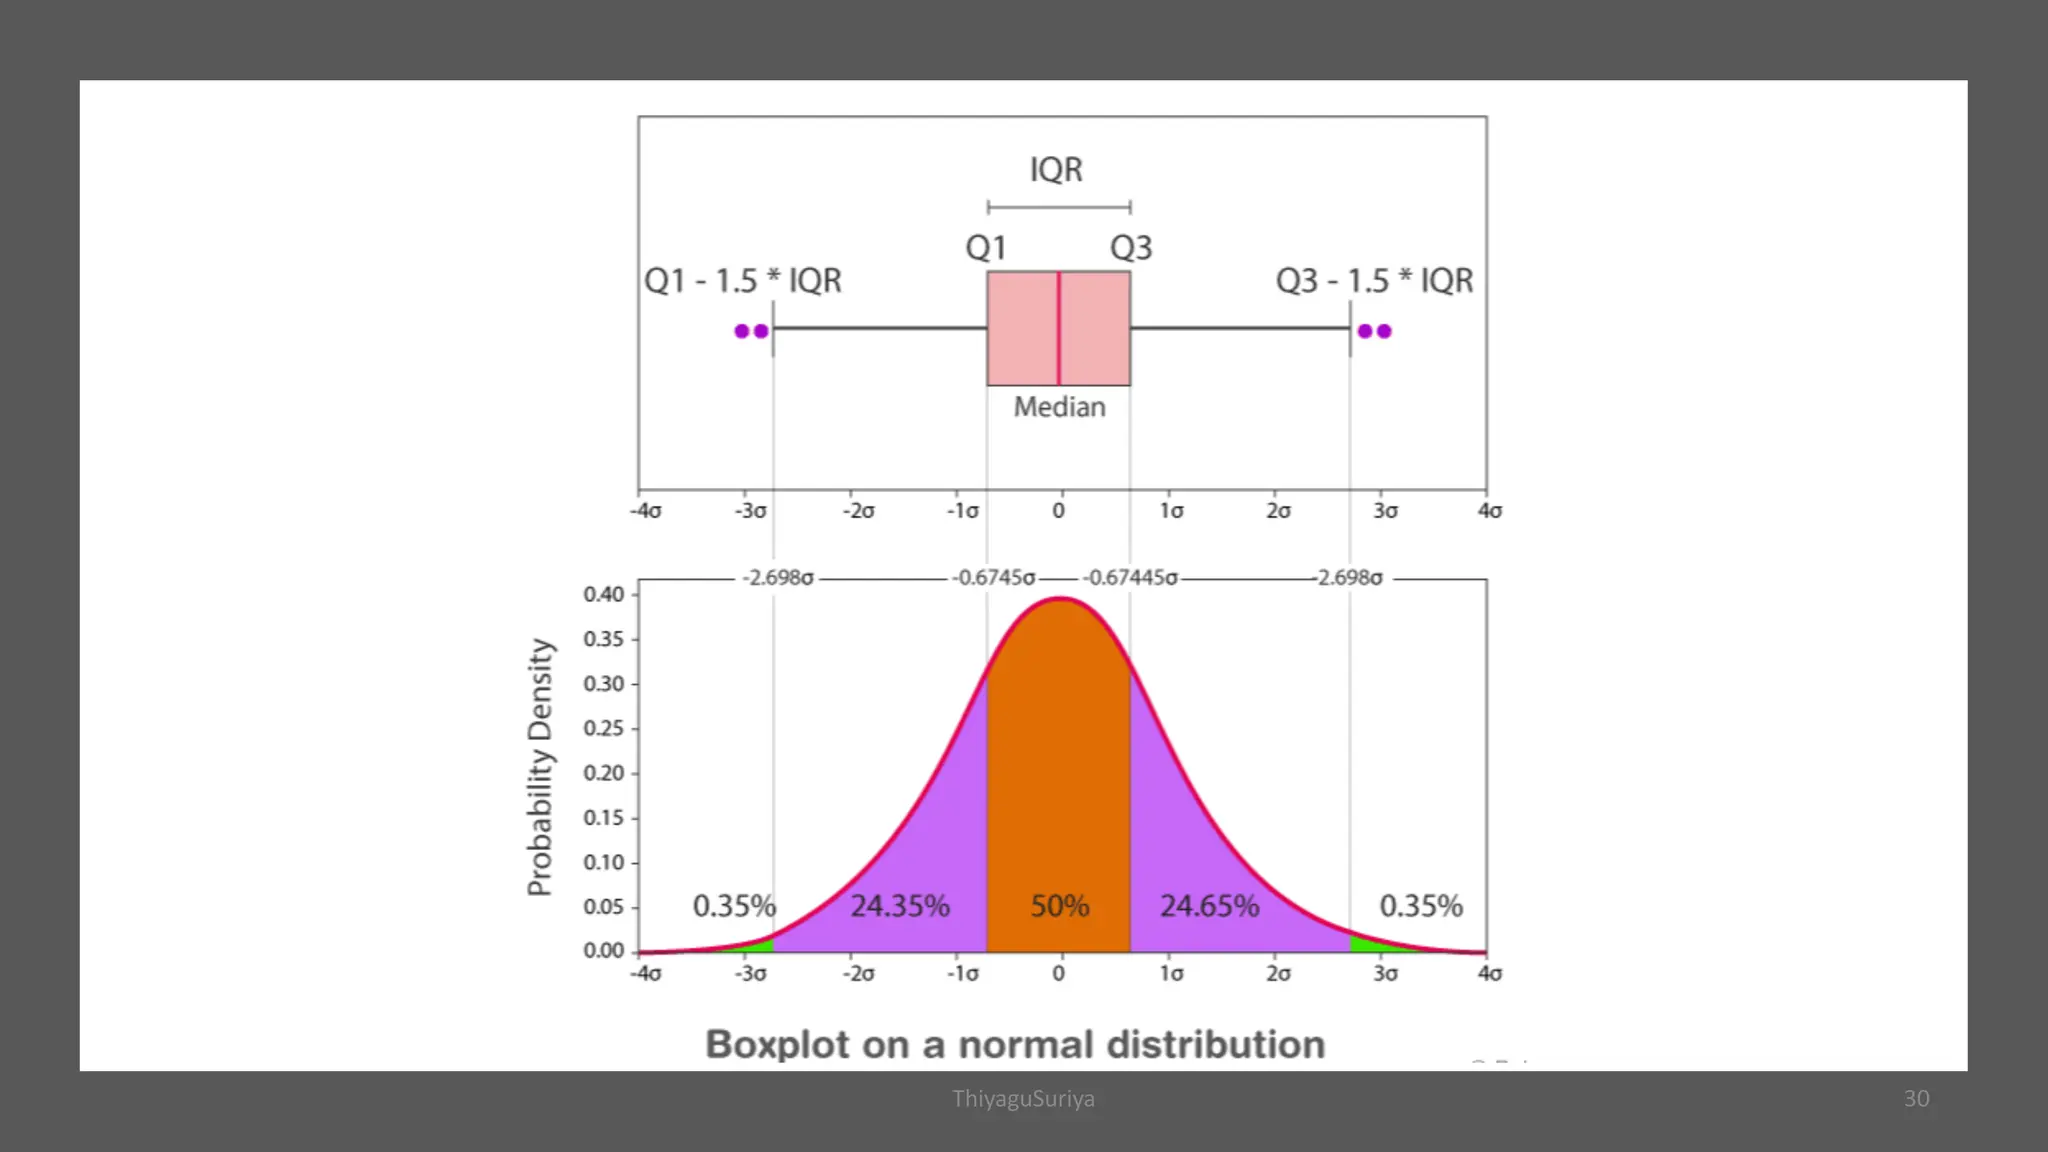
Box Plot
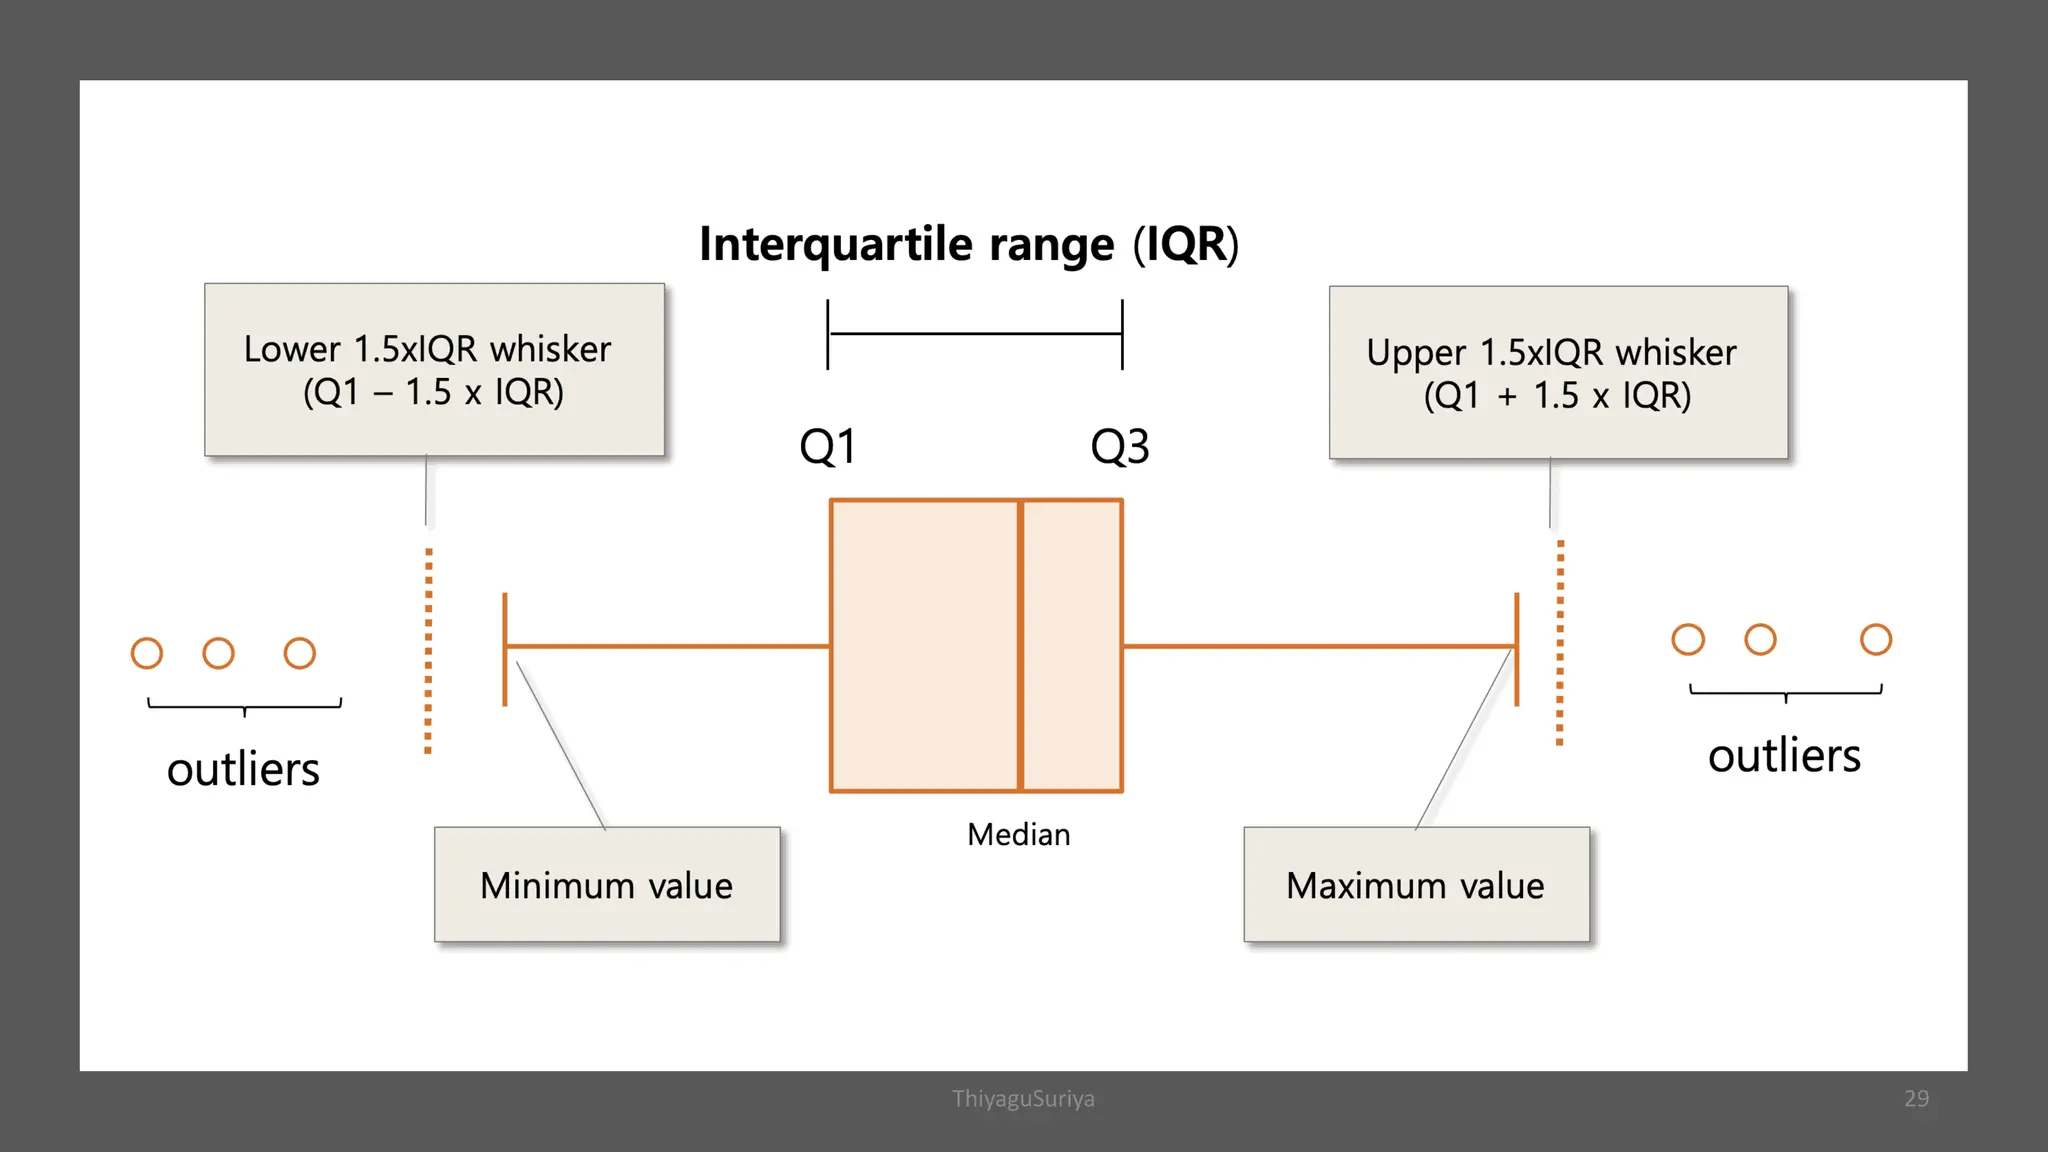
The box plot (box and whisker diagram) is a
standardized way of displaying the distribution of data
based on the five number summaries:
Minimum,
First Quartile,
Median,
Third Quartile,
and Maximum.
ThiyaguSuriya 26
Box Plot
ThiyaguSuriya 27
ThiyaguSuriya 28
ThiyaguSuriya 29
ThiyaguSuriya 30
Boxplots allow us to evaluate whether a data set is symmetrical, right-skewed, or left-skewed.
https://www.labxchange.org/library/items/lb:LabXchange:d8863c77:html:1
ThiyaguSuriya 31
Histograms and boxplots of symmetric, right-skewed, and left-skewed unimodal data sets
https://www.labxchange.org/library/items/lb:LabXchange:d8863c77:html:1
ThiyaguSuriya 32
Thank You
ThiyaguSuriya 33

More Related Content

Similar to Z Score,T Score, Percential Rank and Box Plot Graph

Lesson 8 zscore
Lesson 8 zscoreLesson 8 zscore
Lesson 8 zscore
nurun2010
 
Z scores lecture chapter 2 and 4
Z scores lecture chapter 2 and 4Z scores lecture chapter 2 and 4
Z scores lecture chapter 2 and 4
Karen Price
 

Similar to Z Score,T Score, Percential Rank and Box Plot Graph (20)

Standard Scores
Standard ScoresStandard Scores
Standard Scores
 
3.4 Measures of Position
3.4 Measures of Position3.4 Measures of Position
3.4 Measures of Position
 
Location Scores
Location  ScoresLocation  Scores
Location Scores
 
Location scores
Location scoresLocation scores
Location scores
 
Descriptive statistics
Descriptive statisticsDescriptive statistics
Descriptive statistics
 
Measures of Dispersion and Variability: Range, QD, AD and SD
Measures of Dispersion and Variability: Range, QD, AD and SDMeasures of Dispersion and Variability: Range, QD, AD and SD
Measures of Dispersion and Variability: Range, QD, AD and SD
 
Lesson 8 zscore
Lesson 8 zscoreLesson 8 zscore
Lesson 8 zscore
 
Introduction to statistical concepts
Introduction to statistical conceptsIntroduction to statistical concepts
Introduction to statistical concepts
 
Measures of variability to grading and reporting
Measures of variability to grading and reportingMeasures of variability to grading and reporting
Measures of variability to grading and reporting
 
just to download
just to downloadjust to download
just to download
 
Chapters 2 & 4
Chapters 2 & 4Chapters 2 & 4
Chapters 2 & 4
 
Chapters 2 & 4
Chapters 2 & 4Chapters 2 & 4
Chapters 2 & 4
 
Statistics and probability lesson6&7
Statistics and probability lesson6&7Statistics and probability lesson6&7
Statistics and probability lesson6&7
 
Z scores lecture chapter 2 and 4
Z scores lecture chapter 2 and 4Z scores lecture chapter 2 and 4
Z scores lecture chapter 2 and 4
 
Chapters 2 4
Chapters 2  4Chapters 2  4
Chapters 2 4
 
Practice test1 solution
Practice test1 solutionPractice test1 solution
Practice test1 solution
 
3.3 Measures of relative standing and boxplots
3.3 Measures of relative standing and boxplots3.3 Measures of relative standing and boxplots
3.3 Measures of relative standing and boxplots
 
Analysis of students’ performance
Analysis of students’ performanceAnalysis of students’ performance
Analysis of students’ performance
 
Week8 finalexamlivelecture 2010december
Week8 finalexamlivelecture 2010decemberWeek8 finalexamlivelecture 2010december
Week8 finalexamlivelecture 2010december
 
Week8finalexamlivelecture2011
Week8finalexamlivelecture2011Week8finalexamlivelecture2011
Week8finalexamlivelecture2011
 

More from Thiyagu K

Blooms Digital Taxonomy.pdf
Blooms Digital Taxonomy.pdfBlooms Digital Taxonomy.pdf
Blooms Digital Taxonomy.pdf
Thiyagu K
 
Chat GPT - A Game Changer in Education
Chat GPT - A Game Changer in EducationChat GPT - A Game Changer in Education
Chat GPT - A Game Changer in Education
Thiyagu K
 

More from Thiyagu K (20)

Measures of Central Tendency: Mean, Median and Mode
Measures of Central Tendency: Mean, Median and ModeMeasures of Central Tendency: Mean, Median and Mode
Measures of Central Tendency: Mean, Median and Mode
 
Blooms Digital Taxonomy.pdf
Blooms Digital Taxonomy.pdfBlooms Digital Taxonomy.pdf
Blooms Digital Taxonomy.pdf
 
Artificial Intelligence (AI) in Education.pdf
Artificial Intelligence (AI) in Education.pdfArtificial Intelligence (AI) in Education.pdf
Artificial Intelligence (AI) in Education.pdf
 
Classroom of the Future: 7 Most Powerful Shifts .pdf
Classroom of the Future: 7 Most Powerful Shifts .pdfClassroom of the Future: 7 Most Powerful Shifts .pdf
Classroom of the Future: 7 Most Powerful Shifts .pdf
 
PowerPoint Presentation Tips.pdf
PowerPoint Presentation Tips.pdfPowerPoint Presentation Tips.pdf
PowerPoint Presentation Tips.pdf
 
Chat GPT - A Game Changer in Education
Chat GPT - A Game Changer in EducationChat GPT - A Game Changer in Education
Chat GPT - A Game Changer in Education
 
Chat GPT Intoduction.pdf
Chat GPT Intoduction.pdfChat GPT Intoduction.pdf
Chat GPT Intoduction.pdf
 
Unit 8 - ICT NET Materials (UGC NET Paper I).pdf
Unit 8 - ICT NET Materials (UGC NET Paper I).pdfUnit 8 - ICT NET Materials (UGC NET Paper I).pdf
Unit 8 - ICT NET Materials (UGC NET Paper I).pdf
 
Unit 10 - Higher Education System (UGC NET Paper I).pdf
Unit 10 - Higher Education System (UGC NET Paper I).pdfUnit 10 - Higher Education System (UGC NET Paper I).pdf
Unit 10 - Higher Education System (UGC NET Paper I).pdf
 
Unit 10 - Higher Education System UGC NET Paper I.pdf
Unit 10 - Higher Education System UGC NET Paper I.pdfUnit 10 - Higher Education System UGC NET Paper I.pdf
Unit 10 - Higher Education System UGC NET Paper I.pdf
 
Mobile Photography.pdf
Mobile Photography.pdfMobile Photography.pdf
Mobile Photography.pdf
 
Teaching Aptitude.pdf
Teaching Aptitude.pdfTeaching Aptitude.pdf
Teaching Aptitude.pdf
 
Education Department Activities and Infrastructure
Education Department Activities and InfrastructureEducation Department Activities and Infrastructure
Education Department Activities and Infrastructure
 
NAAC Presentation - Education Department 21.09.2022.pdf
NAAC Presentation - Education Department 21.09.2022.pdfNAAC Presentation - Education Department 21.09.2022.pdf
NAAC Presentation - Education Department 21.09.2022.pdf
 
Unit 2- Research Aptitude (UGC NET Paper I)
Unit 2- Research Aptitude (UGC NET Paper I)Unit 2- Research Aptitude (UGC NET Paper I)
Unit 2- Research Aptitude (UGC NET Paper I)
 
Data Visualisation.pdf
Data Visualisation.pdfData Visualisation.pdf
Data Visualisation.pdf
 
Grant Agencies.pdf
Grant Agencies.pdfGrant Agencies.pdf
Grant Agencies.pdf
 
EdTech Trends 2022.pdf
EdTech Trends 2022.pdfEdTech Trends 2022.pdf
EdTech Trends 2022.pdf
 
Jisha Phd Presentation.pdf
Jisha Phd Presentation.pdfJisha Phd Presentation.pdf
Jisha Phd Presentation.pdf
 
Balance Technology With Mindfulness.pdf
Balance Technology With Mindfulness.pdfBalance Technology With Mindfulness.pdf
Balance Technology With Mindfulness.pdf
 

Recently uploaded

Personalisation of Education by AI and Big Data - Lourdes Guàrdia
Personalisation of Education by AI and Big Data - Lourdes GuàrdiaPersonalisation of Education by AI and Big Data - Lourdes Guàrdia
Personalisation of Education by AI and Big Data - Lourdes Guàrdia
EADTU
 
會考英文會考英文會考英文會考英文會考英文會考英文會考英文會考英文會考英文會考英文會考英文
會考英文會考英文會考英文會考英文會考英文會考英文會考英文會考英文會考英文會考英文會考英文會考英文會考英文會考英文會考英文會考英文會考英文會考英文會考英文會考英文會考英文會考英文
會考英文會考英文會考英文會考英文會考英文會考英文會考英文會考英文會考英文會考英文會考英文
中 央社
 

Recently uploaded (20)

Sternal Fractures & Dislocations - EMGuidewire Radiology Reading Room
Sternal Fractures & Dislocations - EMGuidewire Radiology Reading RoomSternal Fractures & Dislocations - EMGuidewire Radiology Reading Room
Sternal Fractures & Dislocations - EMGuidewire Radiology Reading Room
 
Trauma-Informed Leadership - Five Practical Principles
Trauma-Informed Leadership - Five Practical PrinciplesTrauma-Informed Leadership - Five Practical Principles
Trauma-Informed Leadership - Five Practical Principles
 
Stl Algorithms in C++ jjjjjjjjjjjjjjjjjj
Stl Algorithms in C++ jjjjjjjjjjjjjjjjjjStl Algorithms in C++ jjjjjjjjjjjjjjjjjj
Stl Algorithms in C++ jjjjjjjjjjjjjjjjjj
 
Personalisation of Education by AI and Big Data - Lourdes Guàrdia
Personalisation of Education by AI and Big Data - Lourdes GuàrdiaPersonalisation of Education by AI and Big Data - Lourdes Guàrdia
Personalisation of Education by AI and Big Data - Lourdes Guàrdia
 
How to Manage Website in Odoo 17 Studio App.pptx
How to Manage Website in Odoo 17 Studio App.pptxHow to Manage Website in Odoo 17 Studio App.pptx
How to Manage Website in Odoo 17 Studio App.pptx
 
PSYPACT- Practicing Over State Lines May 2024.pptx
PSYPACT- Practicing Over State Lines May 2024.pptxPSYPACT- Practicing Over State Lines May 2024.pptx
PSYPACT- Practicing Over State Lines May 2024.pptx
 
Observing-Correct-Grammar-in-Making-Definitions.pptx
Observing-Correct-Grammar-in-Making-Definitions.pptxObserving-Correct-Grammar-in-Making-Definitions.pptx
Observing-Correct-Grammar-in-Making-Definitions.pptx
 
Graduate Outcomes Presentation Slides - English (v3).pptx
Graduate Outcomes Presentation Slides - English (v3).pptxGraduate Outcomes Presentation Slides - English (v3).pptx
Graduate Outcomes Presentation Slides - English (v3).pptx
 
Spring gala 2024 photo slideshow - Celebrating School-Community Partnerships
Spring gala 2024 photo slideshow - Celebrating School-Community PartnershipsSpring gala 2024 photo slideshow - Celebrating School-Community Partnerships
Spring gala 2024 photo slideshow - Celebrating School-Community Partnerships
 
When Quality Assurance Meets Innovation in Higher Education - Report launch w...
When Quality Assurance Meets Innovation in Higher Education - Report launch w...When Quality Assurance Meets Innovation in Higher Education - Report launch w...
When Quality Assurance Meets Innovation in Higher Education - Report launch w...
 
An overview of the various scriptures in Hinduism
An overview of the various scriptures in HinduismAn overview of the various scriptures in Hinduism
An overview of the various scriptures in Hinduism
 
How to Send Pro Forma Invoice to Your Customers in Odoo 17
How to Send Pro Forma Invoice to Your Customers in Odoo 17How to Send Pro Forma Invoice to Your Customers in Odoo 17
How to Send Pro Forma Invoice to Your Customers in Odoo 17
 
Mattingly "AI & Prompt Design: Named Entity Recognition"
Mattingly "AI & Prompt Design: Named Entity Recognition"Mattingly "AI & Prompt Design: Named Entity Recognition"
Mattingly "AI & Prompt Design: Named Entity Recognition"
 
會考英文會考英文會考英文會考英文會考英文會考英文會考英文會考英文會考英文會考英文會考英文
會考英文會考英文會考英文會考英文會考英文會考英文會考英文會考英文會考英文會考英文會考英文會考英文會考英文會考英文會考英文會考英文會考英文會考英文會考英文會考英文會考英文會考英文
會考英文會考英文會考英文會考英文會考英文會考英文會考英文會考英文會考英文會考英文會考英文
 
male presentation...pdf.................
male presentation...pdf.................male presentation...pdf.................
male presentation...pdf.................
 
Improved Approval Flow in Odoo 17 Studio App
Improved Approval Flow in Odoo 17 Studio AppImproved Approval Flow in Odoo 17 Studio App
Improved Approval Flow in Odoo 17 Studio App
 
Major project report on Tata Motors and its marketing strategies
Major project report on Tata Motors and its marketing strategiesMajor project report on Tata Motors and its marketing strategies
Major project report on Tata Motors and its marketing strategies
 
e-Sealing at EADTU by Kamakshi Rajagopal
e-Sealing at EADTU by Kamakshi Rajagopale-Sealing at EADTU by Kamakshi Rajagopal
e-Sealing at EADTU by Kamakshi Rajagopal
 
Supporting Newcomer Multilingual Learners
Supporting Newcomer  Multilingual LearnersSupporting Newcomer  Multilingual Learners
Supporting Newcomer Multilingual Learners
 
DEMONSTRATION LESSON IN ENGLISH 4 MATATAG CURRICULUM
DEMONSTRATION LESSON IN ENGLISH 4 MATATAG CURRICULUMDEMONSTRATION LESSON IN ENGLISH 4 MATATAG CURRICULUM
DEMONSTRATION LESSON IN ENGLISH 4 MATATAG CURRICULUM
 

Z Score,T Score, Percential Rank and Box Plot Graph

  • 1. Z-Score T-Score Percentile Rank & Box-Plot Graph K.THIYAGU, Assistant Professor, Department of Education, Central University of Kerala, Kasaragod ThiyaguSuriya 1
  • 3. Z-Score Z-Score (Z-value, Standard Score, and Normal Score) Z-score is the number of standard deviations from the mean, a data point is It’s a measure of how many standard deviations below or above the population mean The basic Z score formula for a sample is: Z = (𝒙#𝝁) 𝝈 Deviation Std core DeviationS score Z . = - ThiyaguSuriya 3
  • 5. Z-score (Standard Deviations) p-value (Probability) Confidence level < -1.65 or > +1.65 < 0.10 90% < -1.96 or > +1.96 < 0.05 95% < -2.58 or > +2.58 < 0.01 99% https://pro.arcgis.com/en/pro-app/latest/tool-reference/spatial-statistics/what-is-a-z-score-what-is-a-p-value.htm ThiyaguSuriya 5
  • 6. Example # 1 Let’s say you have a test score of 190. The test has a mean (µ) of 150 and a standard deviation (σ) of 25. Assuming a normal distribution, Your Z-score would be: Z = (x – µ) / σ = 190 – 150 / 25 = 1.6. The Z score tells you how many standard deviations from the mean your score is. In this example, Your score is 1.6 Standard Deviations above the Mean. ThiyaguSuriya 6
  • 7. Ahalya has secured 50 marks in English; the class mean is 60, and the standard deviation is 10. What is the Z-score of Ahalya? D S M X Z . - = s 1 10 10 10 60 50 - = - = - = Z Example # 2 Answer: The raw score of 50 may be converted to Z-score by applying the formula. So, Ahalya’s Z-score is Ahalya’s score is 1-Sigma distance below the Mean. ThiyaguSuriya 7
  • 9. T-Score T-score is a type of standard score computed by multiplying a Z-score by 10 and adding 50. T-scores tell individuals How far is their score from the mean? T-scores have a mean of 50 and a standard deviation of 10. T-score was 70 it would, in turn, mean that their score was 20 points above the mean. ThiyaguSuriya 9
  • 13. T = (Z x 10) + 50. T = 10 Z + 50. ThiyaguSuriya 13
  • 14. Example Amartya secured 60 marks in English, which has a mean of 40, and an S.D. of 8. She secured 50 marks in the mother tongue test, having a mean of 50 and an S.D. of 6. Convert all raw scores into T-scores. In which subject has Amartya done better? T = 10 Z + 50 ThiyaguSuriya 14
  • 15. Answer: Amartya secures 60 in English. Where Mean = 40 and S.D = 8 Answer: Amartya secures 50 in Mother Tongue Where Mean = 50 and S.D = 6 𝑇 = 10 [ 𝑥 − 𝑀 𝑆𝐷 ] + 50 T = 10 [ !"#!" $ ] + 50 T = 10 [ " $ ] + 50 T = 0 + 50 T = 50 𝑇 = 10 [ 𝑥 − 𝑀 𝑆𝐷 ] + 50 T = 10 [ $"#%" & ] + 50 T = 10 [ /0 1 ] + 50 T = 10 [ 2 / ] + 50 T = 25 + 50 = 75 From the above two T-Scores, Amartya Secures better in English subject than Mother Tongue. ThiyaguSuriya 15
  • 16. T-Score vs. Z-Score: When to Use Each https://www.statology.org/t-score-vs-z-score/ Do you know the population SD? Use a t-score Is the sample size (n) greater than 30? N o Y e s Use a t-score Use a z-score N o Yes ThiyaguSuriya 16
  • 18. Percentile Rank The nth percentile is that scale value or score point below which ‘n’ percent of the cases in the distribution fall. The scale value is the percentile, while its corresponding percentage value is its percentile rank. Percentile Rank ThiyaguSuriya 18
  • 19. Percentile Rank Calculation of Percentile Rank from Ungrouped Data ú û ù ê ë é - - = N R PR 50 100 100 Where, PR = Percentile Rank R = Rank position of the score of an individual whose percentile rank is to be determined. ThiyaguSuriya 19
  • 20. Example Find out the percentile rank of score ‘25’ from the following scores. 65, 46, 58, 32, 25, 14, 15, 10, 9, 7, 5, 3 ThiyaguSuriya 20
  • 22. Group Data ú û ù ê ë é ÷ ø ö ç è æ - + = w b f i L K cf N PR 100 • Cfb=cumulative frequency below the class interval which k lies / containing k • K = Score for which we want to find percentile rank • L = Actual exact lower limit of the class interval containing K • Fw= frequency within the class interval containing k ThiyaguSuriya 22
  • 23. CI ECI /CCI f cf 91 – 100 90.5 – 100.5 3 30 81 – 90 80.5 – 90.5 7 27 K 71 – 80 70.5 – 80.5 8 20 61 – 50 60.5 – 50.5 5 12 51 – 60 50.5 – 60.5 4 7 41 – 50 40.5 – 50.5 3 3 Find out the percentile rank of 82 scores of the following frequency distribution. ThiyaguSuriya 23
  • 26. Box Plot The box plot (box and whisker diagram) is a standardized way of displaying the distribution of data based on the five number summaries: Minimum, First Quartile, Median, Third Quartile, and Maximum. ThiyaguSuriya 26
  • 31. Boxplots allow us to evaluate whether a data set is symmetrical, right-skewed, or left-skewed. https://www.labxchange.org/library/items/lb:LabXchange:d8863c77:html:1 ThiyaguSuriya 31
  • 32. Histograms and boxplots of symmetric, right-skewed, and left-skewed unimodal data sets https://www.labxchange.org/library/items/lb:LabXchange:d8863c77:html:1 ThiyaguSuriya 32