Download as PDF, PPTX

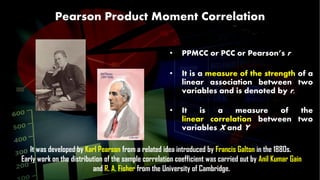

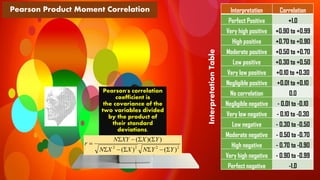
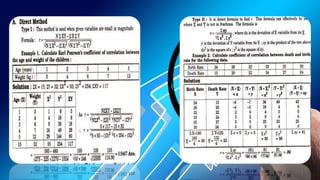
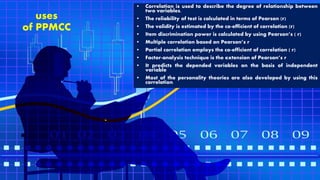


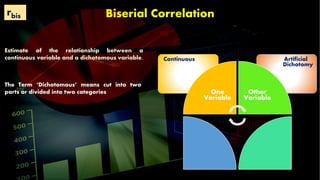

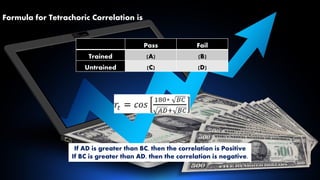

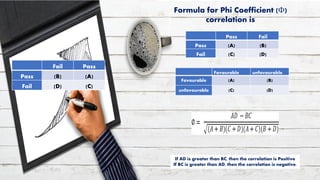
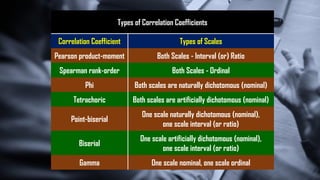


This document discusses various types of correlation coefficients used in statistics. It begins by describing Pearson's product-moment correlation coefficient (r) which measures the strength and direction of the linear relationship between two continuous variables. It then provides background on Karl Pearson who developed r. The rest of the document defines and provides formulas for other correlation coefficients including Spearman's rank correlation coefficient, point-biserial correlation, biserial correlation, tetrachoric correlation, and phi coefficient; and discusses their uses based on the scale types (nominal, ordinal, interval/ratio) of the variables.