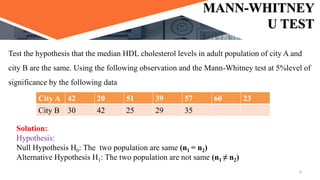
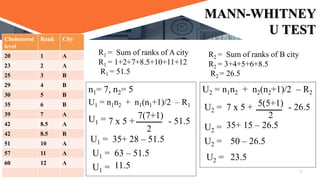
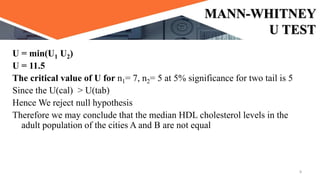
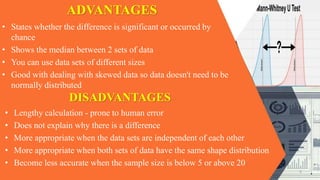
MANN- WHITNEY U TEST
Mrs. D. Melba Sahaya Sweety RN,RM
PhD Nursing , MSc Nursing (Pediatric Nursing),BSc Nursing
Associate Professor
Department of Pediatric Nursing
Enam Nursing College, Savar,
Bangladesh.
1
INTRODUCTION
 The Mann-Whitney U test is a non-parametric test that can be used in
place of an unpaired t-test. It is used to test the null hypothesis that two
samples come from the same population (i.e. have the same median) or,
alternatively,
 The Mann-Whitney test is a test of both location and shape. Given two
independent samples, it tests whether one variable tends to have values higher
than the other. Although it is a non-parametric test it does assume that the
two distributions are similar in shape.
 Thus the hypotheses of Mann-Whitney U Test results in:
• The null hypothesis (H0) is that the two populations are equal.
• The alternative hypothesis (H1) is that the two populations are not equal.
2
ASSUMPTIONS
• The assumptions for the Mann-Whitney U Test include:
1. Ordinal or Continuous : The variable you’re analyzing is ordinal or continuous.
Examples of ordinal variables include Likert items (e.g., a 5-point scale from
“strongly disagree” to “strongly agree”). Examples of continuous variables include
height (measured in inches), weight (measured in pounds), or exam scores (measured
from 0 to 100).
2. Skewed Distribution : free to use a Mann Whitney u test when the variable is
skewed rather than normally distributed.
3. Random Sample :The data should be two randomly selected independent samples,
meaning the groups have no relationship to each other.
4. Enough Data : The sample size (or data set size) should be greater than 5 in each
group
5. Similar Shape Between Groups : While the data in both groups are not assumed to
be Normal, the data are assumed to be similar in shape across the two groups.
3
STEPS OF U TEST
1. State the hypotheses. In most cases, a Mann-Whitney U test is performed as a
two-sided test. The null and alternative hypotheses are written as:
• H0: The two populations are equal
• Ha: The two populations are not equal
2. Determine a significance level to use for the hypothesis.
• Decide on a significance level. Common choices are .01, .05, and .1.
3. Find the test statistic.
To assign rank to each observation of the two samples
• We combine the two samples into a single sample
• Arrange their values in ascending order of magnitude
• Then ranks are assigned to the combined series data 4
STEPS OF U TEST
• The test statistic is denoted as U and is the smaller of U1 and U2, as defined below:
• U1 = n1n2 + n1(n1+1)/2 – R1
• U2 = n1n2 + n2(n2+1)/2 – R2
• where n1 and n2 are the sample sizes for sample 1 and 2 respectively, and R1 and
R2 are the sum of the ranks for sample 1 and 2 respectively.
• U = min(U1 U2)
4. Reject or fail to reject the null hypothesis.
• Using the test statistic, determine whether to reject or fail to reject the null hypothesis
based on the significance level and critical value found in the Mann-Whitney U
Table.
5. Interpret the results.
• Interpret the results of the test in the context of the question being asked.
5
MANN-WHITNEY
U TEST
Test the hypothesis that the median HDL cholesterol levels in adult population of city A and
city B are the same. Using the following observation and the Mann-Whitney test at 5%level of
significance by the following data
City A 42 20 51 39 57 60 23
City B 30 42 25 29 35
Solution:
Hypothesis:
Null Hypothesis H0: The two population are same (n1 = n2)
Alternative Hypothesis H1: The two population are not same (n1 ≠ n2)
6
MANN-WHITNEY
U TEST
n1= 7, n2= 5
U1 = n1n2 + n1(n1+1)/2 – R1
2
Cholesterol
level
Rank City
20 1 A
23 2 A
25 3 B
29 4 B
30 5 B
35 6 B
39 7 A
42 8.5 A
42 8.5 B
51 10 A
57 11 A
60 12 A
R1 = Sum of ranks of A city
R1 = 1+2+7+8.5+10+11+12
R1 = 51.5
R2 = Sum of ranks of B city
R2 = 3+4+5+6+8.5
R2 = 26.5
- 51.5
7 x 5 +
U1 = 7(7+1)
U1 = 35+ 28 – 51.5
U1 = 63 – 51.5
U1 = 11.5
U2 = n1n2 + n2(n2+1)/2 – R2
U2 = 7 x 5 + 5(5+1)
2
- 26.5
U2 = 35+ 15 – 26.5
U2 = 50 – 26.5
U2 = 23.5
7
MANN-WHITNEY
U TEST
U = min(U1 U2)
U = 11.5
The critical value of U for n1= 7, n2= 5 at 5% significance for two tail is 5
Since the U(cal) > U(tab)
Hence We reject null hypothesis
Therefore we may conclude that the median HDL cholesterol levels in the
adult population of the cities A and B are not equal
8
ADVANTAGES
• States whether the difference is significant or occurred by
chance
• Shows the median between 2 sets of data
• You can use data sets of different sizes
• Good with dealing with skewed data so data doesn't need to be
normally distributed
DISADVANTAGES
• Lengthy calculation - prone to human error
• Does not explain why there is a difference
• More appropriate when the data sets are independent of each other
• More appropriate when both sets of data have the same shape distribution
• Become less accurate when the sample size is below 5 or above 20
9
Slide Title
Product A
• Feature 1
• Feature 2
• Feature 3
Product B
• Feature 1
• Feature 2
• Feature 3
10
11

Mann - Whitney U test.pptx

  • 1.
    MANN- WHITNEY UTEST Mrs. D. Melba Sahaya Sweety RN,RM PhD Nursing , MSc Nursing (Pediatric Nursing),BSc Nursing Associate Professor Department of Pediatric Nursing Enam Nursing College, Savar, Bangladesh. 1
  • 2.
    INTRODUCTION  The Mann-WhitneyU test is a non-parametric test that can be used in place of an unpaired t-test. It is used to test the null hypothesis that two samples come from the same population (i.e. have the same median) or, alternatively,  The Mann-Whitney test is a test of both location and shape. Given two independent samples, it tests whether one variable tends to have values higher than the other. Although it is a non-parametric test it does assume that the two distributions are similar in shape.  Thus the hypotheses of Mann-Whitney U Test results in: • The null hypothesis (H0) is that the two populations are equal. • The alternative hypothesis (H1) is that the two populations are not equal. 2
  • 3.
    ASSUMPTIONS • The assumptionsfor the Mann-Whitney U Test include: 1. Ordinal or Continuous : The variable you’re analyzing is ordinal or continuous. Examples of ordinal variables include Likert items (e.g., a 5-point scale from “strongly disagree” to “strongly agree”). Examples of continuous variables include height (measured in inches), weight (measured in pounds), or exam scores (measured from 0 to 100). 2. Skewed Distribution : free to use a Mann Whitney u test when the variable is skewed rather than normally distributed. 3. Random Sample :The data should be two randomly selected independent samples, meaning the groups have no relationship to each other. 4. Enough Data : The sample size (or data set size) should be greater than 5 in each group 5. Similar Shape Between Groups : While the data in both groups are not assumed to be Normal, the data are assumed to be similar in shape across the two groups. 3
  • 4.
    STEPS OF UTEST 1. State the hypotheses. In most cases, a Mann-Whitney U test is performed as a two-sided test. The null and alternative hypotheses are written as: • H0: The two populations are equal • Ha: The two populations are not equal 2. Determine a significance level to use for the hypothesis. • Decide on a significance level. Common choices are .01, .05, and .1. 3. Find the test statistic. To assign rank to each observation of the two samples • We combine the two samples into a single sample • Arrange their values in ascending order of magnitude • Then ranks are assigned to the combined series data 4
  • 5.
    STEPS OF UTEST • The test statistic is denoted as U and is the smaller of U1 and U2, as defined below: • U1 = n1n2 + n1(n1+1)/2 – R1 • U2 = n1n2 + n2(n2+1)/2 – R2 • where n1 and n2 are the sample sizes for sample 1 and 2 respectively, and R1 and R2 are the sum of the ranks for sample 1 and 2 respectively. • U = min(U1 U2) 4. Reject or fail to reject the null hypothesis. • Using the test statistic, determine whether to reject or fail to reject the null hypothesis based on the significance level and critical value found in the Mann-Whitney U Table. 5. Interpret the results. • Interpret the results of the test in the context of the question being asked. 5
  • 6.
    MANN-WHITNEY U TEST Test thehypothesis that the median HDL cholesterol levels in adult population of city A and city B are the same. Using the following observation and the Mann-Whitney test at 5%level of significance by the following data City A 42 20 51 39 57 60 23 City B 30 42 25 29 35 Solution: Hypothesis: Null Hypothesis H0: The two population are same (n1 = n2) Alternative Hypothesis H1: The two population are not same (n1 ≠ n2) 6
  • 7.
    MANN-WHITNEY U TEST n1= 7,n2= 5 U1 = n1n2 + n1(n1+1)/2 – R1 2 Cholesterol level Rank City 20 1 A 23 2 A 25 3 B 29 4 B 30 5 B 35 6 B 39 7 A 42 8.5 A 42 8.5 B 51 10 A 57 11 A 60 12 A R1 = Sum of ranks of A city R1 = 1+2+7+8.5+10+11+12 R1 = 51.5 R2 = Sum of ranks of B city R2 = 3+4+5+6+8.5 R2 = 26.5 - 51.5 7 x 5 + U1 = 7(7+1) U1 = 35+ 28 – 51.5 U1 = 63 – 51.5 U1 = 11.5 U2 = n1n2 + n2(n2+1)/2 – R2 U2 = 7 x 5 + 5(5+1) 2 - 26.5 U2 = 35+ 15 – 26.5 U2 = 50 – 26.5 U2 = 23.5 7
  • 8.
    MANN-WHITNEY U TEST U =min(U1 U2) U = 11.5 The critical value of U for n1= 7, n2= 5 at 5% significance for two tail is 5 Since the U(cal) > U(tab) Hence We reject null hypothesis Therefore we may conclude that the median HDL cholesterol levels in the adult population of the cities A and B are not equal 8
  • 9.
    ADVANTAGES • States whetherthe difference is significant or occurred by chance • Shows the median between 2 sets of data • You can use data sets of different sizes • Good with dealing with skewed data so data doesn't need to be normally distributed DISADVANTAGES • Lengthy calculation - prone to human error • Does not explain why there is a difference • More appropriate when the data sets are independent of each other • More appropriate when both sets of data have the same shape distribution • Become less accurate when the sample size is below 5 or above 20 9
  • 10.
    Slide Title Product A •Feature 1 • Feature 2 • Feature 3 Product B • Feature 1 • Feature 2 • Feature 3 10
  • 11.