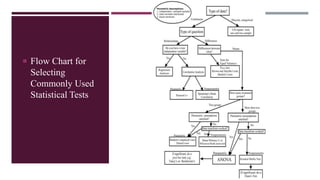
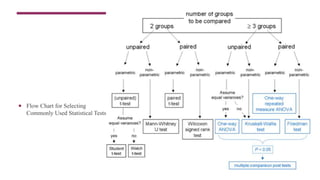
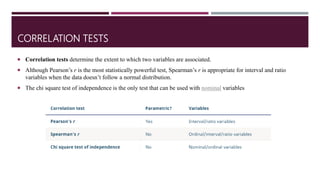
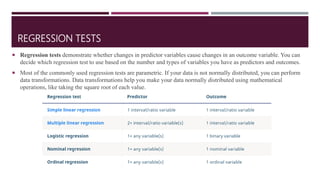
EDUCATIONAL STATISTICS
PRESENTED BY DR. HINA JALAL
Inferential DataAnalysis
2
CONTENT LIST
Inferential Statistics
Introduction to Inferential Statistics
Areas of Inferential Statistics
Logic of Inferential Statistics
Importance of Inferential Statistics in Research
3
INFERENTIAL STATISTICS
• It helps you come to conclusions and make predictions based on your data.
• Inferential statistics, uncover patterns or relationships in the data set, make judgment about data, or apply
information about a smaller data set to a larger group.
• It is used to make inferences about the population on the bases of data obtained from the sample.
• It is also used to make judgments of the probability that an observed difference among groups is a dependable
one or one that might have happened by chance in the study.
• The main aim of inferential statistics is to draw some conclusions from the sample and generalise them for the
population data.
• E.g. we have to find the average salary of a data analyst across Punjab . There are two options.
• The first option is to consider the data of data analysts across Punjab and ask them their salaries and take an
average.
• The second option is to take a sample of data analysts from the major IT cities in Punjab and take their average
and consider that for across Punjab.
4
AREAS OF INFERENTIAL STATISTICS
Inferential statistics have two main uses:
1. Making estimates about populations (for example, the mean SAT score of all 11th graders in the US).
The characteristics of samples and populations are described by numbers called statistics and parameters:
• A statistic is a measure that describes the sample (e.g., sample mean).
• A parameter is a measure that describes the whole population (e.g., population mean)
1. Testing hypotheses to draw conclusions about populations (for example, the relationship between
SAT scores and family income).
Hypothesis testing is a formal process of statistical analysis using inferential statistics. The goal of hypothesis
testing is to compare populations or assess relationships between variables using samples.
Hypotheses, or predictions, are tested using statistical tests. Statistical tests also estimate sampling errors so that
valid inferences can be made
7/18/2020 6
DESCRIPTIVE AND INFERENTIAL STATISTICS (DIFFERENCE)
Descriptive statistics
It allows you to describe a data set, while inferential
statistics allow you to make inferences based on a data set.
Descriptive statistics
Using descriptive statistics, you can report characteristics of
your data:
• The distribution concerns the frequency of each value.
• The central tendency concerns the averages of the values.
• The variability concerns how spread out the values are
7
Inferential statistics
Most of the time, you can only acquire data from samples,
because it is too difficult or expensive to collect data from the
whole population that you’re interested in.
While descriptive statistics can only summarize a sample’s
characteristics, inferential statistics use your sample to make
reasonable guesses about the larger population.
With inferential statistics, it’s important to use random and
unbiased sampling methods. If your sample isn’t
representative of your population, then you can’t make valid
statistical inferences
IMPORTANCE OF INFERENTIAL STATISTICS
 Making conclusions from a sample about the population
 To conclude if a sample selected is statistically significant to the whole population or not
 Comparing two models to find which one is more statistically significant as compared to the
other.
 In feature selection, whether adding or removing a variable helps in improving the model or not.
 It helps us make judgment about probability in observation.
 It enables researchers to infer properties of a population based on data collected from a sample
of individuals.
 It helps us to learn from descriptive statistics, and allow us to go beyond immediate data.
SAMPLING ERRORS IN INFERENTIAL STATISTICS
Since the size of a sample is always smaller than the size of the population, some of the
population isn’t captured by sample data. This creates sampling error, which is the
difference between the true population values (called parameters) and the measured sample
values (called statistics).
Sampling error arises any time you use a sample, even if your sample is random and
unbiased. For this reason, there is always some uncertainty in inferential statistics.
However, using probability sampling methods reduces this uncertainty.
8
 Flow Chart for
Selecting
Commonly Used
Statistical Tests
 Flow Chart for Selecting
Commonly Used Statistical Tests
COMPARISON TESTS
Comparison tests assess whether there are differences in means, medians or rankings of scores of two or more groups.
To decide which test suits your aim, consider whether your data meets the conditions necessary for parametric tests, the
number of samples, and the levels of measurement of your variables.
CORRELATION TESTS
 Correlation tests determine the extent to which two variables are associated.
 Although Pearson’s r is the most statistically powerful test, Spearman’s r is appropriate for interval and ratio
variables when the data doesn’t follow a normal distribution.
 The chi square test of independence is the only test that can be used with nominal variables
REGRESSION TESTS
 Regression tests demonstrate whether changes in predictor variables cause changes in an outcome variable. You can
decide which regression test to use based on the number and types of variables you have as predictors and outcomes.
 Most of the commonly used regression tests are parametric. If your data is not normally distributed, you can perform
data transformations. Data transformations help you make your data normally distributed using mathematical
operations, like taking the square root of each value.
Dr. Hina Jalal
@AksEAina (hinansari23@gmail.com)

Basics of Educational Statistics (Inferential statistics)

  • 1.
    EDUCATIONAL STATISTICS PRESENTED BYDR. HINA JALAL Inferential DataAnalysis 2
  • 2.
    CONTENT LIST Inferential Statistics Introductionto Inferential Statistics Areas of Inferential Statistics Logic of Inferential Statistics Importance of Inferential Statistics in Research 3
  • 3.
    INFERENTIAL STATISTICS • Ithelps you come to conclusions and make predictions based on your data. • Inferential statistics, uncover patterns or relationships in the data set, make judgment about data, or apply information about a smaller data set to a larger group. • It is used to make inferences about the population on the bases of data obtained from the sample. • It is also used to make judgments of the probability that an observed difference among groups is a dependable one or one that might have happened by chance in the study. • The main aim of inferential statistics is to draw some conclusions from the sample and generalise them for the population data. • E.g. we have to find the average salary of a data analyst across Punjab . There are two options. • The first option is to consider the data of data analysts across Punjab and ask them their salaries and take an average. • The second option is to take a sample of data analysts from the major IT cities in Punjab and take their average and consider that for across Punjab. 4
  • 4.
    AREAS OF INFERENTIALSTATISTICS Inferential statistics have two main uses: 1. Making estimates about populations (for example, the mean SAT score of all 11th graders in the US). The characteristics of samples and populations are described by numbers called statistics and parameters: • A statistic is a measure that describes the sample (e.g., sample mean). • A parameter is a measure that describes the whole population (e.g., population mean) 1. Testing hypotheses to draw conclusions about populations (for example, the relationship between SAT scores and family income). Hypothesis testing is a formal process of statistical analysis using inferential statistics. The goal of hypothesis testing is to compare populations or assess relationships between variables using samples. Hypotheses, or predictions, are tested using statistical tests. Statistical tests also estimate sampling errors so that valid inferences can be made 7/18/2020 6
  • 5.
    DESCRIPTIVE AND INFERENTIALSTATISTICS (DIFFERENCE) Descriptive statistics It allows you to describe a data set, while inferential statistics allow you to make inferences based on a data set. Descriptive statistics Using descriptive statistics, you can report characteristics of your data: • The distribution concerns the frequency of each value. • The central tendency concerns the averages of the values. • The variability concerns how spread out the values are 7 Inferential statistics Most of the time, you can only acquire data from samples, because it is too difficult or expensive to collect data from the whole population that you’re interested in. While descriptive statistics can only summarize a sample’s characteristics, inferential statistics use your sample to make reasonable guesses about the larger population. With inferential statistics, it’s important to use random and unbiased sampling methods. If your sample isn’t representative of your population, then you can’t make valid statistical inferences
  • 6.
    IMPORTANCE OF INFERENTIALSTATISTICS  Making conclusions from a sample about the population  To conclude if a sample selected is statistically significant to the whole population or not  Comparing two models to find which one is more statistically significant as compared to the other.  In feature selection, whether adding or removing a variable helps in improving the model or not.  It helps us make judgment about probability in observation.  It enables researchers to infer properties of a population based on data collected from a sample of individuals.  It helps us to learn from descriptive statistics, and allow us to go beyond immediate data.
  • 7.
    SAMPLING ERRORS ININFERENTIAL STATISTICS Since the size of a sample is always smaller than the size of the population, some of the population isn’t captured by sample data. This creates sampling error, which is the difference between the true population values (called parameters) and the measured sample values (called statistics). Sampling error arises any time you use a sample, even if your sample is random and unbiased. For this reason, there is always some uncertainty in inferential statistics. However, using probability sampling methods reduces this uncertainty. 8
  • 8.
     Flow Chartfor Selecting Commonly Used Statistical Tests
  • 9.
     Flow Chartfor Selecting Commonly Used Statistical Tests
  • 10.
    COMPARISON TESTS Comparison testsassess whether there are differences in means, medians or rankings of scores of two or more groups. To decide which test suits your aim, consider whether your data meets the conditions necessary for parametric tests, the number of samples, and the levels of measurement of your variables.
  • 11.
    CORRELATION TESTS  Correlationtests determine the extent to which two variables are associated.  Although Pearson’s r is the most statistically powerful test, Spearman’s r is appropriate for interval and ratio variables when the data doesn’t follow a normal distribution.  The chi square test of independence is the only test that can be used with nominal variables
  • 12.
    REGRESSION TESTS  Regressiontests demonstrate whether changes in predictor variables cause changes in an outcome variable. You can decide which regression test to use based on the number and types of variables you have as predictors and outcomes.  Most of the commonly used regression tests are parametric. If your data is not normally distributed, you can perform data transformations. Data transformations help you make your data normally distributed using mathematical operations, like taking the square root of each value.
  • 13.
    Dr. Hina Jalal @AksEAina(hinansari23@gmail.com)