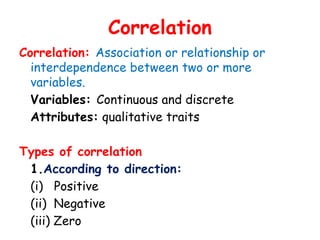
Correlation
Correlation: Association orrelationship or
interdependence between two or more
variables.
Variables: Continuous and discrete
Attributes: qualitative traits
Types of correlation
1.According to direction:
(i) Positive
(ii) Negative
(iii) Zero
2.
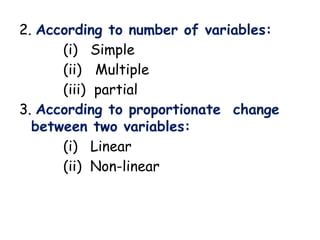
2. According tonumber of variables:
(i) Simple
(ii) Multiple
(iii) partial
3. According to proportionate change
between two variables:
(i) Linear
(ii) Non-linear
3.
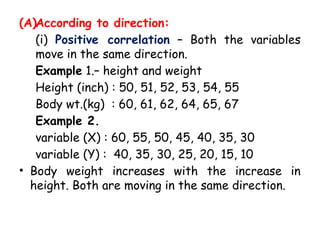
(A)According to direction:
(i)Positive correlation – Both the variables
move in the same direction.
Example 1.– height and weight
Height (inch) : 50, 51, 52, 53, 54, 55
Body wt.(kg) : 60, 61, 62, 64, 65, 67
Example 2.
variable (X) : 60, 55, 50, 45, 40, 35, 30
variable (Y) : 40, 35, 30, 25, 20, 15, 10
• Body weight increases with the increase in
height. Both are moving in the same direction.
4.
(ii) Negative correlation– Both the
variables move in the opposite
direction.
Example – Milk yield & fat percentage
Daily M Y (kg): 10, 12, 14, 16, 17, 18, 20
Fat % : 6.5, 6, 5.5, 5, 4.5, 4.5, 4
• One variable is increasing while the
other is decreasing. With the increase
in milk production, the fat % in milk is
going down.
5.
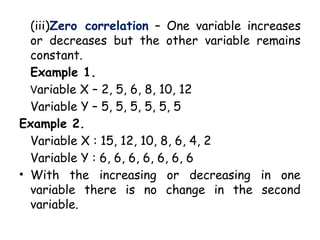
(iii)Zero correlation –One variable increases
or decreases but the other variable remains
constant.
Example 1.
Variable X – 2, 5, 6, 8, 10, 12
Variable Y – 5, 5, 5, 5, 5, 5
Example 2.
Variable X : 15, 12, 10, 8, 6, 4, 2
Variable Y : 6, 6, 6, 6, 6, 6, 6
• With the increasing or decreasing in one
variable there is no change in the second
variable.
6.
(B) According tono. of variables:
(i) Simple – only two variables are studied at a time.
Eg. Height & Body wt.
(ii) Multiple – three or more variables studied at a
time.
Example – feed quality, quantity given, feed
conversion, body weight, etc.
(iii) Partial correlation – studied three or more
variables but find out correlation between two
variables at a time while others kept constant.
Eg. Correlation between crop yield and amount of
fertilizer given while number of irrigation given is
kept as constant.
7.
( C)According toproportionate change
between variables:
(i) Linear - Both the variables move at a
constant ratio throughout.
Example: X 5, 10, 15, 20, 25
Y 10, 20, 30, 40, 50
constant ratio ½.
(ii) Non-linear – Variables do not follow a
constant ratio throughout.
Example: X = 10, 15, 20, 25, 30, 35, 40
Y = 8, 10, 12, 13, 18, 20, 25
8.
Coefficient of correlation:
•It measures the degree of association or
degree of interdependence or
relationship between two or more
variables.
• Denoted as ‘r’, i.e., rxy so that, rxy = ryx
• Concept given by Karl Pearson.
9.
Properties of correlationcoefficient:
(i) Ranges from -1 to +1
(ii) Pure number
(iii) No unit
(iv) + 1 is perfect positive correlation
(v) - 1 is perfect negative correlation
(vi) when r = 0, it means no correlation
(vii) rxy = ryx
10.
METHODS OF STUDYINGCORRELATION
• Scatter diagram
• Correlation graph
• Karl pearson's coefficient of correlation
• Concurrent deviation method.
• Rank method
11.
SCATTER DIAGRAM
• Ascatter diagram or scattergram or scatterplot or dot diagram
is a chart prepared to represent graphically the relationship
between two variables.
• Take one variable on the horizontal and another on the vertical
axis and mark points corresponding to each pair of the given
observations after taking suitable scale. Then, the figure which
contains the collection of dots or points is called a scatter
diagram.
• The way in which the dot lies on the scatter diagram shows the
type of correlation.
• If these dots show some trend either upward or downward,then
the two variables are correlated. If the dots do not show any
trend, there is absence of correlation between the two
variables.
12.
CORRELATION GRAPH
• Ifboth the curves drawn on the graph are moving in the same direction
(either upward or downward), correlation is said to be positive
• On the other hand, if the curves are moving in the opposite direction,
correlation is said to be negative
• This method is normally used for time series data. However, like scatter
diagram, this method also does not offer any numerical value for coefficient
of correlation.
13.
Methods to estimatecoefficient of
correlation:
1. Pearsonian method:
rxy =
Covxy =
sdx =
sdy =
Problem 1. Estimatethe coefficient of
correlation between two variables x & y from
the following set of data.
rXY =
=
Sl. No. X Y X2 Y2 XY
1 4 6 16 36 24
2 5 7 25 49 35
3 6 8 36 64 48
4 7 9 49 81 63
5 8 10 64 100 80
Total 30 40 190 330 250
Exercise No. 1.Estimate the coefficient
of correlation between X and Y variables
from the following data.
Sl. No. X Y X2
Y2
XY
1. 2 4
2. 4 6
3. 6 8
4. 8 10
5. 10 12
18.
Exercise no. 2.Calculate the coefficient of
correlation between daily milk yield(kg) and fat
percentage (%) in milk of following cows.
Sl. No. DMY (X) Fat % (Y) X2 Y2 XY
1. 5 6.0
2. 6 6.0
3. 7 5.5
4. 8 5.5
5. 9 5.0
6. 10 5.0
7. 11 4.5
8. 12 4.0
9. 5 6.0
10. 6 6.0
Total
19.
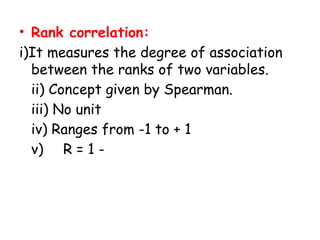
• Rank correlation:
i)Itmeasures the degree of association
between the ranks of two variables.
ii) Concept given by Spearman.
iii) No unit
iv) Ranges from -1 to + 1
v) R = 1 -
20.
Where,
di = xi– yi
xi = ith rank of x variable
yi = ith rank of y variable
n = pair number of observation
∑di = 0
• To avoid the mathematical complexity
the differences between the ranks are
squared.
21.
• Example: Estimationof rank correlation
between the ranks of students secured for
marks obtained in two subjects.
AGB 605 Mid-
term (x)
Rank (Xi) Final (y) Rank (Yi) di = xi – yi di2
A 60 6 58 6 0 0
B 70 4 68 5 -1 1
C 90 1 78 3 -2 4
D 65 5 88 1 4 16
E 75 3 84 2 1 1
F 85 2 72 4 -2 4
Total ∑di = 0 ∑di2=
26
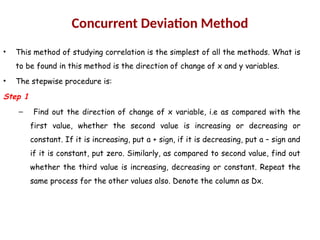
Concurrent Deviation Method
•This method of studying correlation is the simplest of all the methods. What is
to be found in this method is the direction of change of x and y variables.
• The stepwise procedure is:
Step 1
– Find out the direction of change of x variable, i.e as compared with the
first value, whether the second value is increasing or decreasing or
constant. If it is increasing, put a + sign, if it is decreasing, put a – sign and
if it is constant, put zero. Similarly, as compared to second value, find out
whether the third value is increasing, decreasing or constant. Repeat the
same process for the other values also. Denote the column as Dx.
24.
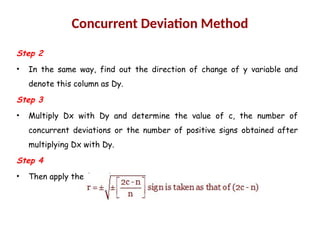
Step 2
• Inthe same way, find out the direction of change of y variable and
denote this column as Dy.
Step 3
• Multiply Dx with Dy and determine the value of c, the number of
concurrent deviations or the number of positive signs obtained after
multiplying Dx with Dy.
Step 4
• Then apply the formula
Concurrent Deviation Method
25.
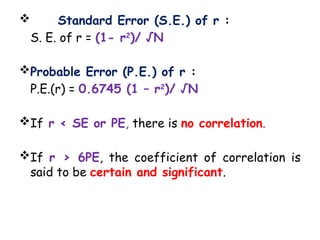
Standard Error(S.E.) of r :
S. E. of r = (1- r2
)/ √N
Probable Error (P.E.) of r :
P.E.(r) = 0.6745 (1 – r2
)/ √N
If r < SE or PE, there is no correlation.
If r > 6PE, the coefficient of correlation is
said to be certain and significant.
26.
Test of significance:
Coefficient of correlation is tested
through t – test at N – 2 d.f.
T- test:
t (N-2)d.f. =
Interpretation : The calculated value
of ‘r’ is compared with tabulated value
of r at 0.05 and 0.01 significant levels
for (n-2) df. Greater calculated r
represents significant correlation.
27.
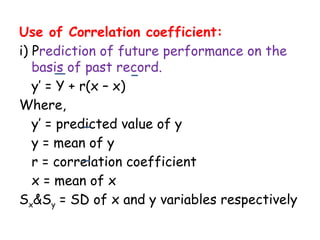
Use of Correlationcoefficient:
i) Prediction of future performance on the
basis of past record.
y’ = Y + r(x – x)
Where,
y’ = predicted value of y
y = mean of y
r = correlation coefficient
x = mean of x
Sx&Sy = SD of x and y variables respectively
28.
2. Measures thedegree of relationship
between two variables (characters).
3. The square of correlation coefficient
between breeding value and phenotypic
value (r2
AP) measures the heritability.
4. It maintains relationship with
regression.
byx = rxy&
bxy = rxy
29.
Exercise no. 3.One cow yielded 3000kg
milk in her first lactation. Predict how
much milk she will give in her second
lactation on the basis of following
information.
1st
lactation milk yield(X) =
3000 kg
2nd
lactation milk yield = Y
X = 2200 kg Y = 2500 kg rXY = 0.80
SD (X) = 150 kg SD (Y) = 160 kg