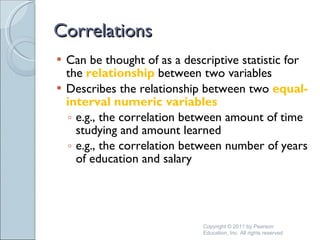
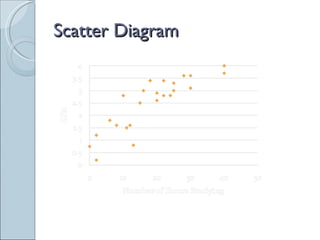
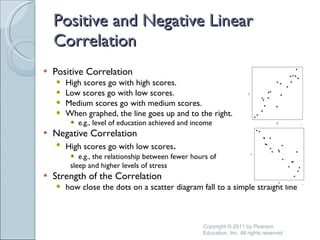
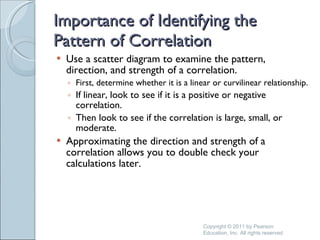
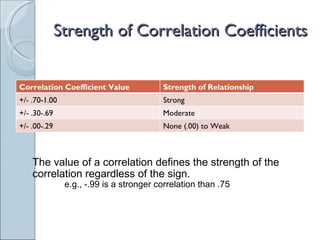
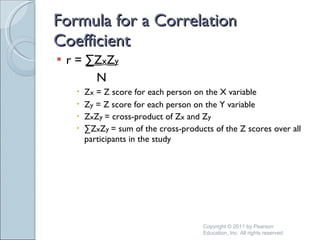
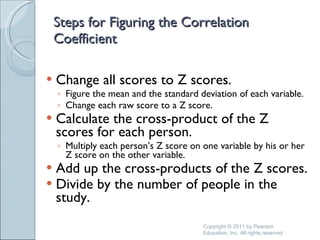
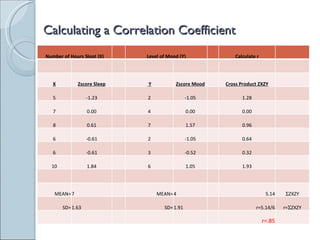
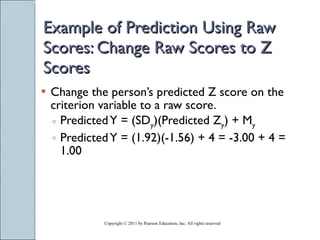
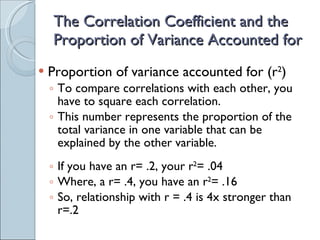
Aron, Coups, & Aron  Chapter 3 Correlation and Prediction Copyright © 2011 by Pearson Education, Inc. All rights reserved
Correlations Can be thought of as a descriptive statistic for the  relationship  between two variables Describes the relationship between two  equal-interval numeric variables e.g., the correlation between amount of time studying and amount learned  e.g., the correlation between number of years of education and salary Copyright © 2011 by Pearson Education, Inc. All rights reserved
Scatter Diagram
Graphing a Scatter Diagram To make a scatter diagram: Draw the axes and decide which variable goes on which axis. The values of one variable go along the horizontal axis and the values of the other variable go along the vertical axis. Determine the range of values to use for each variable and mark them on the axes. Numbers should go from low to high on each axis starting from where the axes meet . Usually your low value on each axis is 0. Each axis should continue to the highest value your measure can possibly have. Make a dot for each pair of scores. Find the place on the horizontal axis for the first pair of scores on the horizontal-axis variable. Move up to the height for the score for the first pair of scores on the vertical-axis variable and mark a clear dot. Keep going until you have marked a dot for each person. Copyright © 2011 by Pearson Education, Inc. All rights reserved
Linear Correlation A linear correlation relationship between two variables that shows up on a scatter diagram as dots roughly approximating a straight line
Curvilinear Correlation Curvilinear correlation any association between two variables other than a linear correlation relationship between two variables that shows up on a scatter diagram as dots following a systematic pattern that is not a straight line
No Correlation No correlation no systematic relationship between two variables Copyright © 2011 by Pearson Education, Inc. All rights reserved
Positive and Negative Linear Correlation Positive Correlation High scores go with high scores. Low scores go with low scores. Medium scores go with medium scores. When graphed, the line goes up and to the right. e.g., level of education achieved and income  Negative Correlation High scores go with low scores .  e.g., the relationship between fewer hours of  sleep and higher levels of stress Strength of the Correlation how close the dots on a scatter diagram fall to a simple straight line Copyright © 2011 by Pearson Education, Inc. All rights reserved
Importance of Identifying the Pattern of Correlation Use a scatter diagram to examine the pattern, direction, and strength of a correlation. First, determine whether it is a linear or curvilinear relationship. If linear, look to see if it is a positive or negative correlation. Then look to see if the correlation is large, small, or moderate. Approximating the direction and strength of a correlation allows you to double check your calculations later. Copyright © 2011 by Pearson Education, Inc. All rights reserved
The Correlation Coefficient A number that gives the exact correlation between two variables can tell you both  direction  and  strength  of relationship between two variables (X and Y) uses Z scores to compare scores on different variables Copyright © 2011 by Pearson Education, Inc. All rights reserved
The Correlation Coefficient  ( r ) The sign of r (Pearson correlation coefficient) tells the general trend of a relationship between two variables. + sign means the correlation is positive. - sign means the correlation is negative. The value of r ranges from -1 to 1. A correlation of 1 or -1 means that the variables are perfectly correlated. 0 = no correlation
Strength of Correlation Coefficients The value of a correlation defines the strength of the correlation regardless of the sign. e.g., -.99 is a stronger correlation than .75 Correlation Coefficient Value Strength of Relationship +/- .70-1.00 Strong +/- .30-.69 Moderate +/- .00-.29 None (.00) to Weak
Formula for a Correlation Coefficient r =  ∑Z x Z y   N Z x  = Z score for each person on the X variable Z y  = Z score for each person on the Y variable Z x Z y  = cross-product of Z x  and Z y  ∑ Z x Z y  = sum of the cross-products of the Z scores over all participants in the study   Copyright © 2011 by Pearson Education, Inc. All rights reserved
Steps for Figuring the Correlation Coefficient Change all scores to Z scores. Figure the mean and the standard deviation of each variable. Change each raw score to a Z score. Calculate the cross-product of the Z scores for each person. Multiply each person’s Z score on one variable by his or her Z score on the other variable. Add up the cross-products of the Z scores. Divide by the number of people in the study. Copyright © 2011 by Pearson Education, Inc. All rights reserved
Calculating a Correlation Coefficient Number of Hours Slept (X) Level of Mood (Y) Calculate r X Zscore Sleep Y Zscore Mood Cross Product ZXZY 5 -1.23 2 -1.05 1.28 7 0.00 4 0.00 0.00 8 0.61 7 1.57 0.96 6 -0.61 2 -1.05 0.64 6 -0.61 3 -0.52 0.32 10 1.84 6 1.05 1.93 MEAN= 7 MEAN= 4 5.14  ZXZY SD= 1.63 SD= 1.91 r=5.14/6 r=  ZXZY r=.85
Issues in Interpreting the Correlation Coefficient Direction of causality path of causal effect (e.g., X causes Y) You cannot determine the direction of causality just because two variables are correlated. Copyright © 2011 by Pearson Education, Inc. All rights reserved
Reasons Why We cannot Assume Causality Variable X causes variable Y. e.g., less sleep causes more stress  Variable Y causes variable X. e.g., more stress causes people to sleep less There is a third variable that causes both variable X and variable Y. e.g., working longer hours causes both stress and fewer hours of sleep Copyright © 2011 by Pearson Education, Inc. All rights reserved
Ruling Out Some Possible Directions of Causality Longitudinal Study a study where people are measured at two or more points in time e.g., evaluating number of hours of sleep at one time point and then evaluating their levels of stress at a later time point True Experiment a study in which participants are randomly assigned to a particular level of a variable and then measured on another variable e.g., exposing individuals to varying amounts of sleep in a laboratory environment and then evaluating their stress levels  Copyright © 2011 by Pearson Education, Inc. All rights reserved
The Statistical Significance of a Correlation Coefficient A correlation is statistically significant if it is unlikely that you could have gotten a correlation as big as you did if in fact there was no relationship between variables. If the probability  (p)  is less than some small degree of probability (e.g., 5% or 1%), the correlation is considered statistically significant.
Prediction Predictor Variable (X) variable being predicted from e.g., level of education achieved Criterion Variable (Y) variable being predicted to e.g., income If we expect level of education to predict income, the  predictor  variable would be level of education and the  criterion  variable would be income. Copyright © 2011 by Pearson Education, Inc. All rights reserved
Prediction Using Z Scores Prediction Model A person’s predicted Z score on the criterion variable is found by multiplying the standardized regression coefficient (  ) by that person’s Z score on the predictor variable. Formula for the prediction model using Z scores: Predicted Z y  = (  )(Z x )  Predicted Z y = predicted value of the particular person’s Z score on the criterion variable Y Z x =  particular person’s Z score in the predictor variable X Copyright © 2011 by Pearson Education, Inc. All rights reserved
Steps for Prediction Using Z Scores Determine the standardized regression coefficient (  ). Multiply the standardized regression coefficient (  ) by the person’s Z score on the predictor variable. Copyright © 2011 by Pearson Education, Inc. All rights reserved
 
How Are You Doing? So, let’s say that we want to try to predict a person’s oral presentation score based on a known relationship between self-confidence and presentation ability.  Which is the predictor variable (Zx)?  The criterion variable (Zy)? If r = .90 and Z x  = 2.25 then Z y  = ? So what?  What does this predicted value tell us? Copyright © 2011 by Pearson Education, Inc. All rights reserved
Prediction Using Raw Scores Change the person’s raw score on the predictor variable to a Z score. Multiply the standardized regression coefficient (  ) by the person’s Z score on the predictor variable. Multiply    by Z x. This gives the predicted Z score on the criterion variable. Predicted Z y  = (  )(Z x ) Change the person’s predicted Z score on the criterion variable back to a raw score. Predicted Y = (SD y )(Predicted Z y ) + M y Copyright © 2011 by Pearson Education, Inc. All rights reserved
Example of Prediction Using Raw Scores: Change Raw Scores to Z Scores From the sleep and mood study example, we known the mean for sleep is 7 and the standard deviation is 1.63, and that the mean for happy mood is 4 and the standard deviation is 1.92.  The correlation between sleep and mood is .85. Change the person’s raw score on the predictor variable to a Z score. Z x  = (X - M x ) / SD x (4-7) / 1.63 = -3 / 1.63 = -1.84 Copyright © 2011 by Pearson Education, Inc. All rights reserved
Example of Prediction Using Raw Scores: Find the Predicted Z Score on the Criterion Variable Multiply the standardized regression coefficient (  ) by the person’s Z score on the predictor variable. Multiply    by Zx. This gives the predicted Z score on the criterion variable. Predicted Z y  = (  )(Z x ) = (.85)(-1.84) = -1.56 Copyright © 2011 by Pearson Education, Inc. All rights reserved
Example of Prediction Using Raw Scores: Change Raw Scores to Z Scores Change the person’s predicted Z score on the criterion variable to a raw score. Predicted Y = (SD y )(Predicted Z y ) + M y Predicted Y = (1.92)(-1.56) + 4 = -3.00 + 4 = 1.00 Copyright © 2011 by Pearson Education, Inc. All rights reserved
The Correlation Coefficient and the Proportion of Variance Accounted for Proportion of variance accounted for (r 2 ) To compare correlations with each other, you have to square each correlation. This number represents the proportion of the total variance in one variable that can be explained by the other variable. If you have an r= .2, your r 2 = .04 Where, a r= .4, you have an r 2 = .16  So, relationship with r = .4 is 4x stronger than r=.2

Aron chpt 3 correlation compatability version f2011

  • 1.
    Aron, Coups, &Aron Chapter 3 Correlation and Prediction Copyright © 2011 by Pearson Education, Inc. All rights reserved
  • 2.
    Correlations Can bethought of as a descriptive statistic for the relationship between two variables Describes the relationship between two equal-interval numeric variables e.g., the correlation between amount of time studying and amount learned e.g., the correlation between number of years of education and salary Copyright © 2011 by Pearson Education, Inc. All rights reserved
  • 3.
  • 4.
    Graphing a ScatterDiagram To make a scatter diagram: Draw the axes and decide which variable goes on which axis. The values of one variable go along the horizontal axis and the values of the other variable go along the vertical axis. Determine the range of values to use for each variable and mark them on the axes. Numbers should go from low to high on each axis starting from where the axes meet . Usually your low value on each axis is 0. Each axis should continue to the highest value your measure can possibly have. Make a dot for each pair of scores. Find the place on the horizontal axis for the first pair of scores on the horizontal-axis variable. Move up to the height for the score for the first pair of scores on the vertical-axis variable and mark a clear dot. Keep going until you have marked a dot for each person. Copyright © 2011 by Pearson Education, Inc. All rights reserved
  • 5.
    Linear Correlation Alinear correlation relationship between two variables that shows up on a scatter diagram as dots roughly approximating a straight line
  • 6.
    Curvilinear Correlation Curvilinearcorrelation any association between two variables other than a linear correlation relationship between two variables that shows up on a scatter diagram as dots following a systematic pattern that is not a straight line
  • 7.
    No Correlation Nocorrelation no systematic relationship between two variables Copyright © 2011 by Pearson Education, Inc. All rights reserved
  • 8.
    Positive and NegativeLinear Correlation Positive Correlation High scores go with high scores. Low scores go with low scores. Medium scores go with medium scores. When graphed, the line goes up and to the right. e.g., level of education achieved and income Negative Correlation High scores go with low scores . e.g., the relationship between fewer hours of sleep and higher levels of stress Strength of the Correlation how close the dots on a scatter diagram fall to a simple straight line Copyright © 2011 by Pearson Education, Inc. All rights reserved
  • 9.
    Importance of Identifyingthe Pattern of Correlation Use a scatter diagram to examine the pattern, direction, and strength of a correlation. First, determine whether it is a linear or curvilinear relationship. If linear, look to see if it is a positive or negative correlation. Then look to see if the correlation is large, small, or moderate. Approximating the direction and strength of a correlation allows you to double check your calculations later. Copyright © 2011 by Pearson Education, Inc. All rights reserved
  • 10.
    The Correlation CoefficientA number that gives the exact correlation between two variables can tell you both direction and strength of relationship between two variables (X and Y) uses Z scores to compare scores on different variables Copyright © 2011 by Pearson Education, Inc. All rights reserved
  • 11.
    The Correlation Coefficient ( r ) The sign of r (Pearson correlation coefficient) tells the general trend of a relationship between two variables. + sign means the correlation is positive. - sign means the correlation is negative. The value of r ranges from -1 to 1. A correlation of 1 or -1 means that the variables are perfectly correlated. 0 = no correlation
  • 12.
    Strength of CorrelationCoefficients The value of a correlation defines the strength of the correlation regardless of the sign. e.g., -.99 is a stronger correlation than .75 Correlation Coefficient Value Strength of Relationship +/- .70-1.00 Strong +/- .30-.69 Moderate +/- .00-.29 None (.00) to Weak
  • 13.
    Formula for aCorrelation Coefficient r = ∑Z x Z y N Z x = Z score for each person on the X variable Z y = Z score for each person on the Y variable Z x Z y = cross-product of Z x and Z y ∑ Z x Z y = sum of the cross-products of the Z scores over all participants in the study Copyright © 2011 by Pearson Education, Inc. All rights reserved
  • 14.
    Steps for Figuringthe Correlation Coefficient Change all scores to Z scores. Figure the mean and the standard deviation of each variable. Change each raw score to a Z score. Calculate the cross-product of the Z scores for each person. Multiply each person’s Z score on one variable by his or her Z score on the other variable. Add up the cross-products of the Z scores. Divide by the number of people in the study. Copyright © 2011 by Pearson Education, Inc. All rights reserved
  • 15.
    Calculating a CorrelationCoefficient Number of Hours Slept (X) Level of Mood (Y) Calculate r X Zscore Sleep Y Zscore Mood Cross Product ZXZY 5 -1.23 2 -1.05 1.28 7 0.00 4 0.00 0.00 8 0.61 7 1.57 0.96 6 -0.61 2 -1.05 0.64 6 -0.61 3 -0.52 0.32 10 1.84 6 1.05 1.93 MEAN= 7 MEAN= 4 5.14  ZXZY SD= 1.63 SD= 1.91 r=5.14/6 r=  ZXZY r=.85
  • 16.
    Issues in Interpretingthe Correlation Coefficient Direction of causality path of causal effect (e.g., X causes Y) You cannot determine the direction of causality just because two variables are correlated. Copyright © 2011 by Pearson Education, Inc. All rights reserved
  • 17.
    Reasons Why Wecannot Assume Causality Variable X causes variable Y. e.g., less sleep causes more stress Variable Y causes variable X. e.g., more stress causes people to sleep less There is a third variable that causes both variable X and variable Y. e.g., working longer hours causes both stress and fewer hours of sleep Copyright © 2011 by Pearson Education, Inc. All rights reserved
  • 18.
    Ruling Out SomePossible Directions of Causality Longitudinal Study a study where people are measured at two or more points in time e.g., evaluating number of hours of sleep at one time point and then evaluating their levels of stress at a later time point True Experiment a study in which participants are randomly assigned to a particular level of a variable and then measured on another variable e.g., exposing individuals to varying amounts of sleep in a laboratory environment and then evaluating their stress levels Copyright © 2011 by Pearson Education, Inc. All rights reserved
  • 19.
    The Statistical Significanceof a Correlation Coefficient A correlation is statistically significant if it is unlikely that you could have gotten a correlation as big as you did if in fact there was no relationship between variables. If the probability (p) is less than some small degree of probability (e.g., 5% or 1%), the correlation is considered statistically significant.
  • 20.
    Prediction Predictor Variable(X) variable being predicted from e.g., level of education achieved Criterion Variable (Y) variable being predicted to e.g., income If we expect level of education to predict income, the predictor variable would be level of education and the criterion variable would be income. Copyright © 2011 by Pearson Education, Inc. All rights reserved
  • 21.
    Prediction Using ZScores Prediction Model A person’s predicted Z score on the criterion variable is found by multiplying the standardized regression coefficient (  ) by that person’s Z score on the predictor variable. Formula for the prediction model using Z scores: Predicted Z y = (  )(Z x ) Predicted Z y = predicted value of the particular person’s Z score on the criterion variable Y Z x = particular person’s Z score in the predictor variable X Copyright © 2011 by Pearson Education, Inc. All rights reserved
  • 22.
    Steps for PredictionUsing Z Scores Determine the standardized regression coefficient (  ). Multiply the standardized regression coefficient (  ) by the person’s Z score on the predictor variable. Copyright © 2011 by Pearson Education, Inc. All rights reserved
  • 23.
  • 24.
    How Are YouDoing? So, let’s say that we want to try to predict a person’s oral presentation score based on a known relationship between self-confidence and presentation ability. Which is the predictor variable (Zx)? The criterion variable (Zy)? If r = .90 and Z x = 2.25 then Z y = ? So what? What does this predicted value tell us? Copyright © 2011 by Pearson Education, Inc. All rights reserved
  • 25.
    Prediction Using RawScores Change the person’s raw score on the predictor variable to a Z score. Multiply the standardized regression coefficient (  ) by the person’s Z score on the predictor variable. Multiply  by Z x. This gives the predicted Z score on the criterion variable. Predicted Z y = (  )(Z x ) Change the person’s predicted Z score on the criterion variable back to a raw score. Predicted Y = (SD y )(Predicted Z y ) + M y Copyright © 2011 by Pearson Education, Inc. All rights reserved
  • 26.
    Example of PredictionUsing Raw Scores: Change Raw Scores to Z Scores From the sleep and mood study example, we known the mean for sleep is 7 and the standard deviation is 1.63, and that the mean for happy mood is 4 and the standard deviation is 1.92. The correlation between sleep and mood is .85. Change the person’s raw score on the predictor variable to a Z score. Z x = (X - M x ) / SD x (4-7) / 1.63 = -3 / 1.63 = -1.84 Copyright © 2011 by Pearson Education, Inc. All rights reserved
  • 27.
    Example of PredictionUsing Raw Scores: Find the Predicted Z Score on the Criterion Variable Multiply the standardized regression coefficient (  ) by the person’s Z score on the predictor variable. Multiply  by Zx. This gives the predicted Z score on the criterion variable. Predicted Z y = (  )(Z x ) = (.85)(-1.84) = -1.56 Copyright © 2011 by Pearson Education, Inc. All rights reserved
  • 28.
    Example of PredictionUsing Raw Scores: Change Raw Scores to Z Scores Change the person’s predicted Z score on the criterion variable to a raw score. Predicted Y = (SD y )(Predicted Z y ) + M y Predicted Y = (1.92)(-1.56) + 4 = -3.00 + 4 = 1.00 Copyright © 2011 by Pearson Education, Inc. All rights reserved
  • 29.
    The Correlation Coefficientand the Proportion of Variance Accounted for Proportion of variance accounted for (r 2 ) To compare correlations with each other, you have to square each correlation. This number represents the proportion of the total variance in one variable that can be explained by the other variable. If you have an r= .2, your r 2 = .04 Where, a r= .4, you have an r 2 = .16 So, relationship with r = .4 is 4x stronger than r=.2