Downloaded 176 times

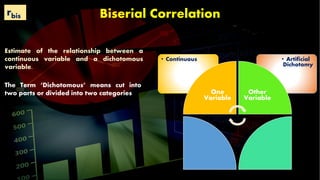
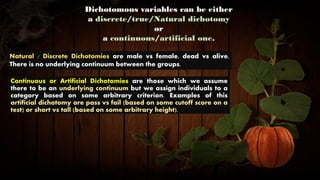


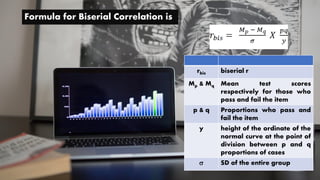


The document discusses biserial correlation, which estimates the relationship between a continuous variable and a dichotomous variable. It distinguishes between true/discrete dichotomies (e.g., male vs female) and artificial dichotomies (e.g., pass vs fail). The formula for calculating biserial correlation is also provided, emphasizing the importance of understanding these types of correlations in educational research.