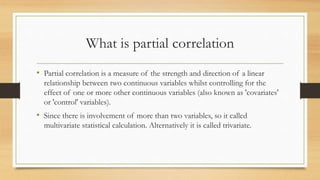
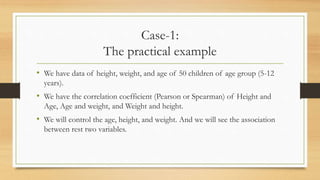
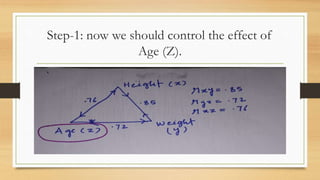
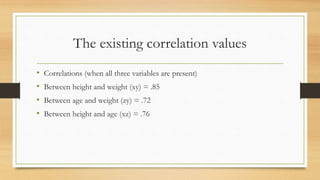
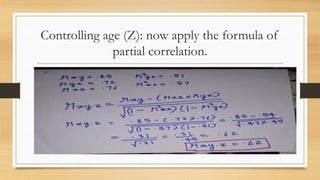
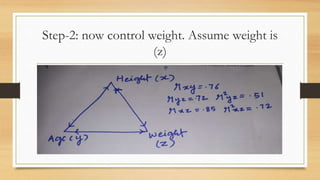
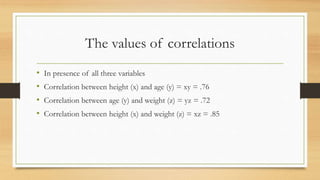
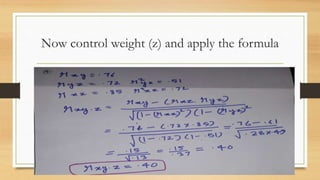
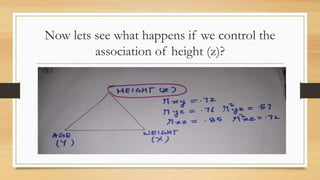
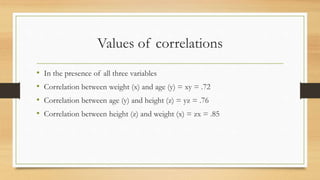
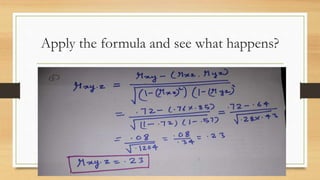
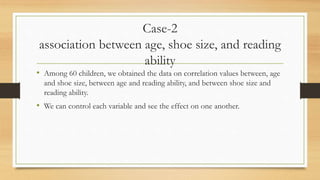
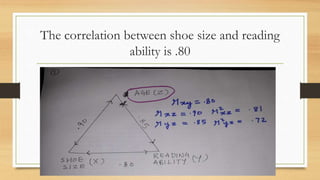
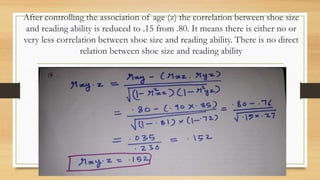
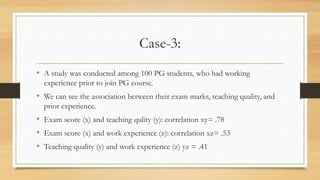
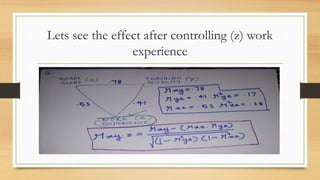
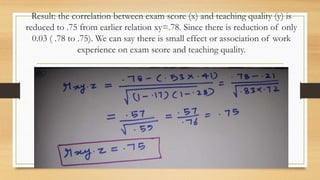
Partial Correlation
Dr. Rajeev Kumar,
M.S.W (TISS, Mumbai), M.Phil. (CIP, Ranchi), UGC-JRF,
Ph.D., (IIT Kharagpur)
What is partial correlation
• Partial correlation is a measure of the strength and direction of a linear
relationship between two continuous variables whilst controlling for the
effect of one or more other continuous variables (also known as 'covariates'
or 'control' variables).
• Since there is involvement of more than two variables, so it called
multivariate statistical calculation. Alternatively it is called trivariate.
Case-1:
The practical example
• We have data of height, weight, and age of 50 children of age group (5-12
years).
• We have the correlation coefficient (Pearson or Spearman) of Height and
Age, Age and weight, and Weight and height.
• We will control the age, height, and weight. And we will see the association
between rest two variables.
Step-1: now we should control the effect of
Age (Z).
The existing correlation values
• Correlations (when all three variables are present)
• Between height and weight (xy) = .85
• Between age and weight (zy) = .72
• Between height and age (xz) = .76
Controlling age (Z): now apply the formula of
partial correlation.
Interpretation: what happened after controlling
effect of age (z)?
• Earlier when all three variables (age, height, and weight) were present
together. Then correlation between height (x) and weight (y): xy= .85
• After controlling the effect of age (z), the correlation between height and
weight = xy is 0.62. after removing the age effect the value of correlation is
decreased from 0.85 to 0.62.
• It means, when age grow, then there is more increase in association between
height and weight. When we remove age, then there is less association
between weight and height.
Step-2: now control weight. Assume weight is
(z)
The values of correlations
• In presence of all three variables
• Correlation between height (x) and age (y) = xy = .76
• Correlation between age (y) and weight (z) = yz = .72
• Correlation between height (x) and weight (z) = xz = .85
Now control weight (z) and apply the formula
What is the result now?
• Earlier in presence of all three variables
• Correlation between height (x) and age (y) = xy = .76
• Now after removing the effect of weight (z), the correlation between height
and age is reduced to 0.40.
• It means there is limited correlation between age and height --- up to age of
16 to 18.
• In presence of weight, this correlation was high (.76).
Now lets see what happens if we control the
association of height (z)?
Values of correlations
• In the presence of all three variables
• Correlation between weight (x) and age (y) = xy = .72
• Correlation between age (y) and height (z) = yz = .76
• Correlation between height (z) and weight (x) = zx = .85
Apply the formula and see what happens?
What does result say?
• Earlier in the presence of all three variables
• Correlation between weight (x) and age (y) = xy = .72
• After removing the association of height (z) the correlation weight (x) and age (y) =
xy is reduced to .23.
• It means in a adolescence age group there is less correlation between age and
weight, if there is no growth in the height.
• The over all result says there is combined effect of age, height, and weight in
adolescence. However, after the age 21, there may be a correlation between age and
weight, when height stops to grow.
Case-2
association between age, shoe size, and reading
ability
• Among 60 children, we obtained the data on correlation values between, age
and shoe size, between age and reading ability, and between shoe size and
reading ability.
• We can control each variable and see the effect on one another.
The correlation between shoe size and reading
ability is .80
After controlling the association of age (z) the correlation between shoe size
and reading ability is reduced to .15 from .80. It means there is either no or
very less correlation between shoe size and reading ability. There is no direct
relation between shoe size and reading ability
Case-3:
• A study was conducted among 100 PG students, who had working
experience prior to join PG course.
• We can see the association between their exam marks, teaching quality, and
prior experience.
• Exam score (x) and teaching qulity (y): correlation xy= .78
• Exam score (x) and work experience (z): correlation xz= .53
• Teaching quality (y) and work experience (z) yz = .41
Lets see the effect after controlling (z) work
experience
Result: the correlation between exam score (x) and teaching quality (y) is
reduced to .75 from earlier relation xy=.78. Since there is reduction of only
0.03 ( .78 to .75). We can say there is small effect or association of work
experience on exam score and teaching quality.
Questions and feedback session
Thanks for your kind
attention
Now we have finished the topic “ correlation”. From next
session onward, we will learn how to measure the difference
between two groups using ‘t’ statistics.

4.7 partial correlation

  • 1.
    Partial Correlation Dr. RajeevKumar, M.S.W (TISS, Mumbai), M.Phil. (CIP, Ranchi), UGC-JRF, Ph.D., (IIT Kharagpur)
  • 2.
    What is partialcorrelation • Partial correlation is a measure of the strength and direction of a linear relationship between two continuous variables whilst controlling for the effect of one or more other continuous variables (also known as 'covariates' or 'control' variables). • Since there is involvement of more than two variables, so it called multivariate statistical calculation. Alternatively it is called trivariate.
  • 3.
    Case-1: The practical example •We have data of height, weight, and age of 50 children of age group (5-12 years). • We have the correlation coefficient (Pearson or Spearman) of Height and Age, Age and weight, and Weight and height. • We will control the age, height, and weight. And we will see the association between rest two variables.
  • 4.
    Step-1: now weshould control the effect of Age (Z).
  • 5.
    The existing correlationvalues • Correlations (when all three variables are present) • Between height and weight (xy) = .85 • Between age and weight (zy) = .72 • Between height and age (xz) = .76
  • 6.
    Controlling age (Z):now apply the formula of partial correlation.
  • 7.
    Interpretation: what happenedafter controlling effect of age (z)? • Earlier when all three variables (age, height, and weight) were present together. Then correlation between height (x) and weight (y): xy= .85 • After controlling the effect of age (z), the correlation between height and weight = xy is 0.62. after removing the age effect the value of correlation is decreased from 0.85 to 0.62. • It means, when age grow, then there is more increase in association between height and weight. When we remove age, then there is less association between weight and height.
  • 8.
    Step-2: now controlweight. Assume weight is (z)
  • 9.
    The values ofcorrelations • In presence of all three variables • Correlation between height (x) and age (y) = xy = .76 • Correlation between age (y) and weight (z) = yz = .72 • Correlation between height (x) and weight (z) = xz = .85
  • 10.
    Now control weight(z) and apply the formula
  • 11.
    What is theresult now? • Earlier in presence of all three variables • Correlation between height (x) and age (y) = xy = .76 • Now after removing the effect of weight (z), the correlation between height and age is reduced to 0.40. • It means there is limited correlation between age and height --- up to age of 16 to 18. • In presence of weight, this correlation was high (.76).
  • 12.
    Now lets seewhat happens if we control the association of height (z)?
  • 13.
    Values of correlations •In the presence of all three variables • Correlation between weight (x) and age (y) = xy = .72 • Correlation between age (y) and height (z) = yz = .76 • Correlation between height (z) and weight (x) = zx = .85
  • 14.
    Apply the formulaand see what happens?
  • 15.
    What does resultsay? • Earlier in the presence of all three variables • Correlation between weight (x) and age (y) = xy = .72 • After removing the association of height (z) the correlation weight (x) and age (y) = xy is reduced to .23. • It means in a adolescence age group there is less correlation between age and weight, if there is no growth in the height. • The over all result says there is combined effect of age, height, and weight in adolescence. However, after the age 21, there may be a correlation between age and weight, when height stops to grow.
  • 16.
    Case-2 association between age,shoe size, and reading ability • Among 60 children, we obtained the data on correlation values between, age and shoe size, between age and reading ability, and between shoe size and reading ability. • We can control each variable and see the effect on one another.
  • 17.
    The correlation betweenshoe size and reading ability is .80
  • 18.
    After controlling theassociation of age (z) the correlation between shoe size and reading ability is reduced to .15 from .80. It means there is either no or very less correlation between shoe size and reading ability. There is no direct relation between shoe size and reading ability
  • 19.
    Case-3: • A studywas conducted among 100 PG students, who had working experience prior to join PG course. • We can see the association between their exam marks, teaching quality, and prior experience. • Exam score (x) and teaching qulity (y): correlation xy= .78 • Exam score (x) and work experience (z): correlation xz= .53 • Teaching quality (y) and work experience (z) yz = .41
  • 20.
    Lets see theeffect after controlling (z) work experience
  • 21.
    Result: the correlationbetween exam score (x) and teaching quality (y) is reduced to .75 from earlier relation xy=.78. Since there is reduction of only 0.03 ( .78 to .75). We can say there is small effect or association of work experience on exam score and teaching quality.
  • 22.
  • 23.
    Thanks for yourkind attention Now we have finished the topic “ correlation”. From next session onward, we will learn how to measure the difference between two groups using ‘t’ statistics.