Downloaded 48 times
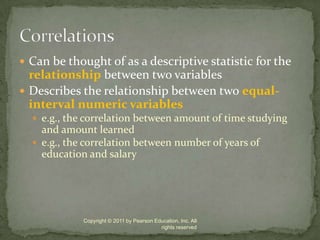
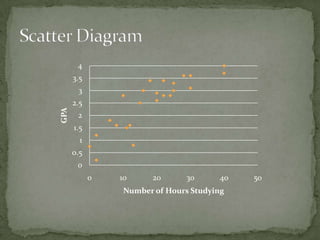
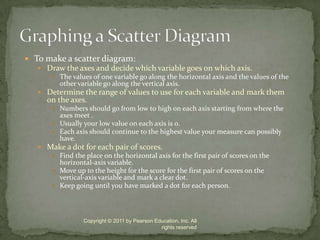
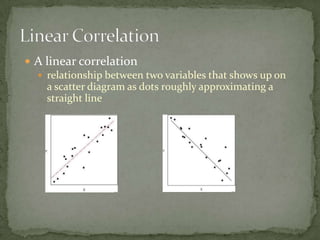
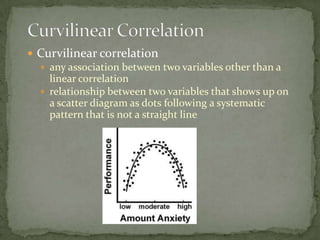
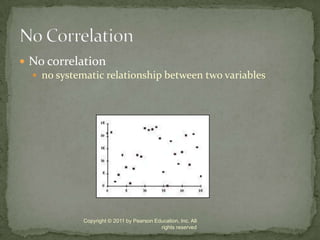
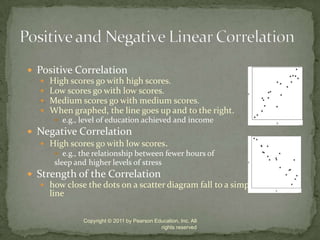
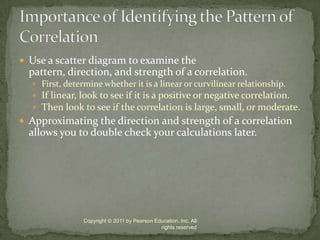
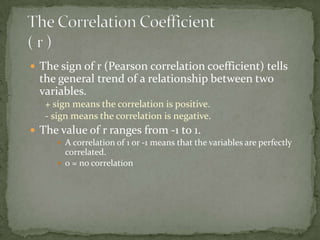
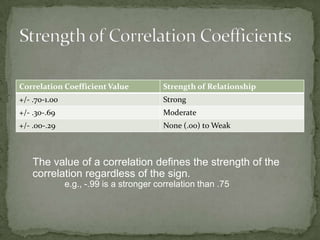
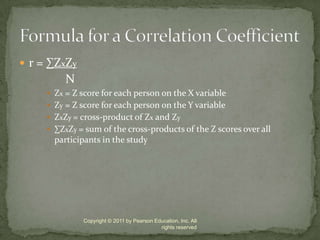
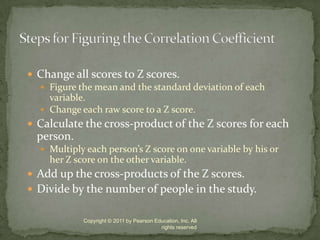
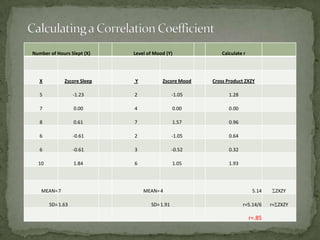
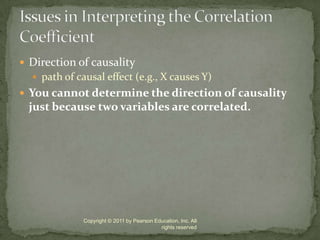
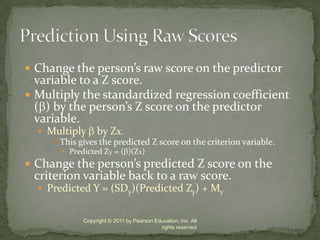
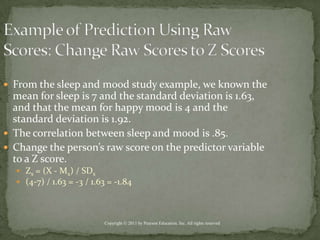
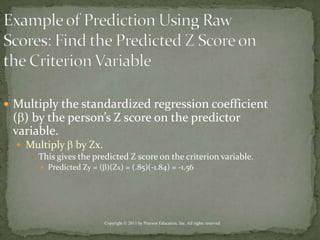
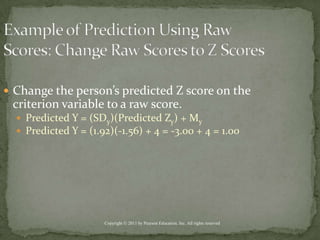

This document discusses correlation and prediction. It defines correlation as describing the relationship between two equal-interval numeric variables. A scatter diagram can be used to examine the pattern, direction, and strength of a correlation by plotting the values of one variable on the x-axis and the other on the y-axis. The correlation coefficient r quantifies the correlation and ranges from -1 to 1, with values farther from 0 indicating a stronger linear correlation. Prediction involves using the correlation between a predictor variable and a criterion variable to estimate values of the criterion variable based on values of the predictor variable.