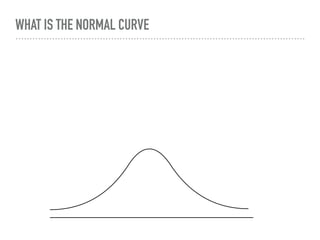
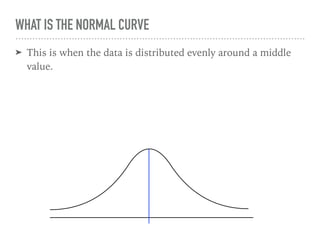
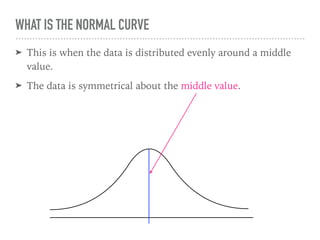
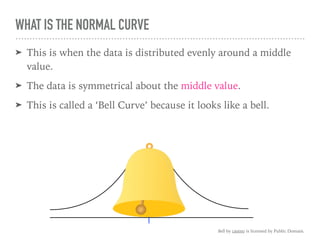
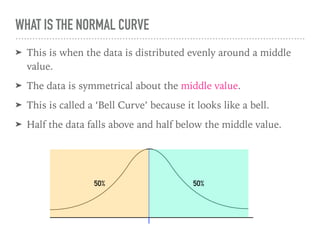
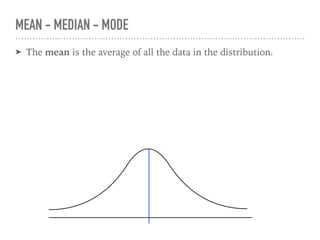
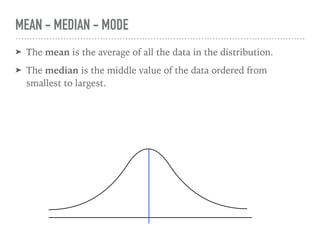
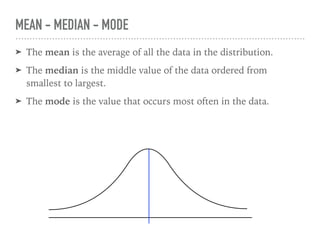
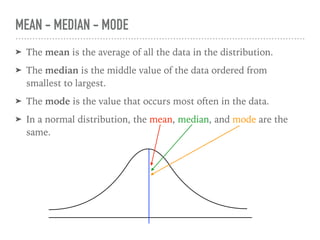
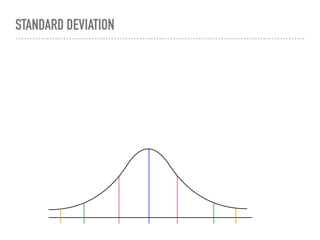
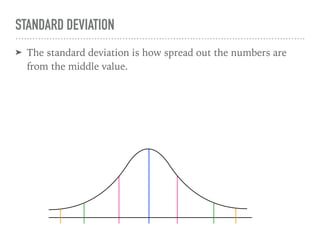
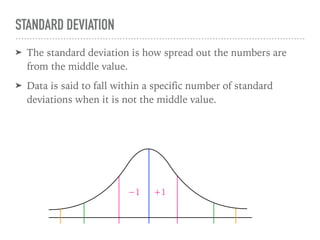
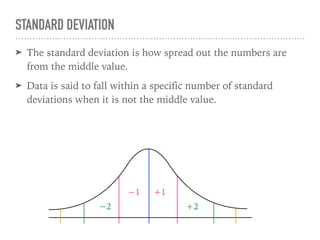
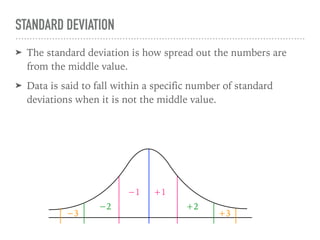
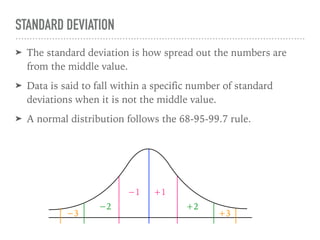
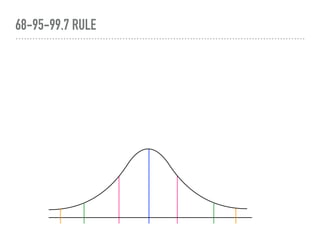
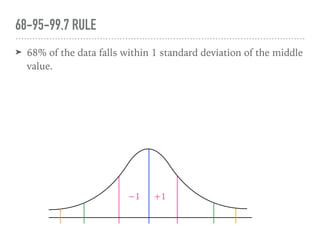
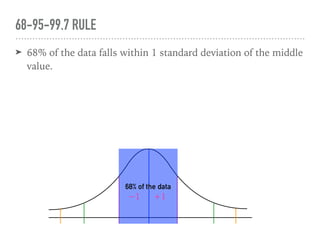
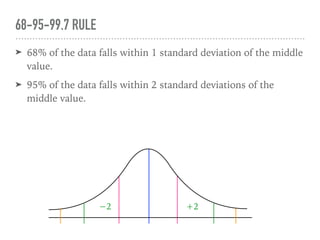
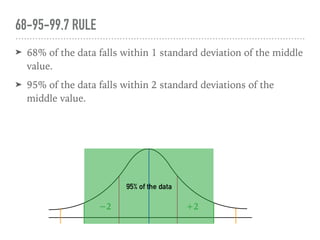
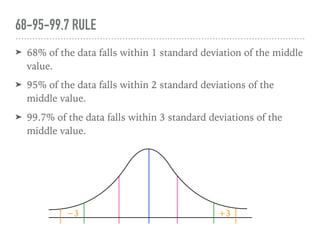
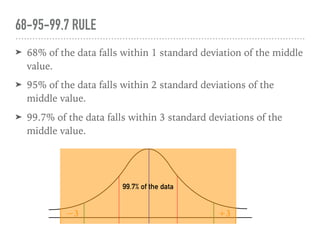
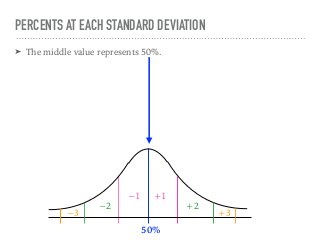
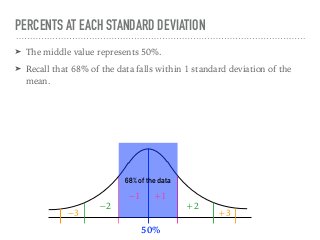
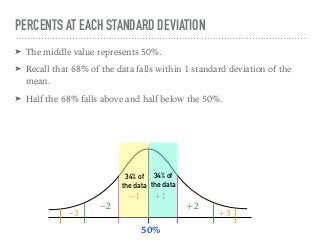
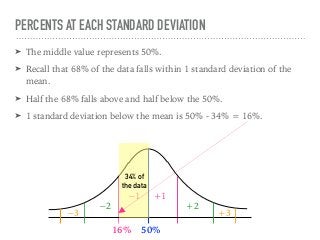
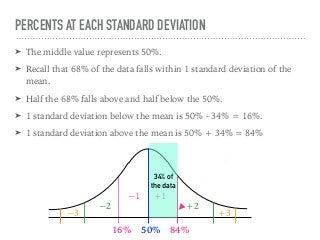
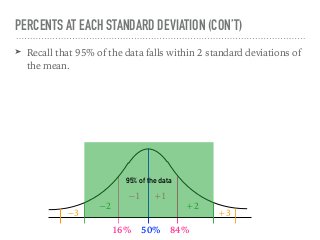
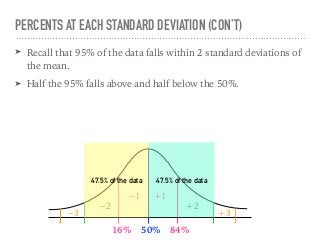
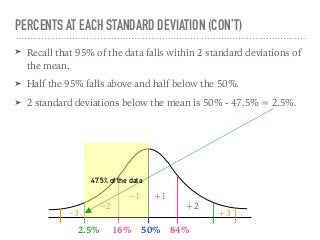
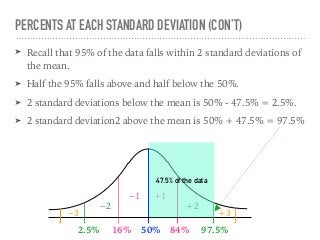
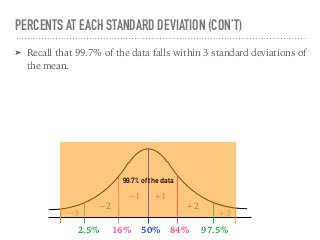
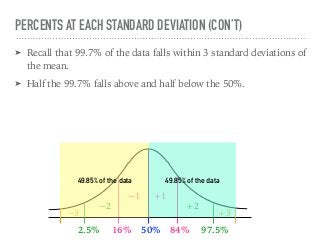
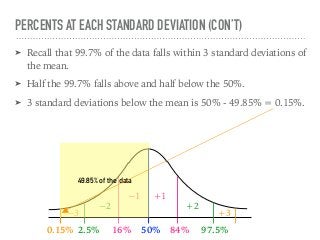
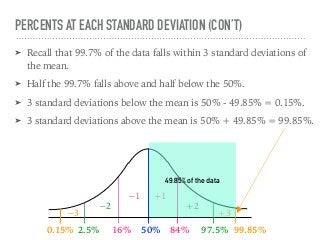
The document discusses the normal curve and its key properties. A normal curve is a bell-shaped distribution that is symmetrical around the mean value, with half of the data falling above and half below the mean. The standard deviation measures how spread out the data is from the mean. In a normal distribution, 68% of the data lies within 1 standard deviation of the mean, 95% within 2 standard deviations, and 99.7% within 3 standard deviations, following the 68-95-99.7 rule.