Downloaded 141 times


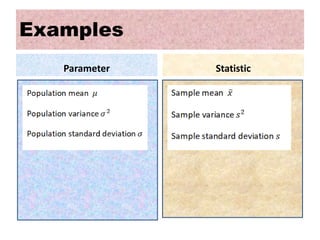


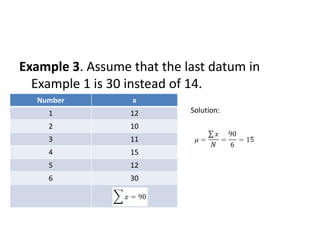


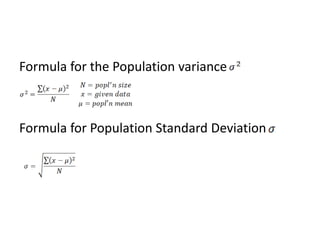


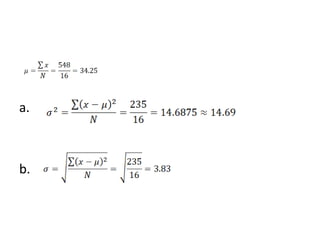


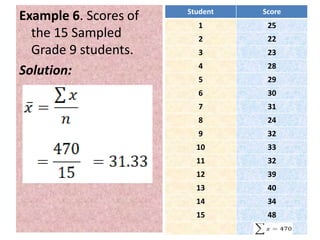

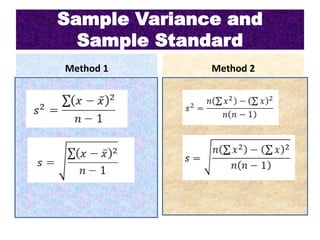
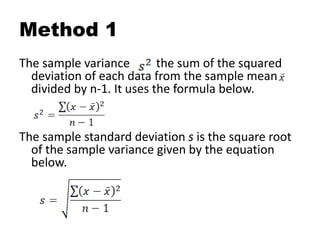
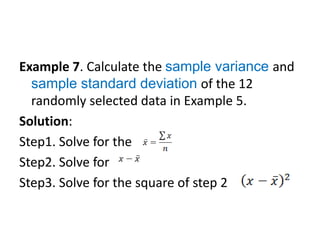


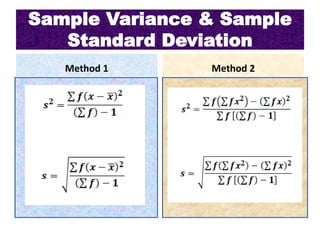


The document explains the concepts of parameters and statistics, highlighting their definitions and differences. It provides examples related to calculating population means, variances, standard deviations, sample means, sample variances, and standard deviations using both raw data and frequency distribution tables. Additionally, it includes numerous examples to illustrate these statistical methods and their application.