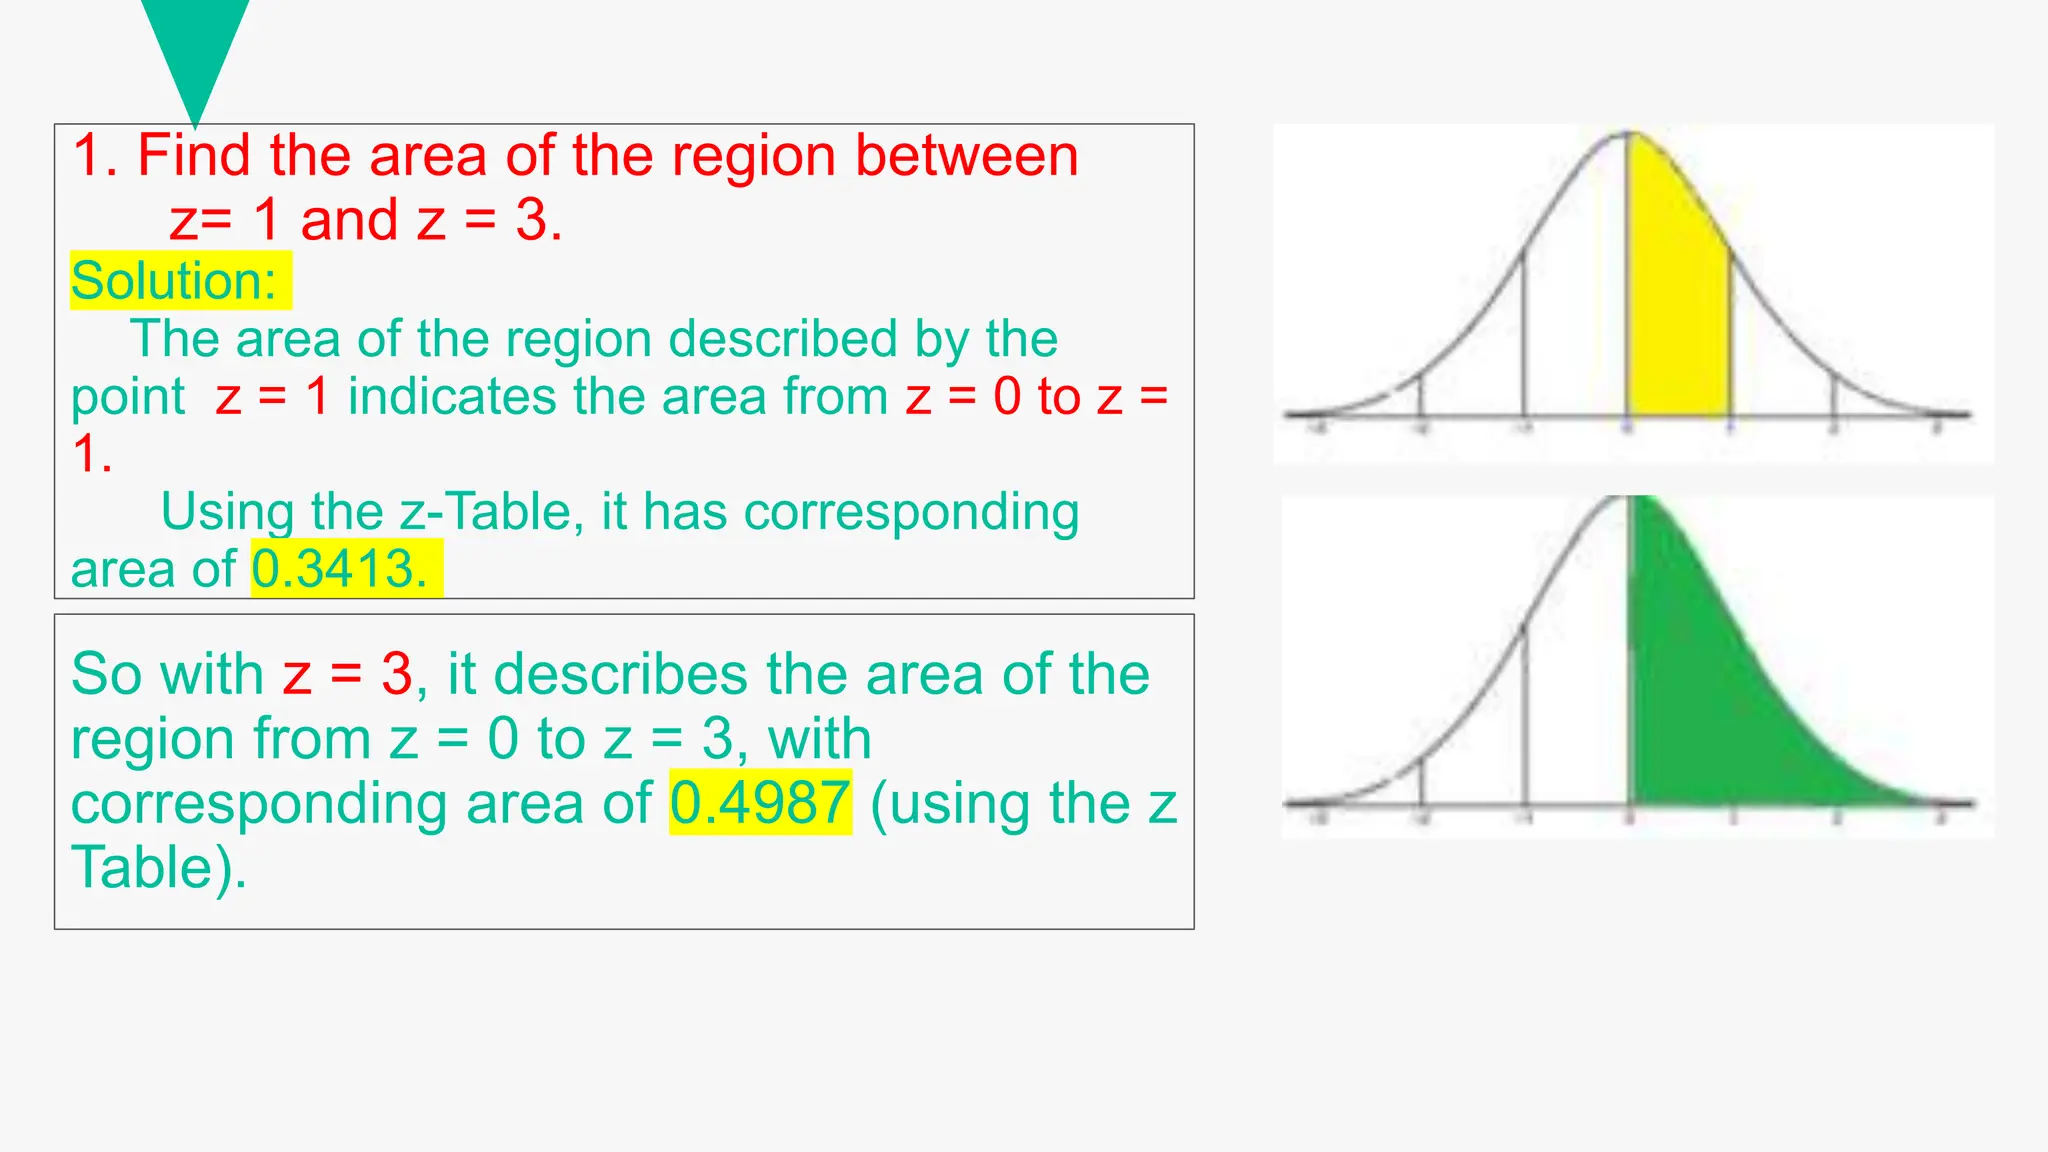
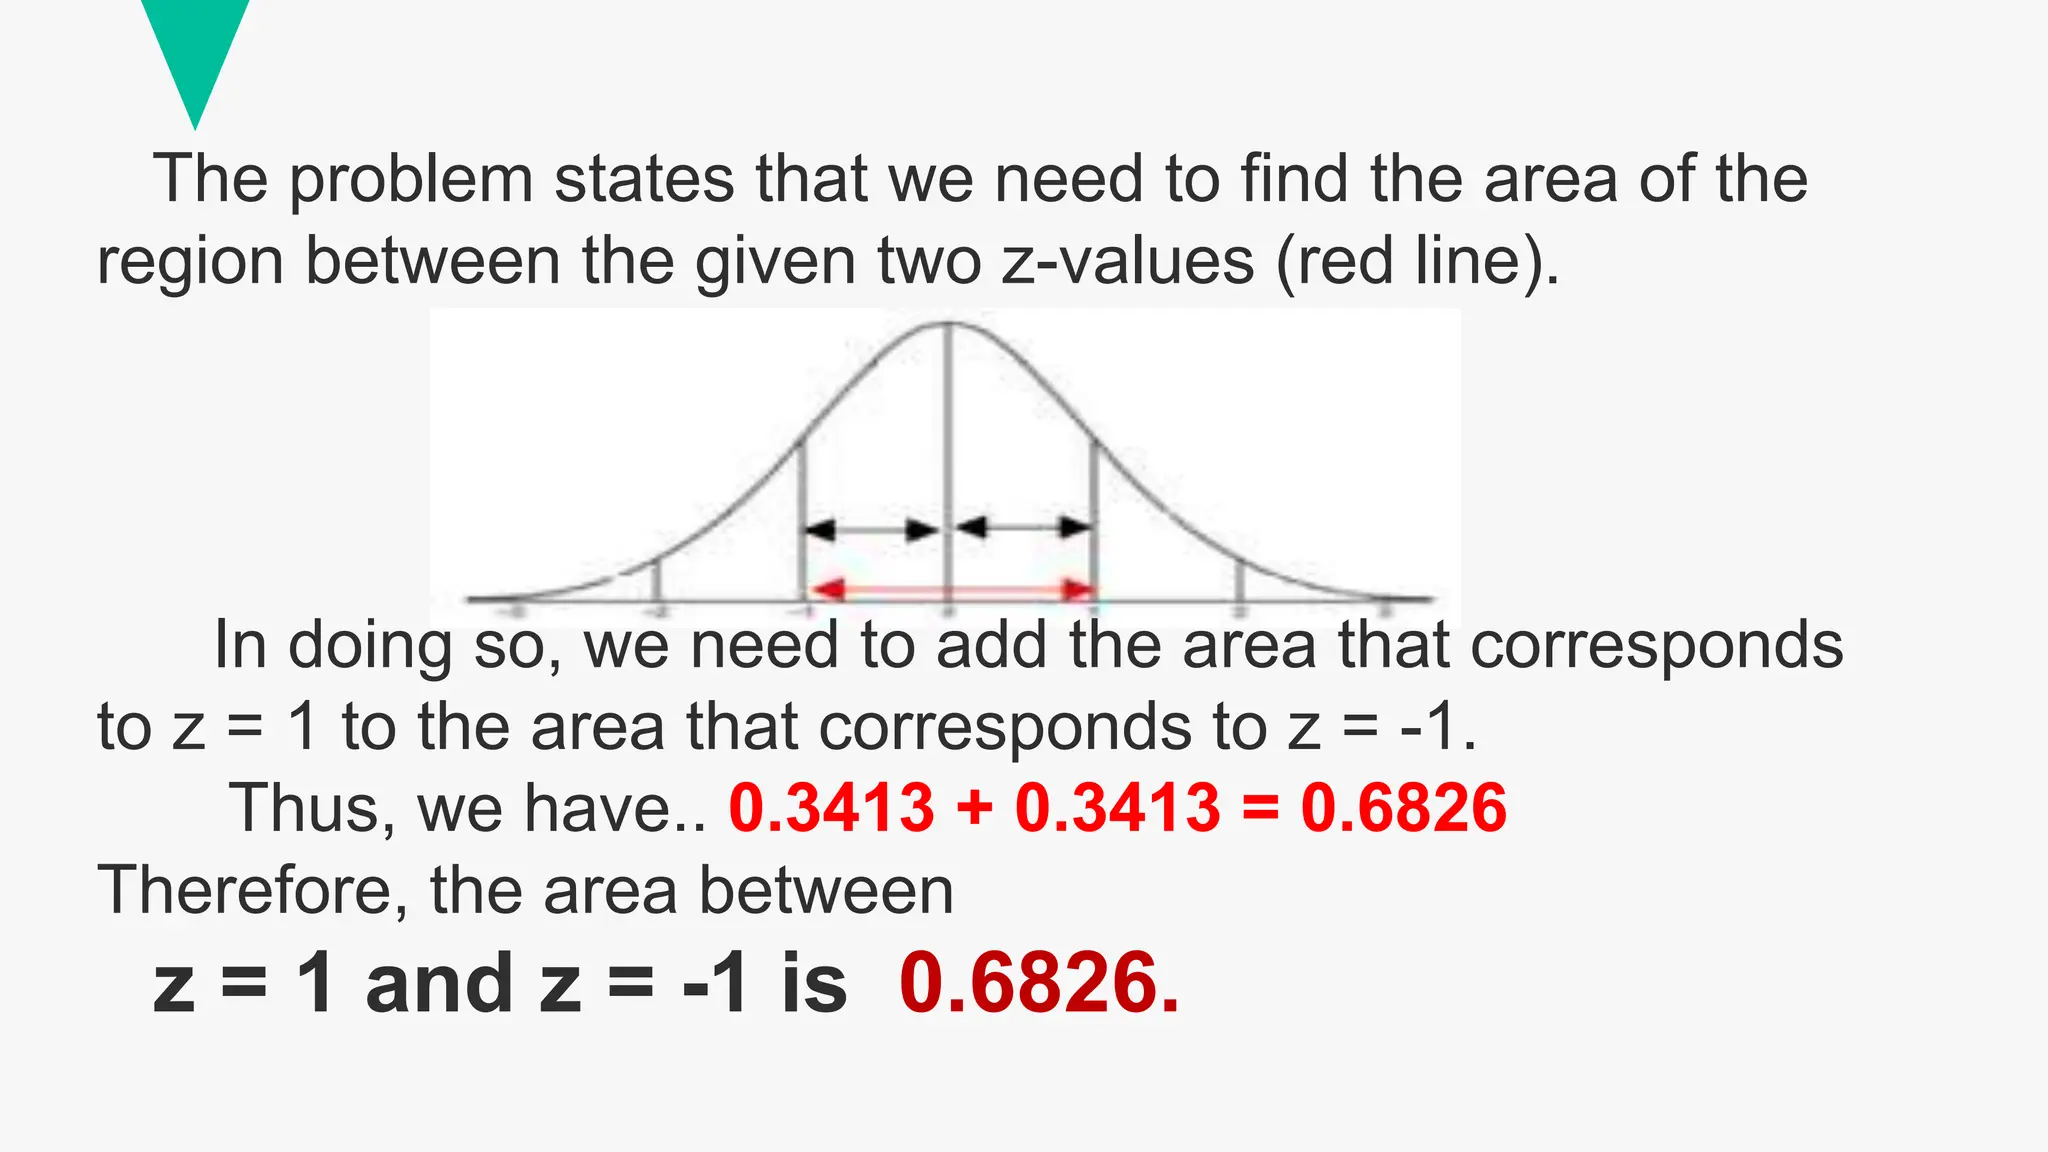
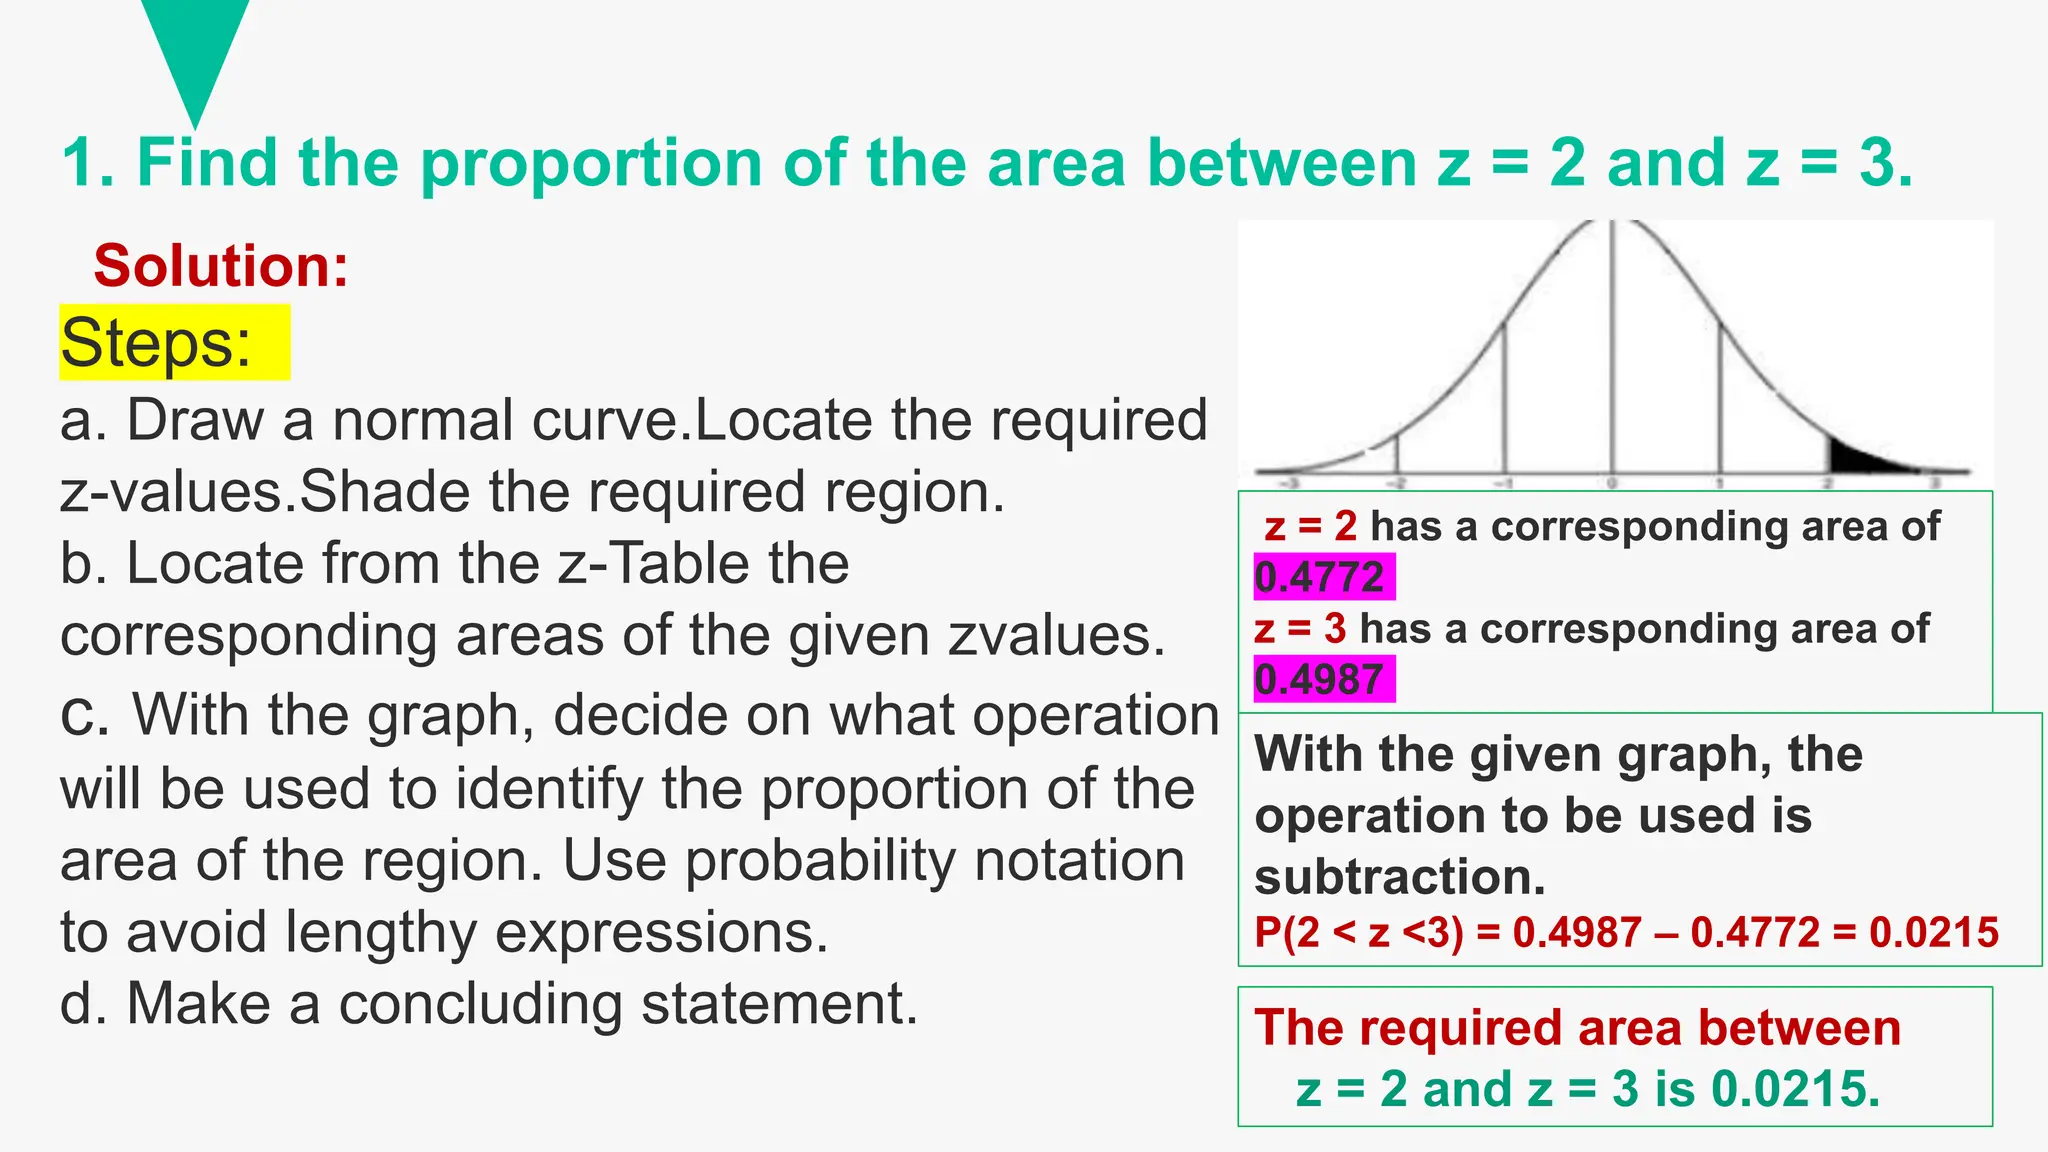
Normal Distribution
Understanding the Normal
Curve Distribution
Objective:
•Illustrate a normal random variable and its
characteristics;
•Construct a normal curve;
• Identify regions under the normal curve;
•Convert a normal random variable to a standard
normal variable and vice versa;
•Compute probabilities and percentiles using the
standard normal table.
1. Probability is the value greater than or equal o zero but less than
or equal to one.
2. Discrete variables are the infinite numerical values like heights,
weights, distance, and lenght.
3. 34% is equal to 0.34.
4. Mean,mode and standard deviation are the measures o central
tendency.
5. Mean is equal to the summation of scores divide by the number of
cases.
Determine wether the following statement is true or
false.
True
True
True
False
False
Normal Distribution
 It is a probability distribution of continuous
random variables.
 The graph of the normal distribution
depends on two factors: the mean µ, and
the standard deviation σ.
 In fact, the mean and standard deviation
characterize the whole distribution. That is,
we can get areas under the normal curve
given information about the mean and
standard deviation.
 The mean determines the location of the
center of the bell -shaped curve. Thus, a
change in the value of the mean shifts the
graph of the normal curve to the right or to
the left.
 (a) the mean represents the balancing point of the graph of
the distribution; (b) the mode represents the “high point” of the
probability density function (i.e. the graph of the distribution),
(c) the median represents the point where 50% of the area
under the distribution is to the left and 50% of the area under
the distribution is to the right.
• For symmetric distributions with a single peak, such as the
normal curve, take note that;Mean = Median = Mode.
• The standard deviation determines the shape of the graphs
(particularly, the height and width of the curve).
• When the standard deviation is large, the normal curve is
short and wide, while a small value for the standard deviation
yields a skinnier and taller graph.
The curve above on the left, is shorter and wider than the curve on
the right, because the curve on the left has a bigger standard
deviation.
Note, that a normal curve is symmetric about its mean and is more
concentrated in the middle rather than in the tails.
If a distribution contains a very large number of
cases with equal measures of central tendency
values, then the distribution is symmetrical* and
the skewness* is 0. In statistics, it is called
normal distribution or normal curve (Rene,
et al. 2015).In specific sense, it is called a normal
probability distribution whenever the frequencies
are converted to probabilities.
The properties of a normal probability
distribution:
1. The curve of the distribution is a bell-shaped.
2. The curve is symmetrical about the mean.
3. The mean, median and mode coincide at the
center.
4.The width of the curve is determined by the
standard deviation of the distribution.
5. The tails of the curve are plotted in both
directions and flatten out indefinitely along the
horizontal axis.
6. The total area under a normal curve is 1.
Take note that every normal curve (regardless of its
mean or standard deviation) conforms to the following
"empirical rule" (also called the 68-95-99.7 rule):
• About 68% of the area under
the curve falls within 1
standard deviation of the
mean.
• About 95% of the area under
the curve falls within 2
standard deviations of the
mean.
• Nearly the entire distribution
(About 99.7% of the area under
the curve) falls within 3
standard deviations of the
Example:
Consider the following data pertaining to
hospital weights (in pounds) of all the 36 babies that
were born in the maternity ward of a certain hospital.
The data have an average of 6.11 pounds and a standard
deviation of 1.61 pounds.
Consider the following data pertaining to hospital
weights (in pounds) of all the 36 babies that were born in the
maternity ward of a certain hospital.
The data have an average of 6.11 pounds and a standard deviation of 1.61 pounds.
Validating the Empirical Rule
Determine what frequency and relative frequency of babies’
weights that are within:
a) One standard deviation from the mean
b) Two standard deviations from the mean
c) Three standard deviations from the mean
Solution:
a) To find the frequencies and relative frequency within/under
1 standard deviation, we need to add 1 standard deviation
from the mean and subtract 1 standard deviation from the
mean to identify the range/area under 1 standard deviation.
𝜇 = 6.11 & 𝜎 = 1.61
Range: 𝜇 − 𝜎 < 𝑥 < 𝜇 + 𝜎
6.11 − 1.61 < 𝑥 < 6.11 + 1.61
4.5 < 𝑥 < 7.72
How many weights of babies in bold face that are
within/under 1 standard deviation from 4.5 lbs. to
7.72 lbs?
These are the weights of babies in bold face that are
within/under 1 standard deviation from 4.5 lbs. to 7.72 lbs.
Therefore, there are 26 babies out of 36 babies or about
72% of the babies are within 1 standard deviation from the
mean.
b) To find the frequencies and relative frequency
within/under 2 standard deviation, we need to add 2
standard deviation from the mean and subtract 2 standard
deviation from the mean to identify the range/area under 2
standard deviation.
Range: 𝜇 − 2𝜎 < 𝑥 < 𝜇 + 2𝜎
6.11 − 2(1.61) < 𝑥 < 6.11 + 2(1.61)
6.11 − 3.22 < 𝑥 < 6.11 + 3.22
2.89 < 𝑥 < 9.33
 These are the weights of babies in bold face that
are within/under 2 standard deviation from 2.89 lbs. to
9.33 lbs.
Therefore, there are 34 babies out of 36 babies
or about 94% of the babies are within 2 standard
deviation from the mean.
c) To find the frequencies and relative frequency within/under 3
standard deviation, we need to add 3 standard deviation from the
mean and subtract 3 standard deviation from the mean to identify the
range/area under 3 standard deviation.
Range: 𝜇 − 3𝜎 < 𝑥 < 𝜇 + 3𝜎
6.11 − 3(1.61) < 𝑥 < 6.11 + 3(1.61)
6.11 − 4.83 < 𝑥 < 6.11 + 4.83
1.28 < 𝑥 < 10.94
Therefore, there are 36 babies out of 36 babies or about
100% of the babies are within 3 standard deviation from the
mean.
Activity: 1/2 crosswise
Validating the Empirical Rule
Fifty students were asked to run a 100-meter dash. The
data below represents the time it took to finish the dash, and
the histogram. The mean time for the 50 students is 15.8
seconds, and the standard deviation s is approximately 3.29
seconds.
Draw the normal curve, find the probability/relative frequency and
the number of students under/within:
a) 1 standard deviation
b) 2 standard deviation
c) 3 standard deviation
Historical Notes on the Normal Curve:
(i) The French-English mathematician Abraham de Moivre first described
the use of the normal distribution in 1733 when he was developing the
mathematics of chance, particularly for approximating the binomial
distribution. Marquis de Laplace used the normal distribution as a model
of measuring errors. Adolphe Quetelet and Carl Friedrich Gauss
popularized its use. Quetelet used the normal curve to discuss “the
average man” with the idea of using the curve as some sort of an ideal
histogram while Gauss used the normal curve to analyze astronomical
data in 1809. (ii) In some disciplines, such as engineering, the normal
distribution is also called the Gaussian distribution (in honor of Gauss who
did not first propose it!). The first unambiguous use of the term “normal”
distribution is attributed to Sir Francis Galton in 1889 although Karl
Pearson's consistent and exclusive use of this term in his prolific writings
led to its eventual adoption throughout the statistical community
Normal Distribution
 It is a probability distribution of continuous
random variables.
 The graph of the normal distribution
depends on two factors: the mean µ, and
the standard deviation σ.
 In fact, the mean and standard deviation
characterize the whole distribution. That is,
we can get areas under the normal curve
given information about the mean and
standard deviation.
 The mean determines the location of the
center of the bell -shaped curve. Thus, a
change in the value of the mean shifts the
graph of the normal curve to the right or to
the left.
Normal Distribution
IDENTIFYING REGIONS OF
AREAS UNDER THE NORMAL
CURVE
Directions: Observe the illustrations then
answer the questions that follow.
1. What is the mean?
Figure A: _____ Figure B: __
2. What is the standard deviation?
Figure A: ______ Figure B: _____
3. What is the area of the shaded
region?
Figure A: ______ Figure B: ____
4. What did you do to identify the area
of the shaded region?
Figure A: _______ Figure B: ______
5. Did you use the same method?
________
Normal variable is standardized by setting the mean
to 0 and standard deviation to 1. This is for the purpose of
simplifying the process in approximating areas for normal
curves. As shown below is the formula used to manually
compute the approximate area.
The outermost column and row represent the z-values. The
first two digits of the z-value are found in the leftmost column
and the last digit (hundredth place) is found on the first row.
Example:
Suppose the z-score is equal to 1.85, locate the first two
digits 1.8 in the leftmost column and the last digit, .05, can be
located at the first row. Then find their intersection which
gives the corresponding area. Therefore, given z = 1.85, the
area is equal to 0.9678.
Try:
1. Find the area that corresponds to z = 2.67
2.Find the area that corresponds to z = 1.29
3.Find the area that corresponds to z = - 0.64
Ans: 0.9962
Ans.: 0.2611
Ans: 0.9015
Match the z-value given in column A to its corresponding area in
column B. Then, identify the hidden message by filling in the letters
indicated in column B to the corresponding number indicated in
each blank below.
1. Find the area of the region between
z= 1 and z = 3.
Solution:
The area of the region described by the
point z = 1 indicates the area from z = 0 to z =
1.
Using the z-Table, it has corresponding
area of 0.3413.
So with z = 3, it describes the area of the
region from z = 0 to z = 3, with
corresponding area of 0.4987 (using the z
Table).
The problem states that we need to find the area of the
region between the given two z-values (red line).
In doing so, we need to subtract the area that
corresponds to z = 3 to the area that corresponds to z = 1.
Thus, we have 0.4987 – 0.3413 = 0.1574
Therefore, the area between z = 1 and z = 3 is 0.1574.
2. Find the area of the region between z = 1 and z =-1
.Solution:
The area of the region described by
the point z = 1 indicates the area from z
= 0 to z = 1. Using the z-Table, it has
corresponding area of 0.3413.
So with z = -1, it describes the area
of the region from z = 0 to z = -1, with
corresponding area of 0.3413 (using
the z_x0002_Table).
z = 1 has the same area with z= -1 since the curve is
symmetrical about the mean. Therefore, finding the
area of z = 1 is the same as finding the area of z = -1.
The problem states that we need to find the area of the
region between the given two z-values (red line).
In doing so, we need to add the area that corresponds
to z = 1 to the area that corresponds to z = -1.
Thus, we have.. 0.3413 + 0.3413 = 0.6826
Therefore, the area between
z = 1 and z = -1 is 0.6826.
TRY: Activity
1. Find the area of the region between z = 2 and
z = -1.5.
2. Find the area of the region between z = 3 and
z = -1
Quiz (1/2 crosswise)
Find the area of the region under the
curve that corresponds between the given
z-values.
1. z = 0.5 and z = 2
2. z = 1.5 and z = -1
3. z = 2 and z = -2.25
4. z = 2.5 and z = -0.5
Normal Distribution
DETERMINING PROBABILITIES
Mathematicians are not fond of lengthy expressions. They use
denotations, notations or symbols instead.
Probability notations are commonly used to express a lengthy idea
into symbols concerning the normal curve.
• P(a < z < b) this notation represents the idea stating the probability that the z
value is between a and b.
• P(z> a) this notation rep resents the idea stating the probability that the z-value is
above a
• P(z< a) this notation represents the idea stating the probability that the z-value is
below a where a and b are z-score values.
• P(z = a) = 0 this notation represents the ideastating the probability that the z
value is equal to a is 0. This notation indicates that a z-value is equal to exactly
one point on the curve. With that single point, a line can be drawn signifying the
probability can be below or above it. That is why, for a z-value to be exactly equal
to a value its probability is equal to 0.
Let us familiarize some of the terms involved in using
notations.
1. Find the proportion of the area between z = 2 and z = 3.
Solution:
Steps:
a. Draw a normal curve.Locate the required
z-values.Shade the required region.
b. Locate from the z-Table the
corresponding areas of the given zvalues.
c. With the graph, decide on what operation
will be used to identify the proportion of the
area of the region. Use probability notation
to avoid lengthy expressions.
d. Make a concluding statement.
z = 2 has a corresponding area of
0.4772
z = 3 has a corresponding area of
0.4987
With the given graph, the
operation to be used is
subtraction.
P(2 < z <3) = 0.4987 – 0.4772 = 0.0215
The required area between
z = 2 and z = 3 is 0.0215.
2. Find the proportion of the area below z = 1.
a
.
b
.
c
.
d
.
z = 1 has a corresponding area of 0.3413.
This area signifies only from z = 0 to z = 1.
P(z < 1) = 0.5000+ 0.3413 = 0.8413
This is so because the area of the
region from z = 0 to its left is 0.5
since it represents half of the
normal curve. With the property
that the curve has area equal to 1,
therefore half of its area signifies
0.5000 or 0.5.
The required area below z = 1 is
0.8413.
Draw a normal curve.
Locate from the z-
Table the
corresponding areas of
the given zvalues.
3. Find the area that the z-value is exactly equal to 1.
a
.
b
.
c
With the given graph, there is no need to decide on what
operation to be used since as defined, if a z-value is equal
to exactly one number then its probability or the proportion
of the area of the region is automatically 0.
P(z = 1) = 0
The required area at z = 1 is 0.
Activity: by 5
Solve for the proportion of the area of the
following probability notations. Then, sketch the
normal curve shading the required region of each
given notation.
1. P(-2 < z <1)
2. P(z > 3)
3. P(z < -2)
4. P(z >-1.5)
5. P(z = -1)
Normal Distribution
UNDERSTANDING THE
Z- SCORES
The concept
The Z-score, also known as the standard score,
measures how many standard deviations a data point is from
the mean of the dataset.
Example:
1. In Mrs. Shirley’s science class, a student gained a
score of 46. What is the z value of his score if test
result has population mean 45 with standard
deviation of 2?
Solution:
Given : 𝜇 = 45, 𝜎 = 2, X = 46
𝒛 =
𝟒𝟔 − 𝟒𝟓
𝟐
𝒛 =
𝟏
𝟐
0r .0.5
• Therefore, the z-value that
corresponds to the raw score
of 46 is 0.5.
𝒛 =
𝑿−𝝁
𝝈
Interpretation:
• A positive Z-score indicates that the data
point is above the mean.
• A negative Z-score indicates that the data
point is below the mean.
• The magnitude of the Z-score tells us how
far away the data point is from the mean in
terms of standard deviations.
Try: by pair
2. Leslie got a score of 68 in an examination she participated.
What is the corresponding z-value of her score if the result has
𝜇 = 75 and 𝜎 = 5.
3. Mrs. Bastillada conducted a test survey about determining
the current level of students’ learning on Geometry. After
checking the testquestionnaires, she was amazed that a
student attained 50 correct answers. What is the corresponding
z-value of the student’s score if the sample mean of the test
results was 45 and standard deviation is 6?
Activity:
Given 𝜇 = 110 and 𝜎 = 10 in a college entrance
examination, find the corresponding z-value of the scores
gained by the following students. Show all your solutions
and sketch its graph.
1. X = 98
2. X = 65
3. X = 120
4. X = 74
5. X = 135
HOW THE Z-SCORES IMPORTANT?
• Quality Control: In manufacturing, Z-scores help monitor and
maintain quality standards by identifying deviations from expected
values.
• Financial Analysis: Z-scores, such as the Altman Z-score, are
used to assess the financial health and risk of companies.
• Data Analysis: Z-scores facilitate data analysis by providing a
common scale for variables.
• Normalization: In machine learning, Z-scores are used to
normalize data, improving the performance of algorithms.
Normal Distribution
LOCATING PERCENTILES
UNDER THE NORMAL CURVE
A percentile is a measure used in statistics
indicating the value below which a given percentage of
observations in a group of observations fall. It is a
measure of relative standing as it measures the
relationship of a measurement of the rest of the data.
Imagine you took a standardized test and you
scored 91 at the 89th percentile. This means that 89% of the
examiners scored lower than 91 and 11% scored higher
than 91. This explains that 89th percentile is located where
89% of the total population lies below and 11% lies above
that point. To illustrate the 89th percentile of the normal
curve here are the steps:
1. Express the given percentage as probability, remember 89% is
the same as 0.8900.
2. Using the z-table (Cumulative Distribution Function (CDF) of the
Standard Normal Curve), locate the area of 0.8900.
3. There is no area corresponding exactly to 0.8900. It is between of
0.8888 with a corresponding z - score of 1.22 and 0.8907 with a
corresponding z - score of 1.23. The nearest value to 0.8900 is
0.8888 and therefore, the distribution lies below z = 1.22.
4. Construct a normal curve and shade the region to the left of
1.22.
Example:
1. Find the 86th percentile of the normal curve.
Solution:
a. Draw the appropriate normal curve.
b. Express the given percentage as probability
95% is the same as 0.9500
C. Split 0.9500 into 0.5000 and 4500
0.9500 = 0.5000 + 0.4500
D. Locate the nearest value of 0.4500 from the values 0.4495 and
0.4505
Since both values display the same amount of distance away from 0.4500,
we cannot just easily pick a number from the values 0.4495 and 0.4505 and
find it the nearest of 0.4500. Thus, we need to do the Interpolation.
Do the interpolation.
Therefore, the corresponding z-value of 0.4500 is 1.645.
The shaded region is the 95% percentile of the distribution.
Meaning, 95% of the distribution lies below the z-value
1.645.
Activity:
Solve for the percentile of the following numbers. Then sketch
its graph.
1. 30th
2. 52nd
3. 15th
4. 88th
5. 97th
Assessment:
Directions: Read the following statements carefully. Write
ND if the statement describes a characteristic of a normal
distribution, and NND if it does not describe a characteristic of
a normal distribution. Write your answers on a separate sheet
of paper.
1. The curve of the distribution is bell-shaped.
2. In a normal distribution, the mean, median and mode are of
equal values.
3. The normal curve gradually gets closer and closer to 0 on
one side.
4. The curve is symmetrical about the mean.
5. The distance between the two inflection points of the
normal curve is equal to thevalue of the mean.
6. A normal distribution has a mean that is also equal to the
standard deviation.
7. The two parameters of the normal distribution are the
mean and the standard deviation.
8. The normal curve can be described as asymptotic.
9. Two standard deviations away from the left and right of the
mean is equal to 68.3%.
10. The area under the curve bounded by the x-axis is equal
to 1.

Statistics and Probability- NORMAL DISTRIBUTION.pptx

  • 1.
    Normal Distribution Understanding theNormal Curve Distribution
  • 2.
    Objective: •Illustrate a normalrandom variable and its characteristics; •Construct a normal curve; • Identify regions under the normal curve; •Convert a normal random variable to a standard normal variable and vice versa; •Compute probabilities and percentiles using the standard normal table.
  • 3.
    1. Probability isthe value greater than or equal o zero but less than or equal to one. 2. Discrete variables are the infinite numerical values like heights, weights, distance, and lenght. 3. 34% is equal to 0.34. 4. Mean,mode and standard deviation are the measures o central tendency. 5. Mean is equal to the summation of scores divide by the number of cases. Determine wether the following statement is true or false. True True True False False
  • 4.
    Normal Distribution  Itis a probability distribution of continuous random variables.  The graph of the normal distribution depends on two factors: the mean µ, and the standard deviation σ.  In fact, the mean and standard deviation characterize the whole distribution. That is, we can get areas under the normal curve given information about the mean and standard deviation.  The mean determines the location of the center of the bell -shaped curve. Thus, a change in the value of the mean shifts the graph of the normal curve to the right or to the left.
  • 5.
     (a) themean represents the balancing point of the graph of the distribution; (b) the mode represents the “high point” of the probability density function (i.e. the graph of the distribution), (c) the median represents the point where 50% of the area under the distribution is to the left and 50% of the area under the distribution is to the right. • For symmetric distributions with a single peak, such as the normal curve, take note that;Mean = Median = Mode. • The standard deviation determines the shape of the graphs (particularly, the height and width of the curve). • When the standard deviation is large, the normal curve is short and wide, while a small value for the standard deviation yields a skinnier and taller graph.
  • 6.
    The curve aboveon the left, is shorter and wider than the curve on the right, because the curve on the left has a bigger standard deviation. Note, that a normal curve is symmetric about its mean and is more concentrated in the middle rather than in the tails.
  • 7.
    If a distributioncontains a very large number of cases with equal measures of central tendency values, then the distribution is symmetrical* and the skewness* is 0. In statistics, it is called normal distribution or normal curve (Rene, et al. 2015).In specific sense, it is called a normal probability distribution whenever the frequencies are converted to probabilities.
  • 8.
    The properties ofa normal probability distribution: 1. The curve of the distribution is a bell-shaped. 2. The curve is symmetrical about the mean. 3. The mean, median and mode coincide at the center. 4.The width of the curve is determined by the standard deviation of the distribution. 5. The tails of the curve are plotted in both directions and flatten out indefinitely along the horizontal axis. 6. The total area under a normal curve is 1.
  • 9.
    Take note thatevery normal curve (regardless of its mean or standard deviation) conforms to the following "empirical rule" (also called the 68-95-99.7 rule):
  • 10.
    • About 68%of the area under the curve falls within 1 standard deviation of the mean. • About 95% of the area under the curve falls within 2 standard deviations of the mean. • Nearly the entire distribution (About 99.7% of the area under the curve) falls within 3 standard deviations of the
  • 11.
    Example: Consider the followingdata pertaining to hospital weights (in pounds) of all the 36 babies that were born in the maternity ward of a certain hospital. The data have an average of 6.11 pounds and a standard deviation of 1.61 pounds.
  • 12.
    Consider the followingdata pertaining to hospital weights (in pounds) of all the 36 babies that were born in the maternity ward of a certain hospital. The data have an average of 6.11 pounds and a standard deviation of 1.61 pounds. Validating the Empirical Rule Determine what frequency and relative frequency of babies’ weights that are within: a) One standard deviation from the mean b) Two standard deviations from the mean c) Three standard deviations from the mean
  • 13.
    Solution: a) To findthe frequencies and relative frequency within/under 1 standard deviation, we need to add 1 standard deviation from the mean and subtract 1 standard deviation from the mean to identify the range/area under 1 standard deviation. 𝜇 = 6.11 & 𝜎 = 1.61 Range: 𝜇 − 𝜎 < 𝑥 < 𝜇 + 𝜎 6.11 − 1.61 < 𝑥 < 6.11 + 1.61 4.5 < 𝑥 < 7.72
  • 14.
    How many weightsof babies in bold face that are within/under 1 standard deviation from 4.5 lbs. to 7.72 lbs? These are the weights of babies in bold face that are within/under 1 standard deviation from 4.5 lbs. to 7.72 lbs. Therefore, there are 26 babies out of 36 babies or about 72% of the babies are within 1 standard deviation from the mean.
  • 15.
    b) To findthe frequencies and relative frequency within/under 2 standard deviation, we need to add 2 standard deviation from the mean and subtract 2 standard deviation from the mean to identify the range/area under 2 standard deviation. Range: 𝜇 − 2𝜎 < 𝑥 < 𝜇 + 2𝜎 6.11 − 2(1.61) < 𝑥 < 6.11 + 2(1.61) 6.11 − 3.22 < 𝑥 < 6.11 + 3.22 2.89 < 𝑥 < 9.33
  • 16.
     These arethe weights of babies in bold face that are within/under 2 standard deviation from 2.89 lbs. to 9.33 lbs. Therefore, there are 34 babies out of 36 babies or about 94% of the babies are within 2 standard deviation from the mean.
  • 17.
    c) To findthe frequencies and relative frequency within/under 3 standard deviation, we need to add 3 standard deviation from the mean and subtract 3 standard deviation from the mean to identify the range/area under 3 standard deviation. Range: 𝜇 − 3𝜎 < 𝑥 < 𝜇 + 3𝜎 6.11 − 3(1.61) < 𝑥 < 6.11 + 3(1.61) 6.11 − 4.83 < 𝑥 < 6.11 + 4.83 1.28 < 𝑥 < 10.94
  • 18.
    Therefore, there are36 babies out of 36 babies or about 100% of the babies are within 3 standard deviation from the mean.
  • 19.
    Activity: 1/2 crosswise Validatingthe Empirical Rule Fifty students were asked to run a 100-meter dash. The data below represents the time it took to finish the dash, and the histogram. The mean time for the 50 students is 15.8 seconds, and the standard deviation s is approximately 3.29 seconds. Draw the normal curve, find the probability/relative frequency and the number of students under/within: a) 1 standard deviation b) 2 standard deviation c) 3 standard deviation
  • 20.
    Historical Notes onthe Normal Curve: (i) The French-English mathematician Abraham de Moivre first described the use of the normal distribution in 1733 when he was developing the mathematics of chance, particularly for approximating the binomial distribution. Marquis de Laplace used the normal distribution as a model of measuring errors. Adolphe Quetelet and Carl Friedrich Gauss popularized its use. Quetelet used the normal curve to discuss “the average man” with the idea of using the curve as some sort of an ideal histogram while Gauss used the normal curve to analyze astronomical data in 1809. (ii) In some disciplines, such as engineering, the normal distribution is also called the Gaussian distribution (in honor of Gauss who did not first propose it!). The first unambiguous use of the term “normal” distribution is attributed to Sir Francis Galton in 1889 although Karl Pearson's consistent and exclusive use of this term in his prolific writings led to its eventual adoption throughout the statistical community
  • 21.
    Normal Distribution  Itis a probability distribution of continuous random variables.  The graph of the normal distribution depends on two factors: the mean µ, and the standard deviation σ.  In fact, the mean and standard deviation characterize the whole distribution. That is, we can get areas under the normal curve given information about the mean and standard deviation.  The mean determines the location of the center of the bell -shaped curve. Thus, a change in the value of the mean shifts the graph of the normal curve to the right or to the left.
  • 22.
    Normal Distribution IDENTIFYING REGIONSOF AREAS UNDER THE NORMAL CURVE
  • 23.
    Directions: Observe theillustrations then answer the questions that follow. 1. What is the mean? Figure A: _____ Figure B: __ 2. What is the standard deviation? Figure A: ______ Figure B: _____ 3. What is the area of the shaded region? Figure A: ______ Figure B: ____ 4. What did you do to identify the area of the shaded region? Figure A: _______ Figure B: ______ 5. Did you use the same method? ________
  • 24.
    Normal variable isstandardized by setting the mean to 0 and standard deviation to 1. This is for the purpose of simplifying the process in approximating areas for normal curves. As shown below is the formula used to manually compute the approximate area.
  • 25.
    The outermost columnand row represent the z-values. The first two digits of the z-value are found in the leftmost column and the last digit (hundredth place) is found on the first row.
  • 26.
    Example: Suppose the z-scoreis equal to 1.85, locate the first two digits 1.8 in the leftmost column and the last digit, .05, can be located at the first row. Then find their intersection which gives the corresponding area. Therefore, given z = 1.85, the area is equal to 0.9678.
  • 27.
    Try: 1. Find thearea that corresponds to z = 2.67 2.Find the area that corresponds to z = 1.29 3.Find the area that corresponds to z = - 0.64 Ans: 0.9962 Ans.: 0.2611 Ans: 0.9015
  • 28.
    Match the z-valuegiven in column A to its corresponding area in column B. Then, identify the hidden message by filling in the letters indicated in column B to the corresponding number indicated in each blank below.
  • 29.
    1. Find thearea of the region between z= 1 and z = 3. Solution: The area of the region described by the point z = 1 indicates the area from z = 0 to z = 1. Using the z-Table, it has corresponding area of 0.3413. So with z = 3, it describes the area of the region from z = 0 to z = 3, with corresponding area of 0.4987 (using the z Table).
  • 30.
    The problem statesthat we need to find the area of the region between the given two z-values (red line). In doing so, we need to subtract the area that corresponds to z = 3 to the area that corresponds to z = 1. Thus, we have 0.4987 – 0.3413 = 0.1574 Therefore, the area between z = 1 and z = 3 is 0.1574.
  • 31.
    2. Find thearea of the region between z = 1 and z =-1 .Solution: The area of the region described by the point z = 1 indicates the area from z = 0 to z = 1. Using the z-Table, it has corresponding area of 0.3413. So with z = -1, it describes the area of the region from z = 0 to z = -1, with corresponding area of 0.3413 (using the z_x0002_Table). z = 1 has the same area with z= -1 since the curve is symmetrical about the mean. Therefore, finding the area of z = 1 is the same as finding the area of z = -1.
  • 32.
    The problem statesthat we need to find the area of the region between the given two z-values (red line). In doing so, we need to add the area that corresponds to z = 1 to the area that corresponds to z = -1. Thus, we have.. 0.3413 + 0.3413 = 0.6826 Therefore, the area between z = 1 and z = -1 is 0.6826.
  • 33.
    TRY: Activity 1. Findthe area of the region between z = 2 and z = -1.5. 2. Find the area of the region between z = 3 and z = -1
  • 34.
    Quiz (1/2 crosswise) Findthe area of the region under the curve that corresponds between the given z-values. 1. z = 0.5 and z = 2 2. z = 1.5 and z = -1 3. z = 2 and z = -2.25 4. z = 2.5 and z = -0.5
  • 35.
  • 36.
    Mathematicians are notfond of lengthy expressions. They use denotations, notations or symbols instead. Probability notations are commonly used to express a lengthy idea into symbols concerning the normal curve. • P(a < z < b) this notation represents the idea stating the probability that the z value is between a and b. • P(z> a) this notation rep resents the idea stating the probability that the z-value is above a • P(z< a) this notation represents the idea stating the probability that the z-value is below a where a and b are z-score values. • P(z = a) = 0 this notation represents the ideastating the probability that the z value is equal to a is 0. This notation indicates that a z-value is equal to exactly one point on the curve. With that single point, a line can be drawn signifying the probability can be below or above it. That is why, for a z-value to be exactly equal to a value its probability is equal to 0.
  • 37.
    Let us familiarizesome of the terms involved in using notations.
  • 38.
    1. Find theproportion of the area between z = 2 and z = 3. Solution: Steps: a. Draw a normal curve.Locate the required z-values.Shade the required region. b. Locate from the z-Table the corresponding areas of the given zvalues. c. With the graph, decide on what operation will be used to identify the proportion of the area of the region. Use probability notation to avoid lengthy expressions. d. Make a concluding statement. z = 2 has a corresponding area of 0.4772 z = 3 has a corresponding area of 0.4987 With the given graph, the operation to be used is subtraction. P(2 < z <3) = 0.4987 – 0.4772 = 0.0215 The required area between z = 2 and z = 3 is 0.0215.
  • 39.
    2. Find theproportion of the area below z = 1. a . b . c . d . z = 1 has a corresponding area of 0.3413. This area signifies only from z = 0 to z = 1. P(z < 1) = 0.5000+ 0.3413 = 0.8413 This is so because the area of the region from z = 0 to its left is 0.5 since it represents half of the normal curve. With the property that the curve has area equal to 1, therefore half of its area signifies 0.5000 or 0.5. The required area below z = 1 is 0.8413. Draw a normal curve. Locate from the z- Table the corresponding areas of the given zvalues.
  • 40.
    3. Find thearea that the z-value is exactly equal to 1. a . b . c With the given graph, there is no need to decide on what operation to be used since as defined, if a z-value is equal to exactly one number then its probability or the proportion of the area of the region is automatically 0. P(z = 1) = 0 The required area at z = 1 is 0.
  • 41.
    Activity: by 5 Solvefor the proportion of the area of the following probability notations. Then, sketch the normal curve shading the required region of each given notation. 1. P(-2 < z <1) 2. P(z > 3) 3. P(z < -2) 4. P(z >-1.5) 5. P(z = -1)
  • 42.
  • 43.
    The concept The Z-score,also known as the standard score, measures how many standard deviations a data point is from the mean of the dataset.
  • 44.
    Example: 1. In Mrs.Shirley’s science class, a student gained a score of 46. What is the z value of his score if test result has population mean 45 with standard deviation of 2? Solution: Given : 𝜇 = 45, 𝜎 = 2, X = 46 𝒛 = 𝟒𝟔 − 𝟒𝟓 𝟐 𝒛 = 𝟏 𝟐 0r .0.5 • Therefore, the z-value that corresponds to the raw score of 46 is 0.5. 𝒛 = 𝑿−𝝁 𝝈
  • 45.
    Interpretation: • A positiveZ-score indicates that the data point is above the mean. • A negative Z-score indicates that the data point is below the mean. • The magnitude of the Z-score tells us how far away the data point is from the mean in terms of standard deviations.
  • 46.
    Try: by pair 2.Leslie got a score of 68 in an examination she participated. What is the corresponding z-value of her score if the result has 𝜇 = 75 and 𝜎 = 5. 3. Mrs. Bastillada conducted a test survey about determining the current level of students’ learning on Geometry. After checking the testquestionnaires, she was amazed that a student attained 50 correct answers. What is the corresponding z-value of the student’s score if the sample mean of the test results was 45 and standard deviation is 6?
  • 47.
    Activity: Given 𝜇 =110 and 𝜎 = 10 in a college entrance examination, find the corresponding z-value of the scores gained by the following students. Show all your solutions and sketch its graph. 1. X = 98 2. X = 65 3. X = 120 4. X = 74 5. X = 135
  • 48.
    HOW THE Z-SCORESIMPORTANT? • Quality Control: In manufacturing, Z-scores help monitor and maintain quality standards by identifying deviations from expected values. • Financial Analysis: Z-scores, such as the Altman Z-score, are used to assess the financial health and risk of companies. • Data Analysis: Z-scores facilitate data analysis by providing a common scale for variables. • Normalization: In machine learning, Z-scores are used to normalize data, improving the performance of algorithms.
  • 49.
  • 50.
    A percentile isa measure used in statistics indicating the value below which a given percentage of observations in a group of observations fall. It is a measure of relative standing as it measures the relationship of a measurement of the rest of the data. Imagine you took a standardized test and you scored 91 at the 89th percentile. This means that 89% of the examiners scored lower than 91 and 11% scored higher than 91. This explains that 89th percentile is located where 89% of the total population lies below and 11% lies above that point. To illustrate the 89th percentile of the normal curve here are the steps:
  • 51.
    1. Express thegiven percentage as probability, remember 89% is the same as 0.8900. 2. Using the z-table (Cumulative Distribution Function (CDF) of the Standard Normal Curve), locate the area of 0.8900. 3. There is no area corresponding exactly to 0.8900. It is between of 0.8888 with a corresponding z - score of 1.22 and 0.8907 with a corresponding z - score of 1.23. The nearest value to 0.8900 is 0.8888 and therefore, the distribution lies below z = 1.22. 4. Construct a normal curve and shade the region to the left of 1.22.
  • 52.
    Example: 1. Find the86th percentile of the normal curve. Solution: a. Draw the appropriate normal curve. b. Express the given percentage as probability 95% is the same as 0.9500 C. Split 0.9500 into 0.5000 and 4500 0.9500 = 0.5000 + 0.4500 D. Locate the nearest value of 0.4500 from the values 0.4495 and 0.4505 Since both values display the same amount of distance away from 0.4500, we cannot just easily pick a number from the values 0.4495 and 0.4505 and find it the nearest of 0.4500. Thus, we need to do the Interpolation.
  • 53.
    Do the interpolation. Therefore,the corresponding z-value of 0.4500 is 1.645. The shaded region is the 95% percentile of the distribution. Meaning, 95% of the distribution lies below the z-value 1.645.
  • 54.
    Activity: Solve for thepercentile of the following numbers. Then sketch its graph. 1. 30th 2. 52nd 3. 15th 4. 88th 5. 97th
  • 55.
    Assessment: Directions: Read thefollowing statements carefully. Write ND if the statement describes a characteristic of a normal distribution, and NND if it does not describe a characteristic of a normal distribution. Write your answers on a separate sheet of paper. 1. The curve of the distribution is bell-shaped. 2. In a normal distribution, the mean, median and mode are of equal values. 3. The normal curve gradually gets closer and closer to 0 on one side. 4. The curve is symmetrical about the mean.
  • 56.
    5. The distancebetween the two inflection points of the normal curve is equal to thevalue of the mean. 6. A normal distribution has a mean that is also equal to the standard deviation. 7. The two parameters of the normal distribution are the mean and the standard deviation. 8. The normal curve can be described as asymptotic. 9. Two standard deviations away from the left and right of the mean is equal to 68.3%. 10. The area under the curve bounded by the x-axis is equal to 1.

Editor's Notes

  • #44 It indicates whether a particular value is typical or unusual relative to the rest of the data.