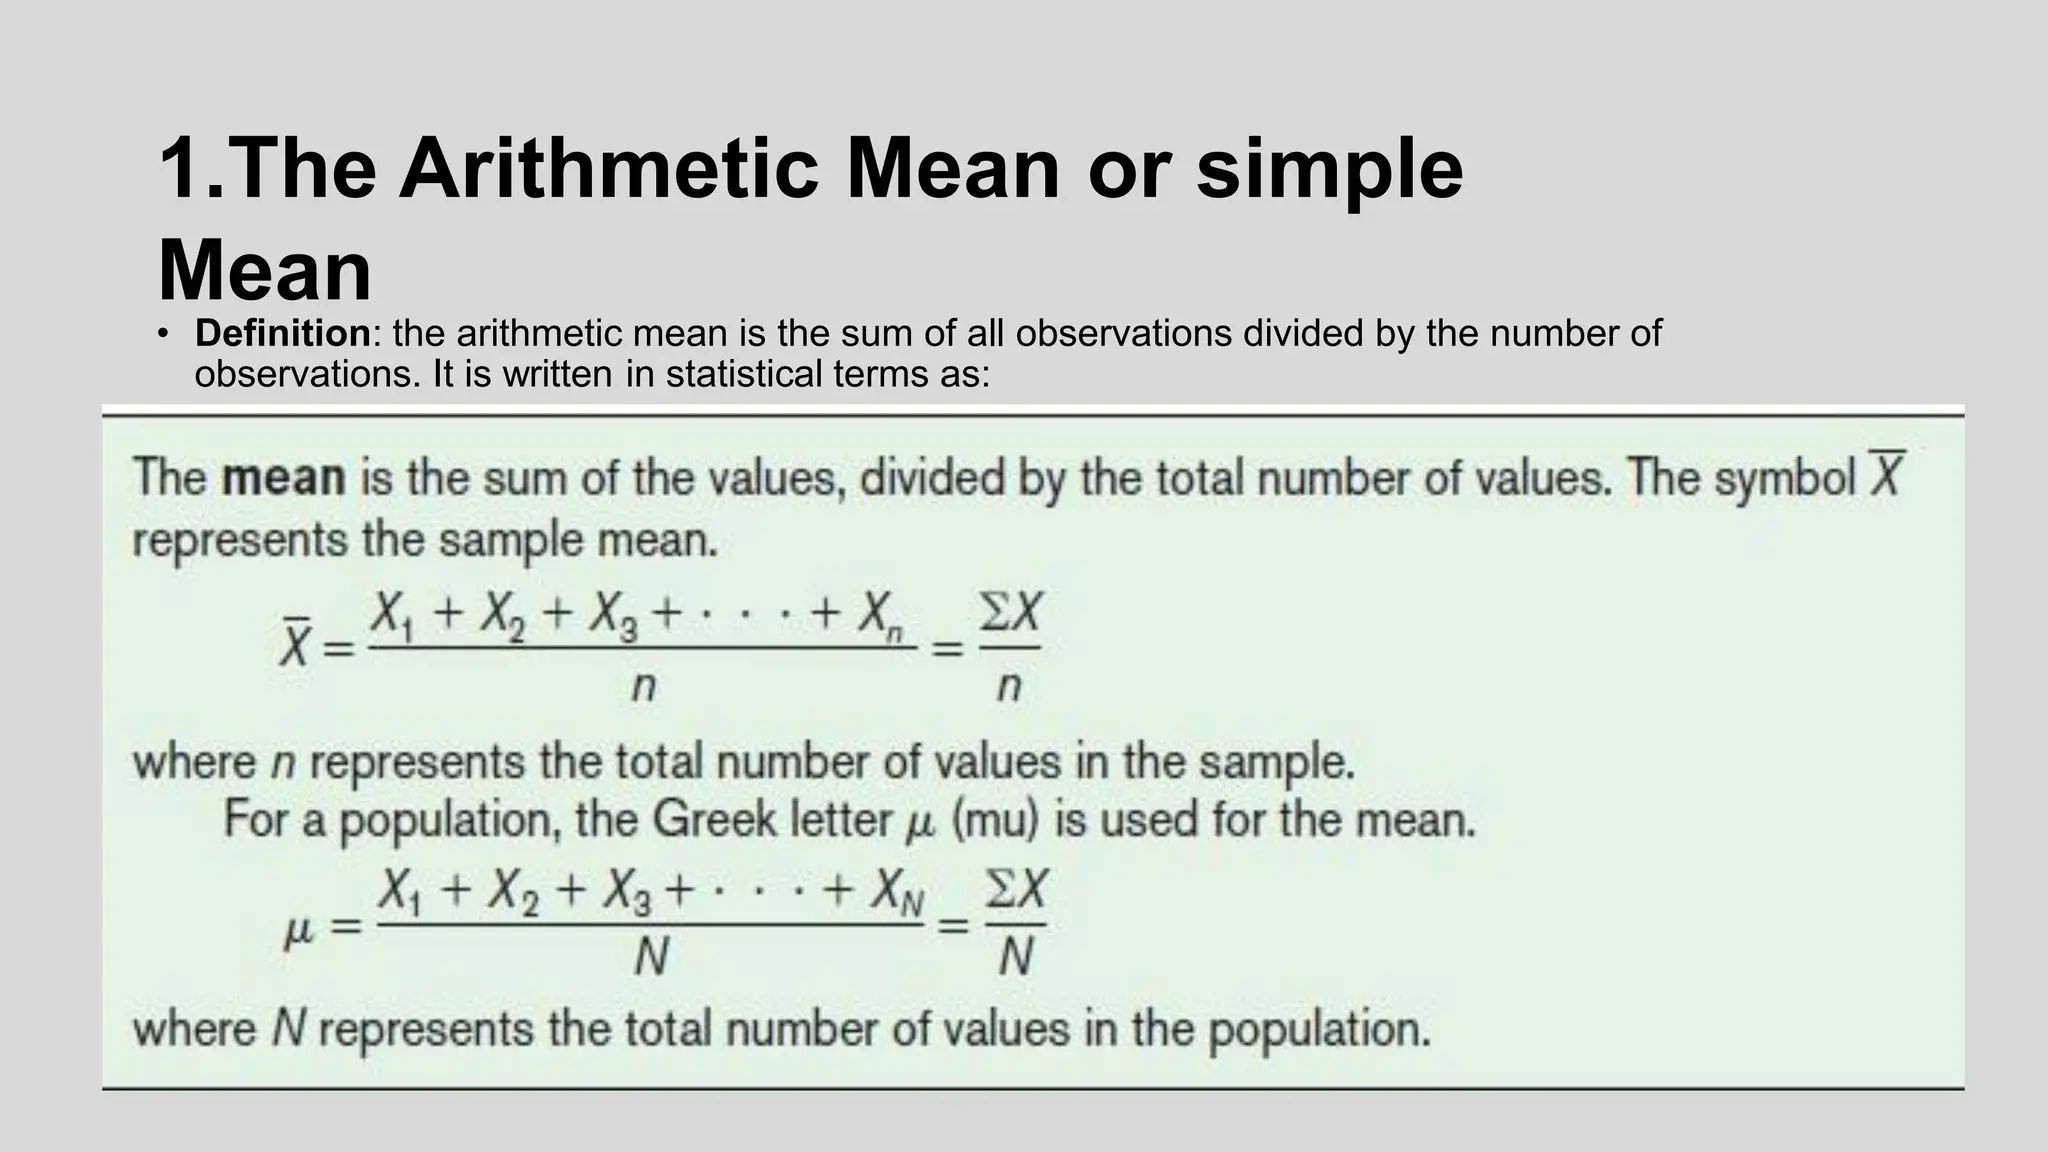
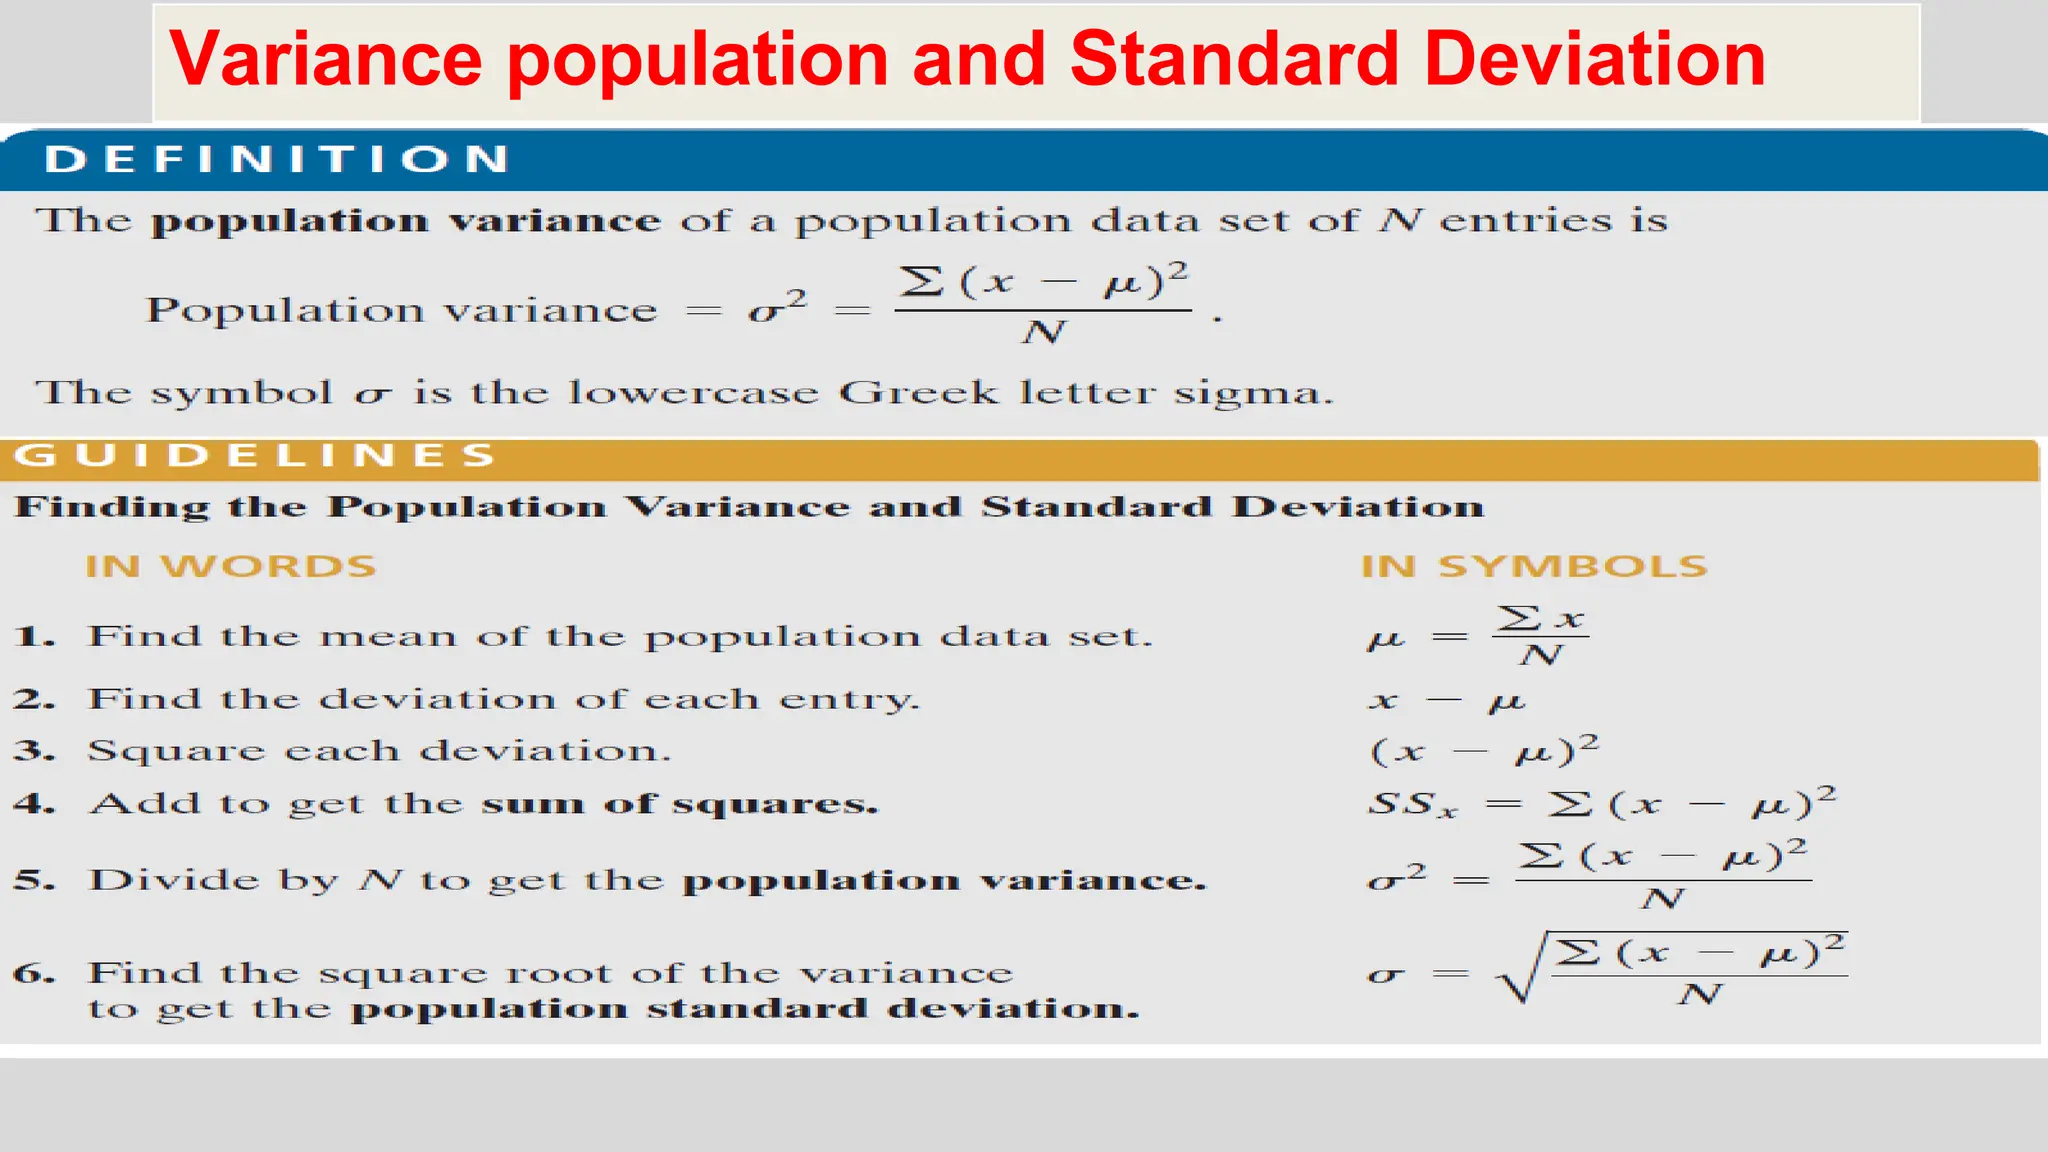
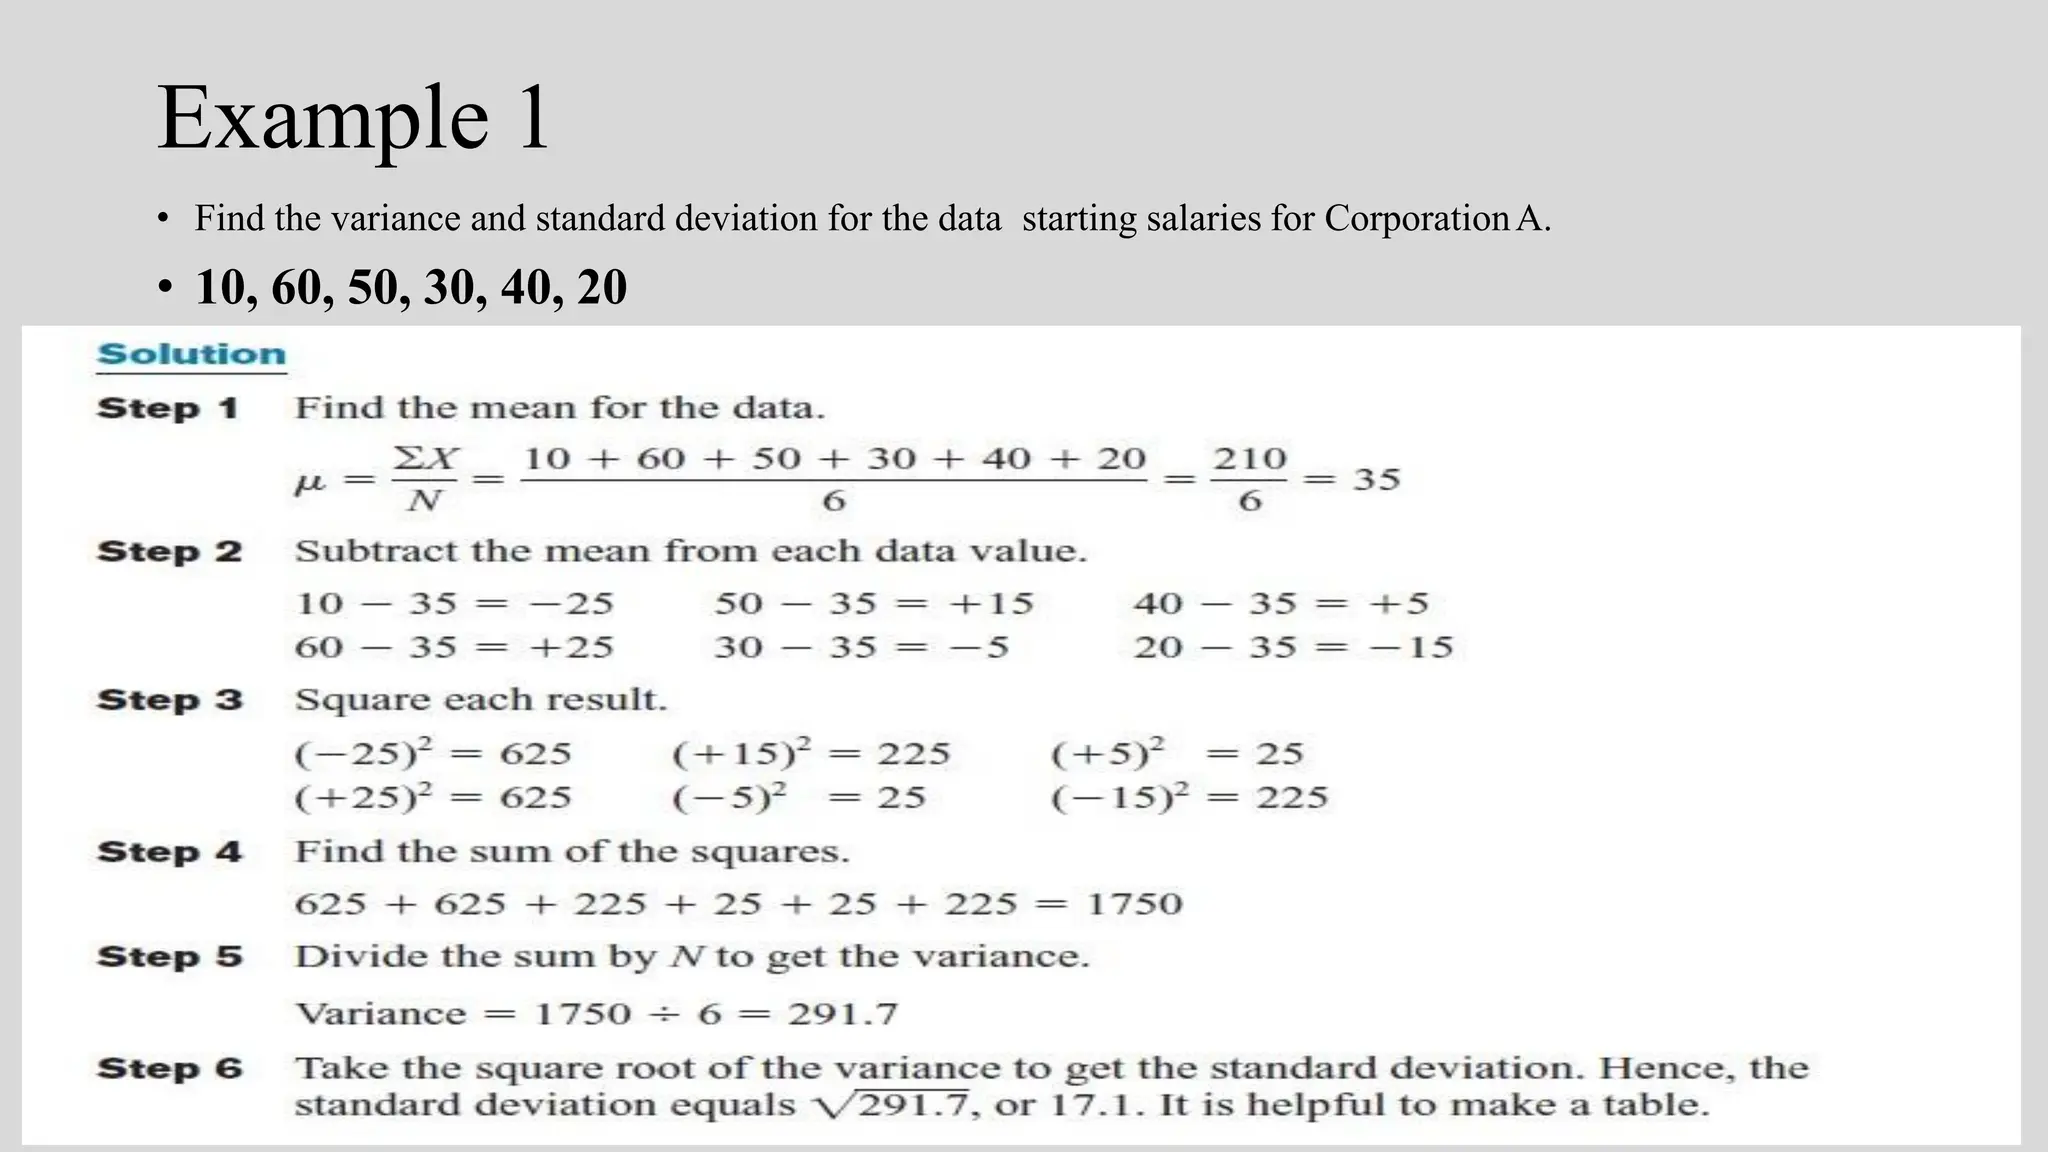
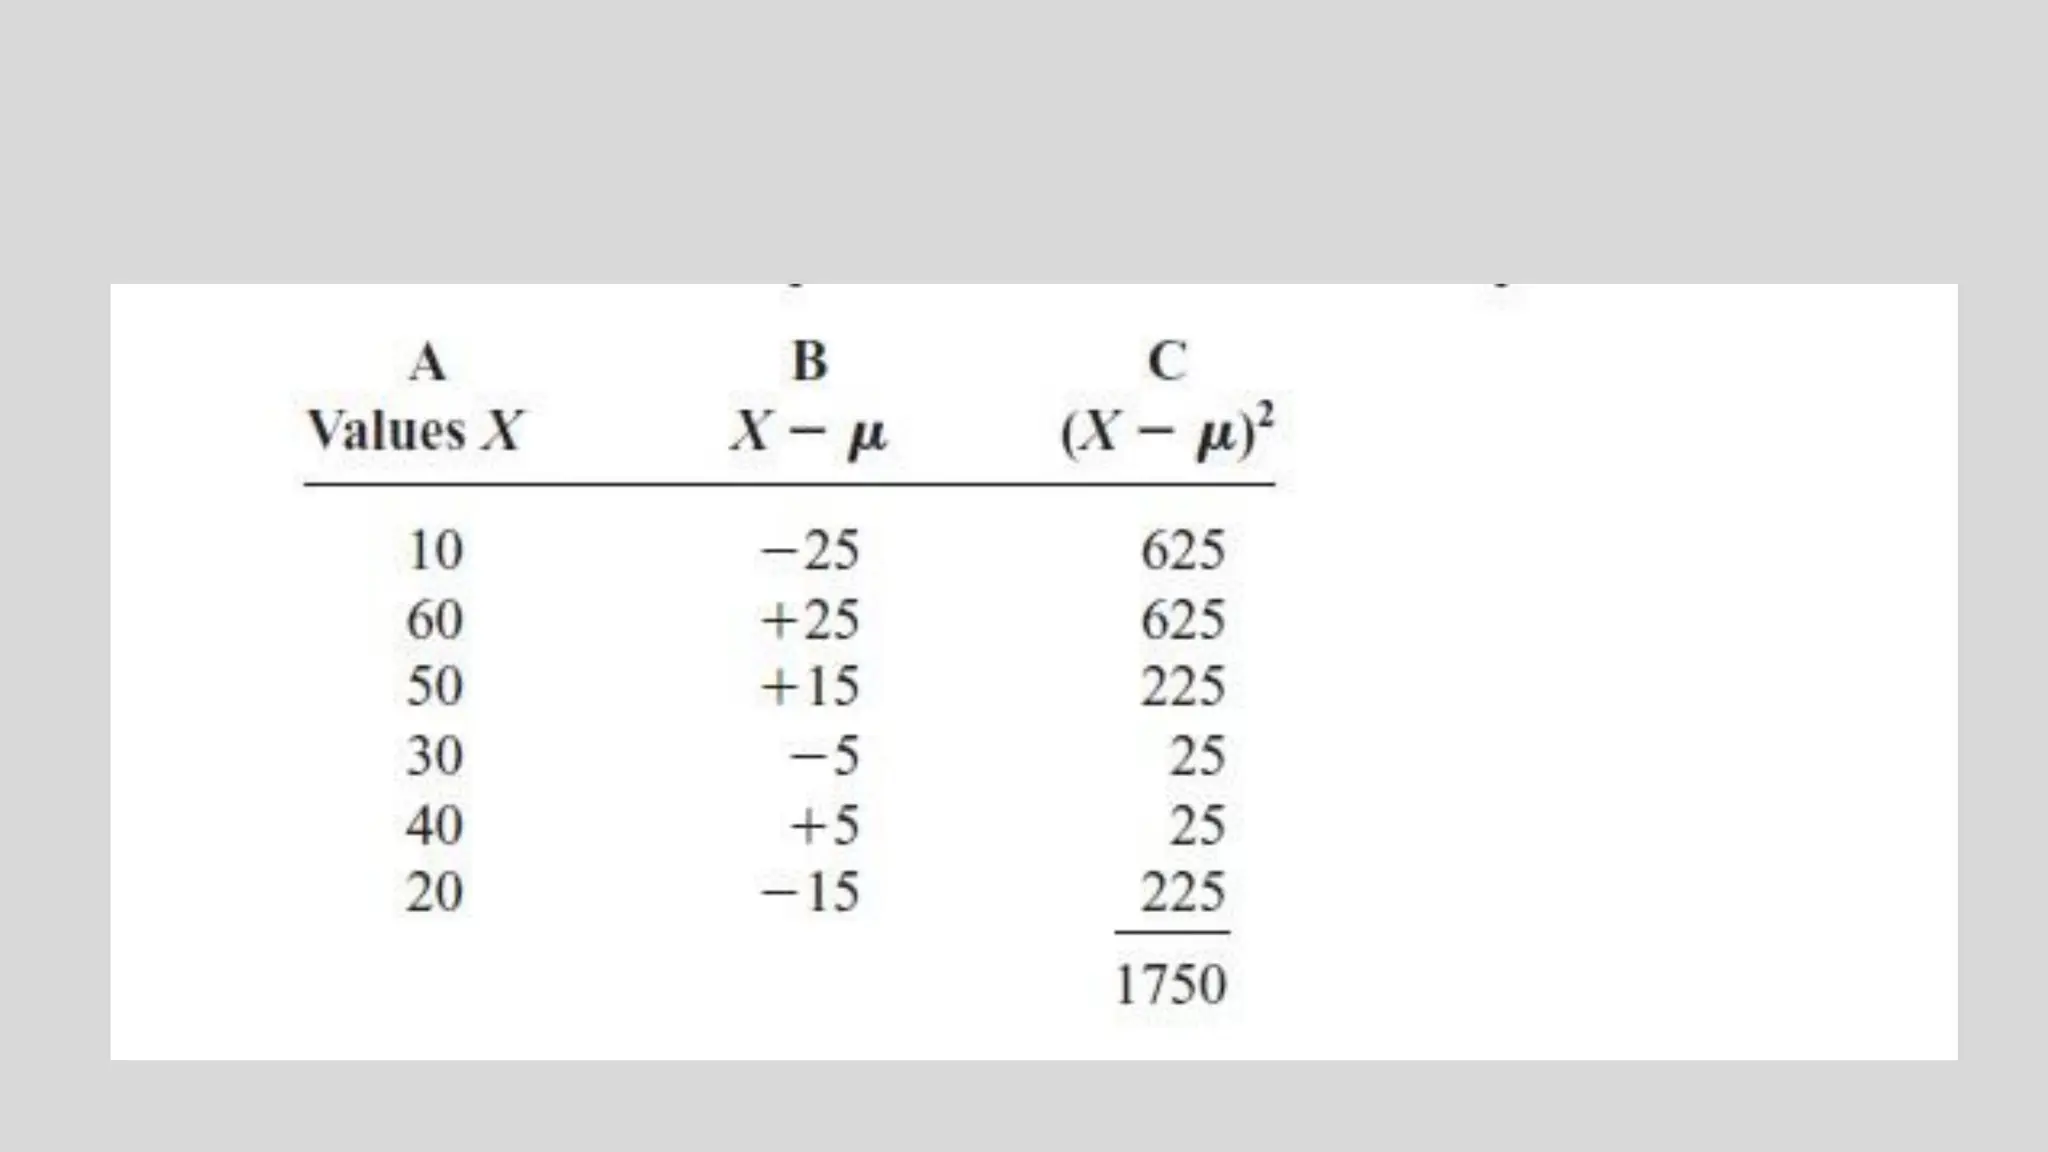
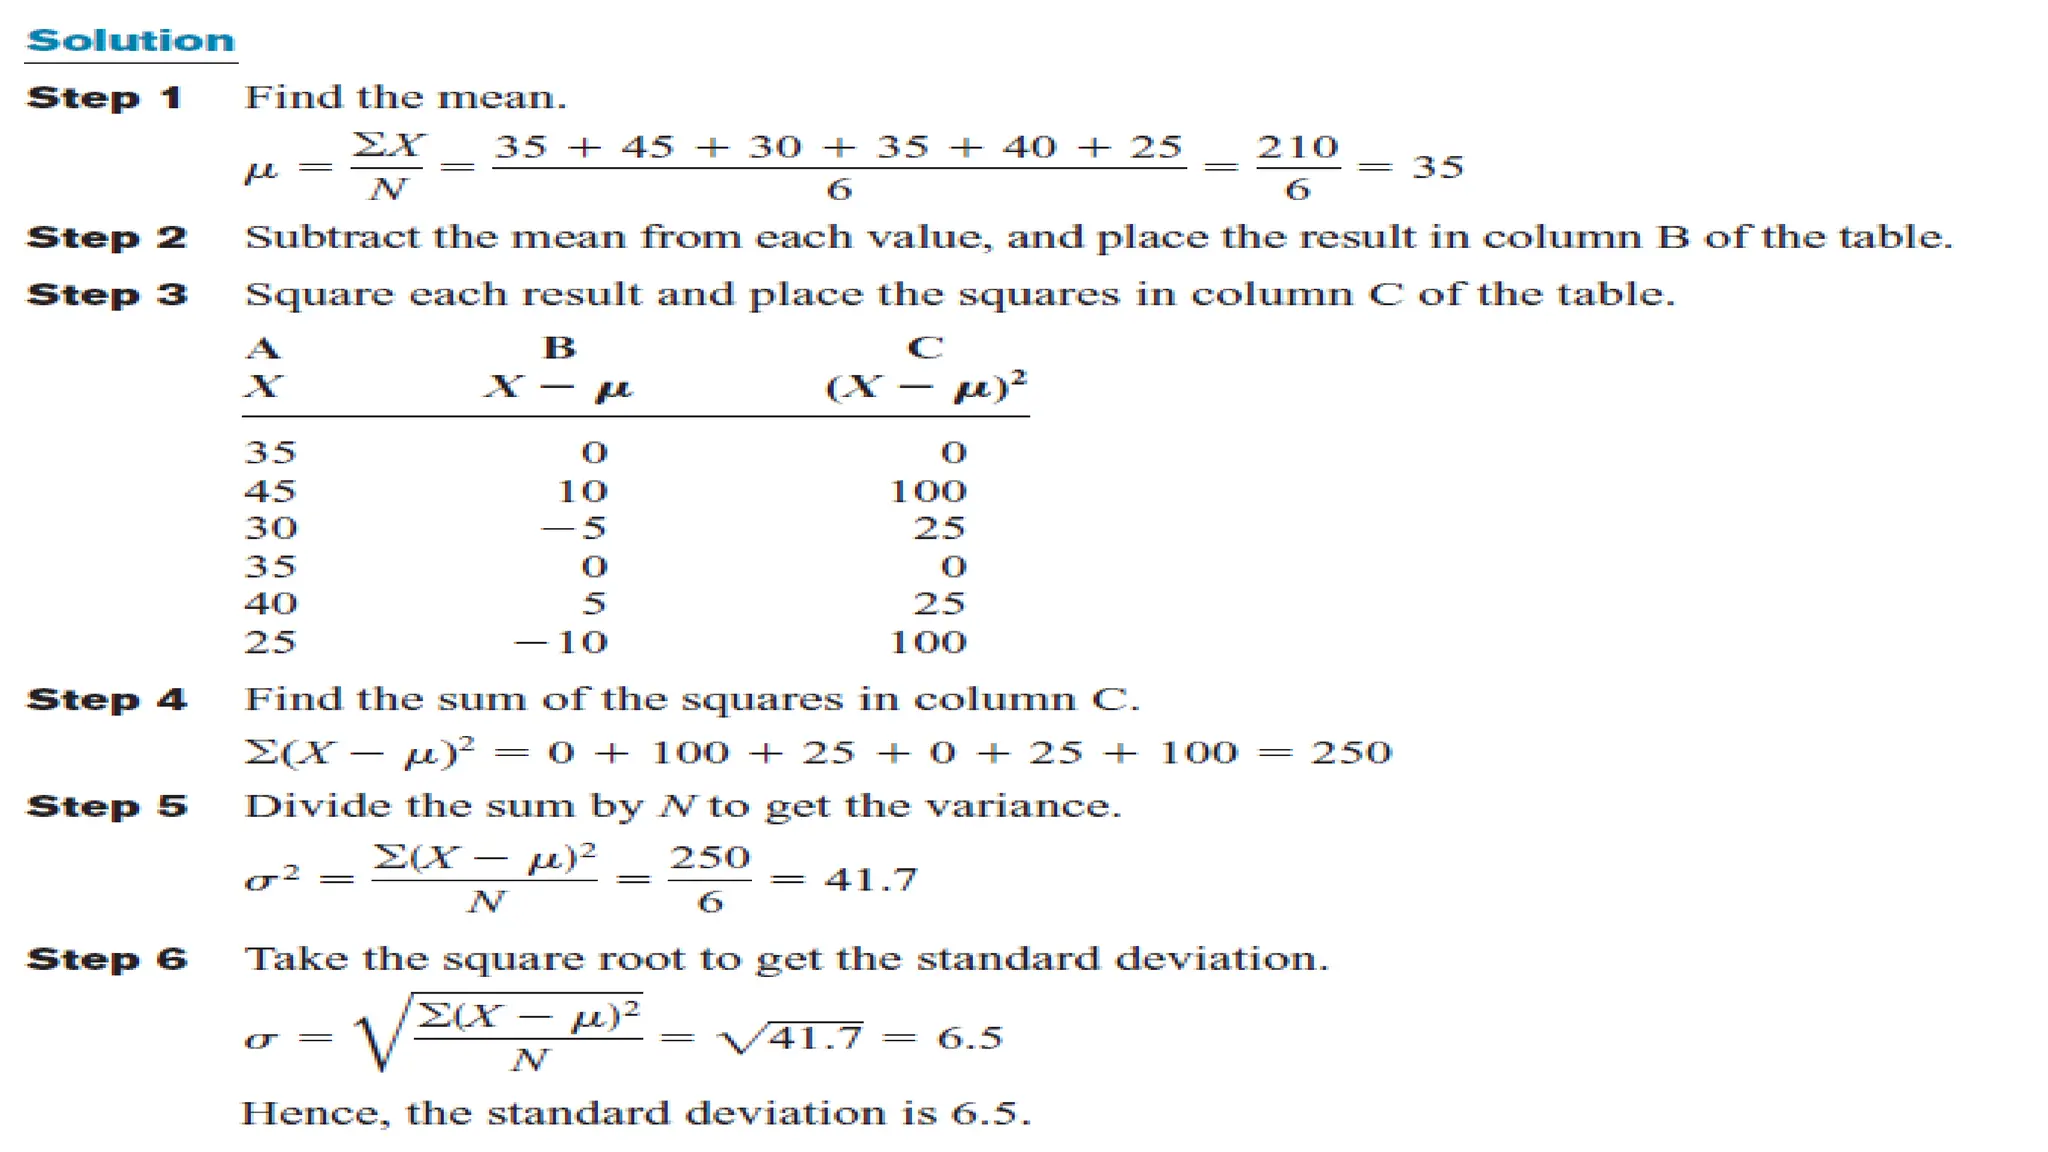
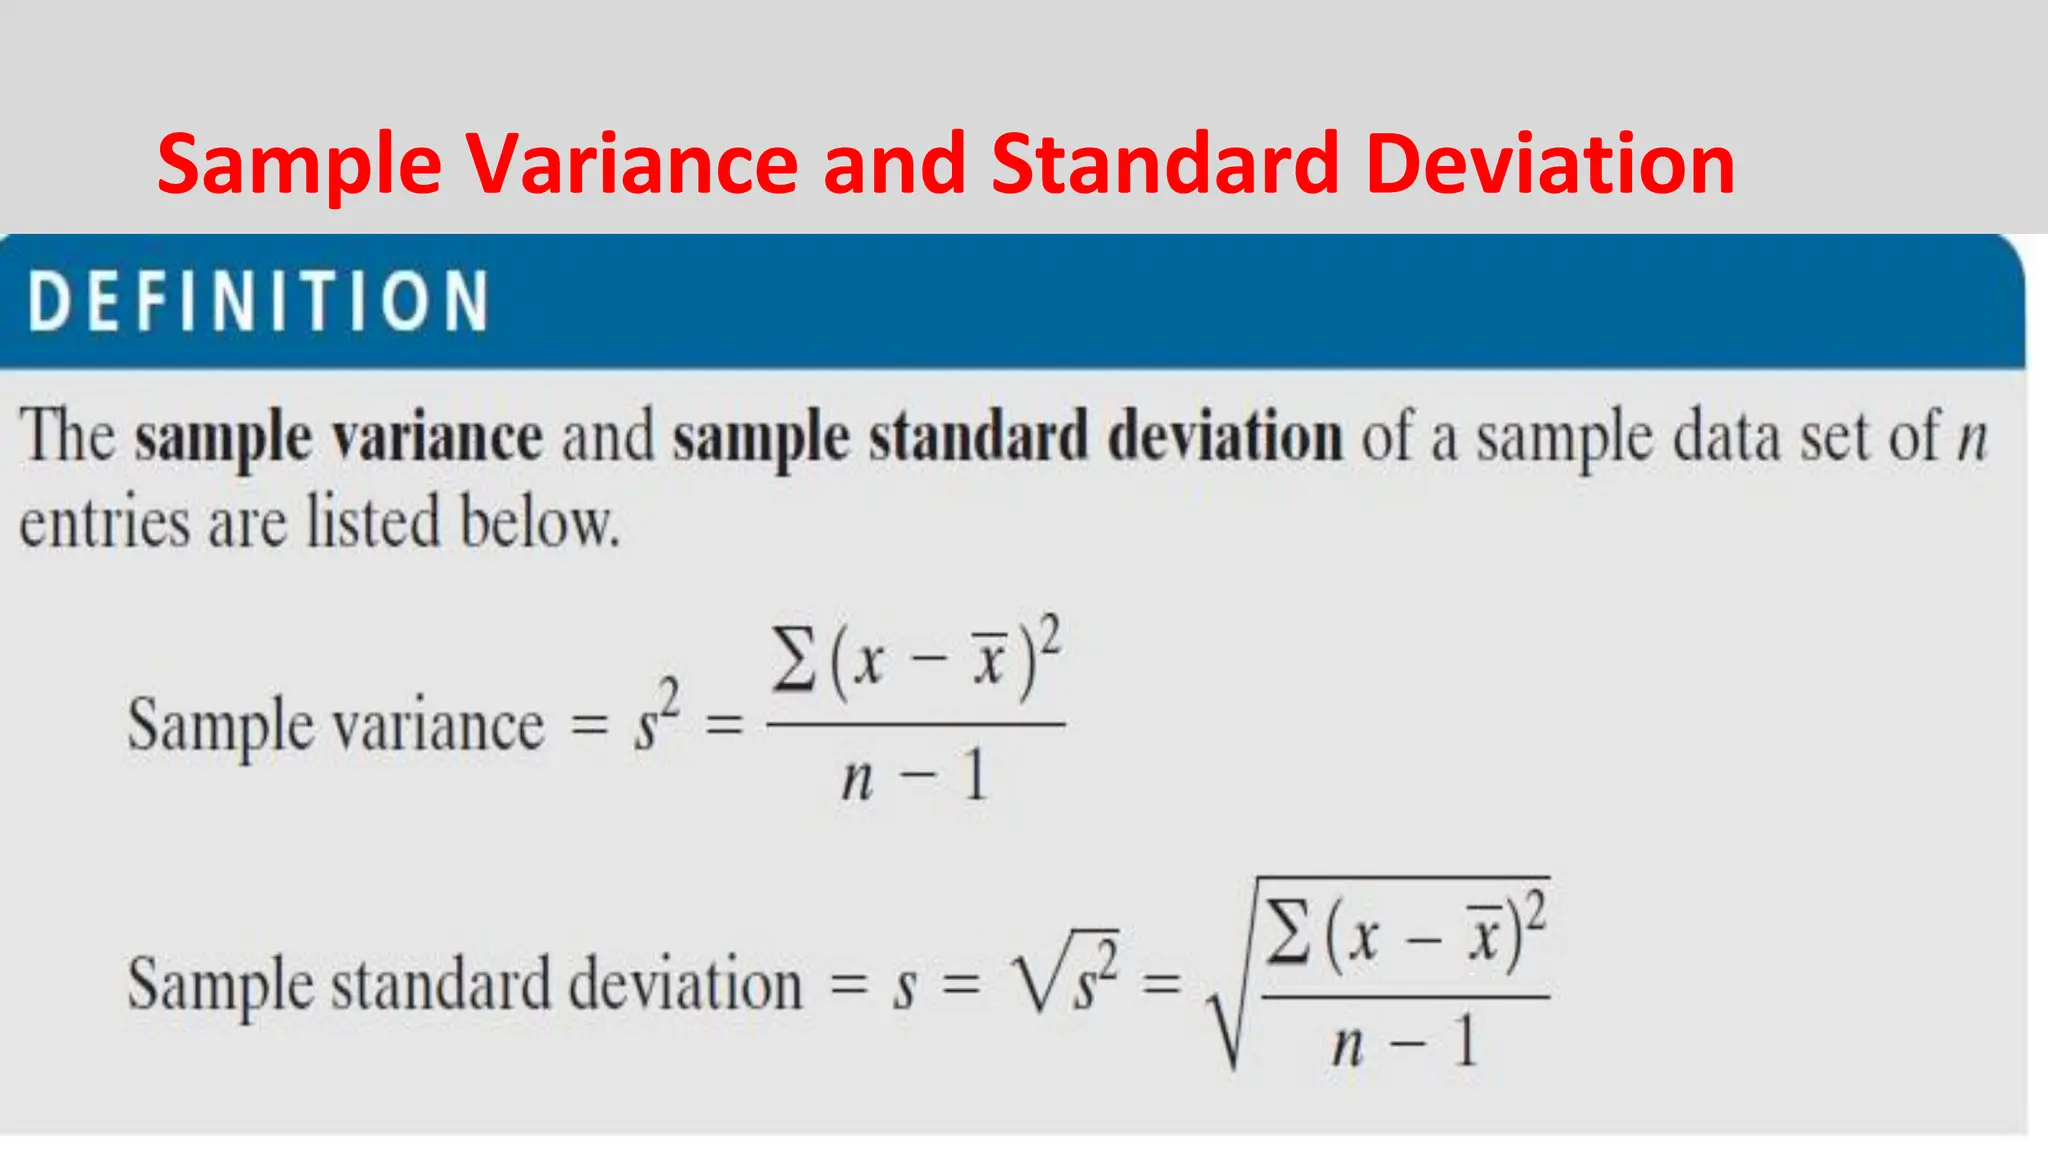
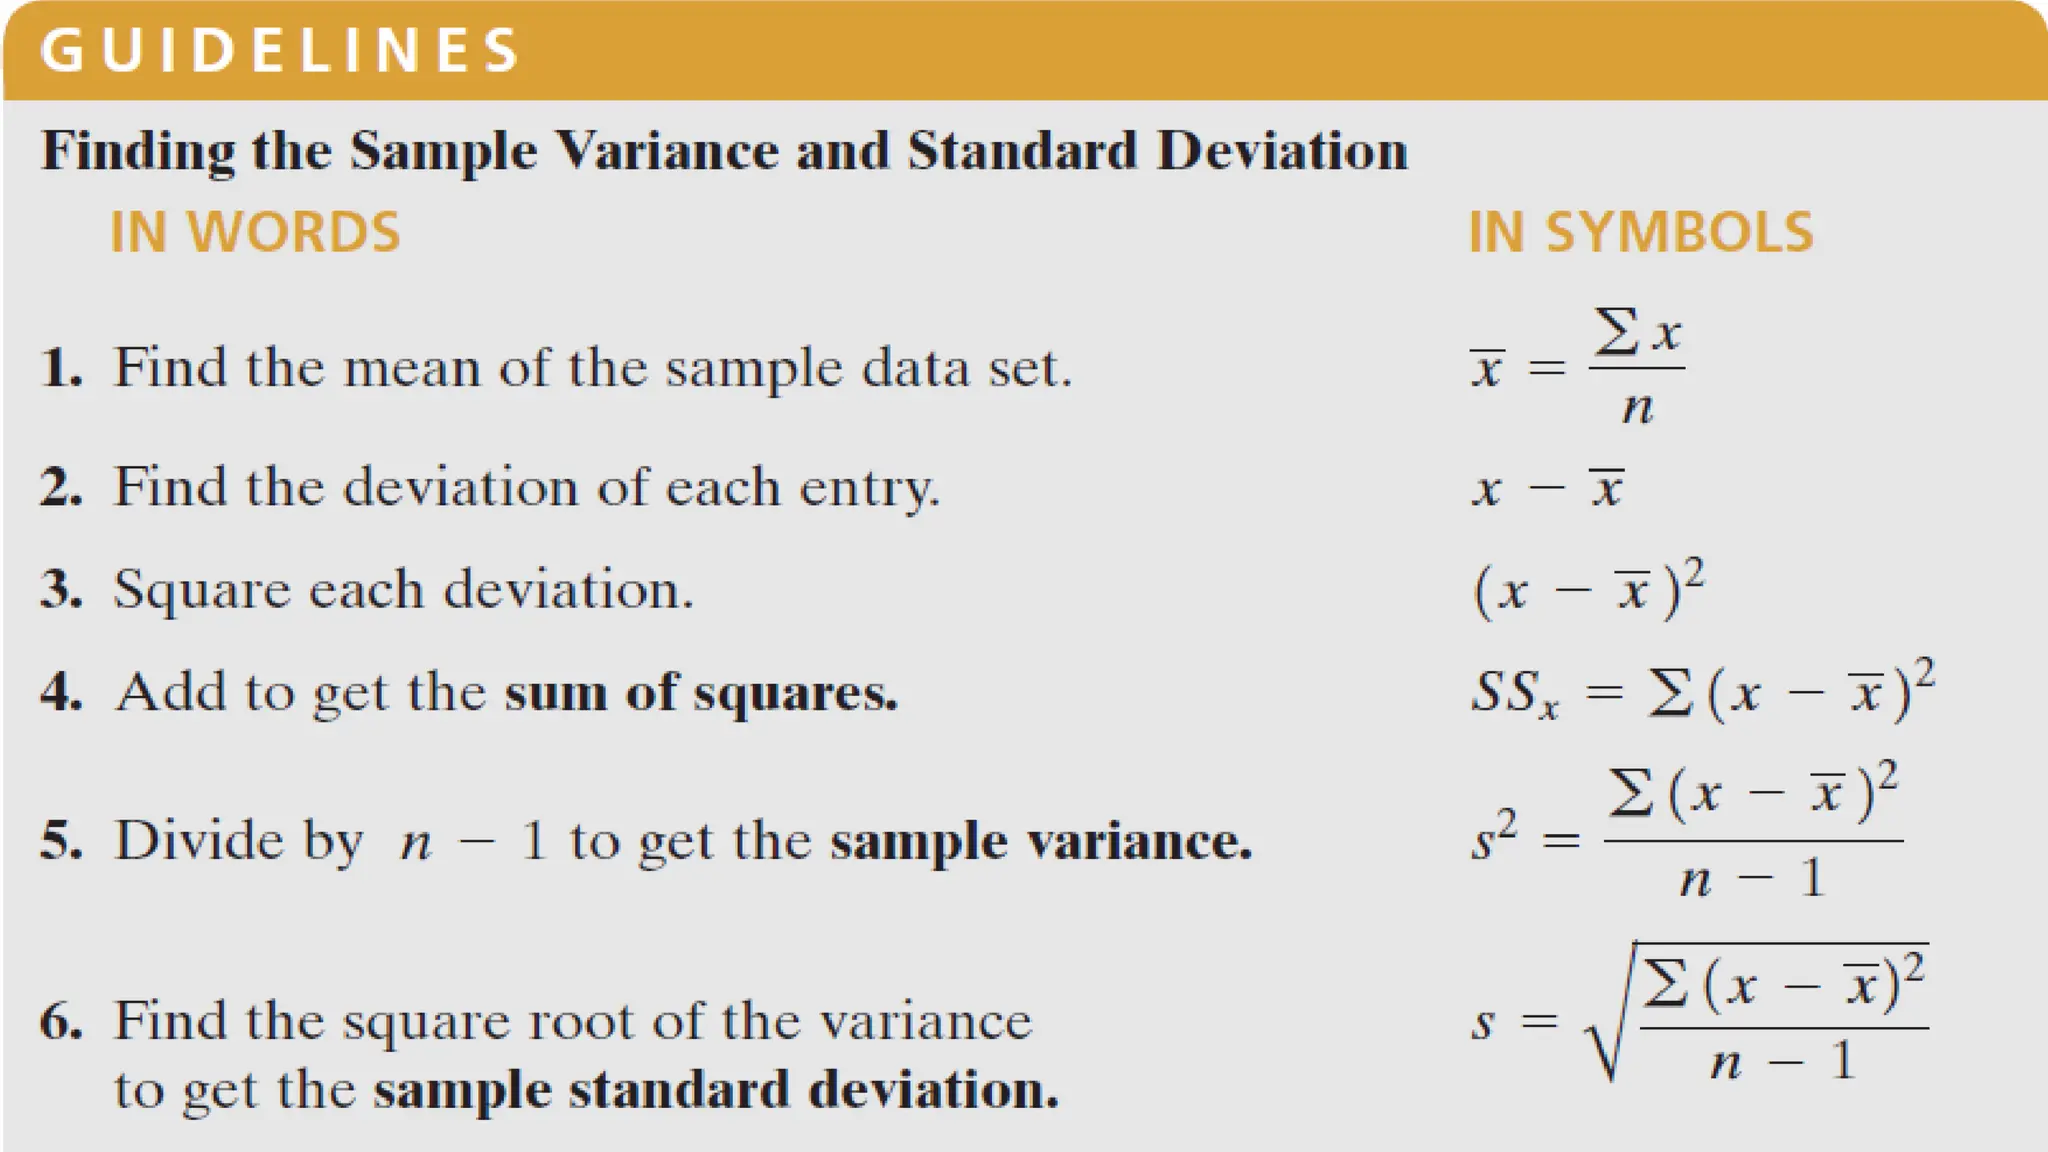
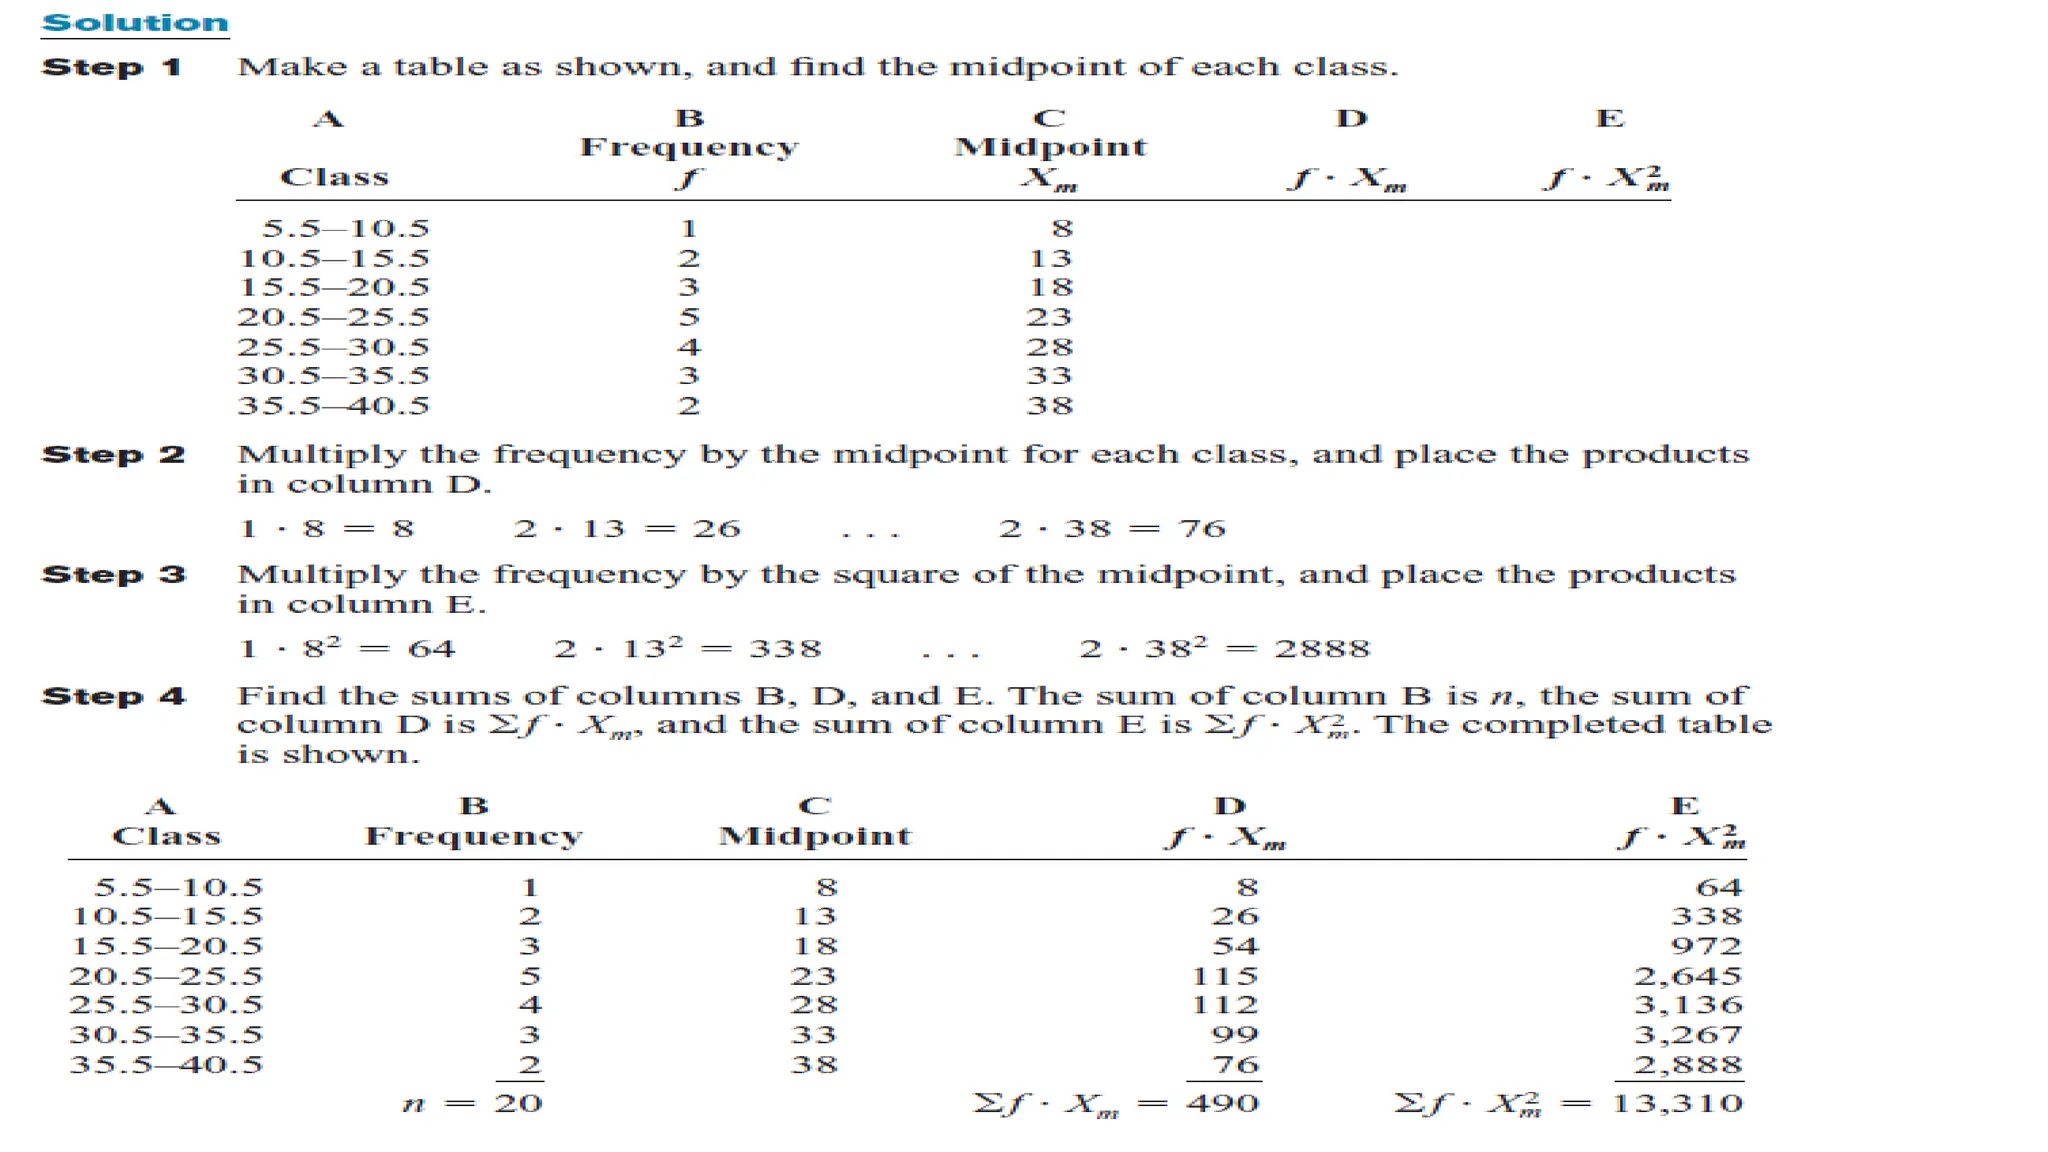
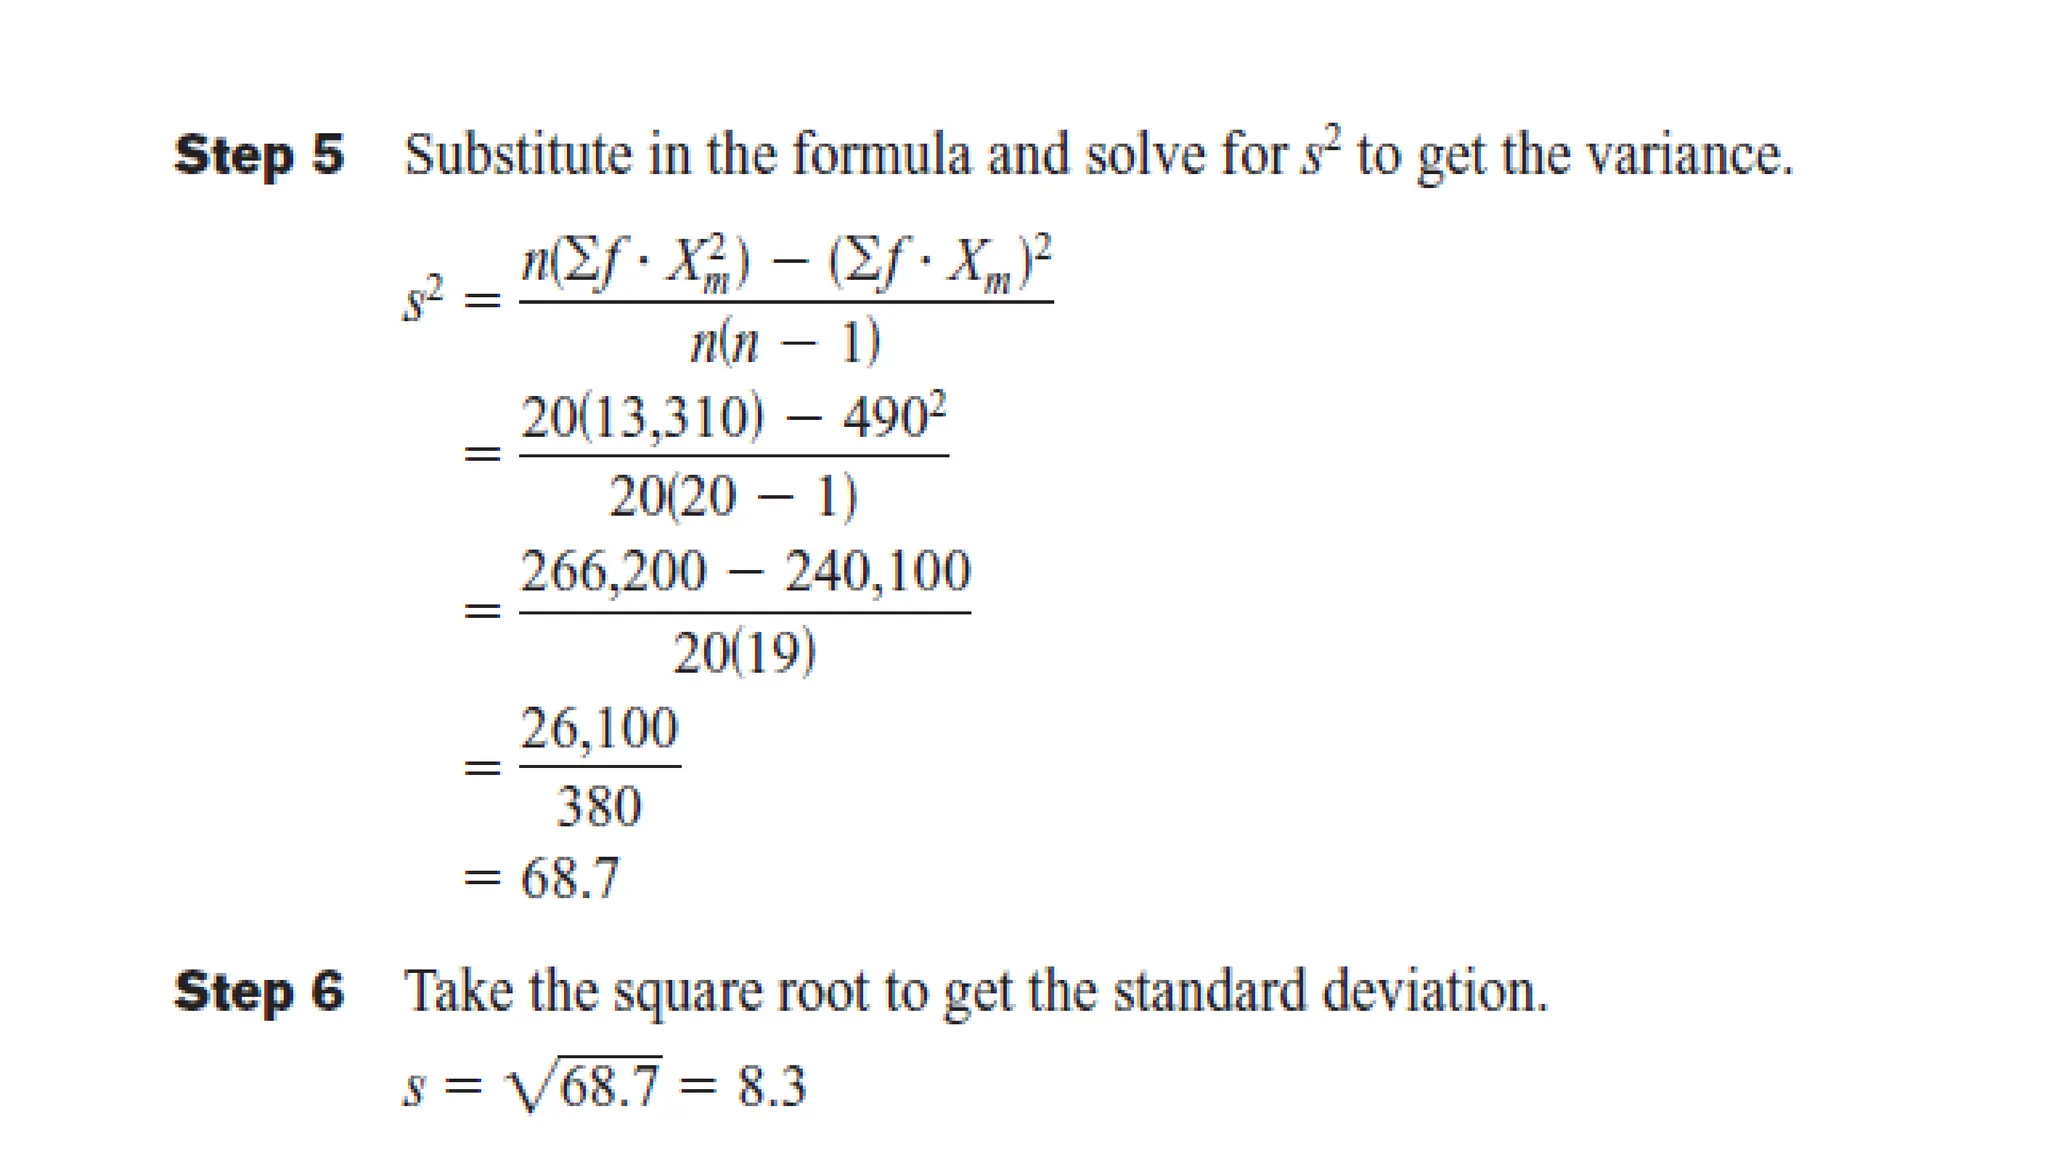
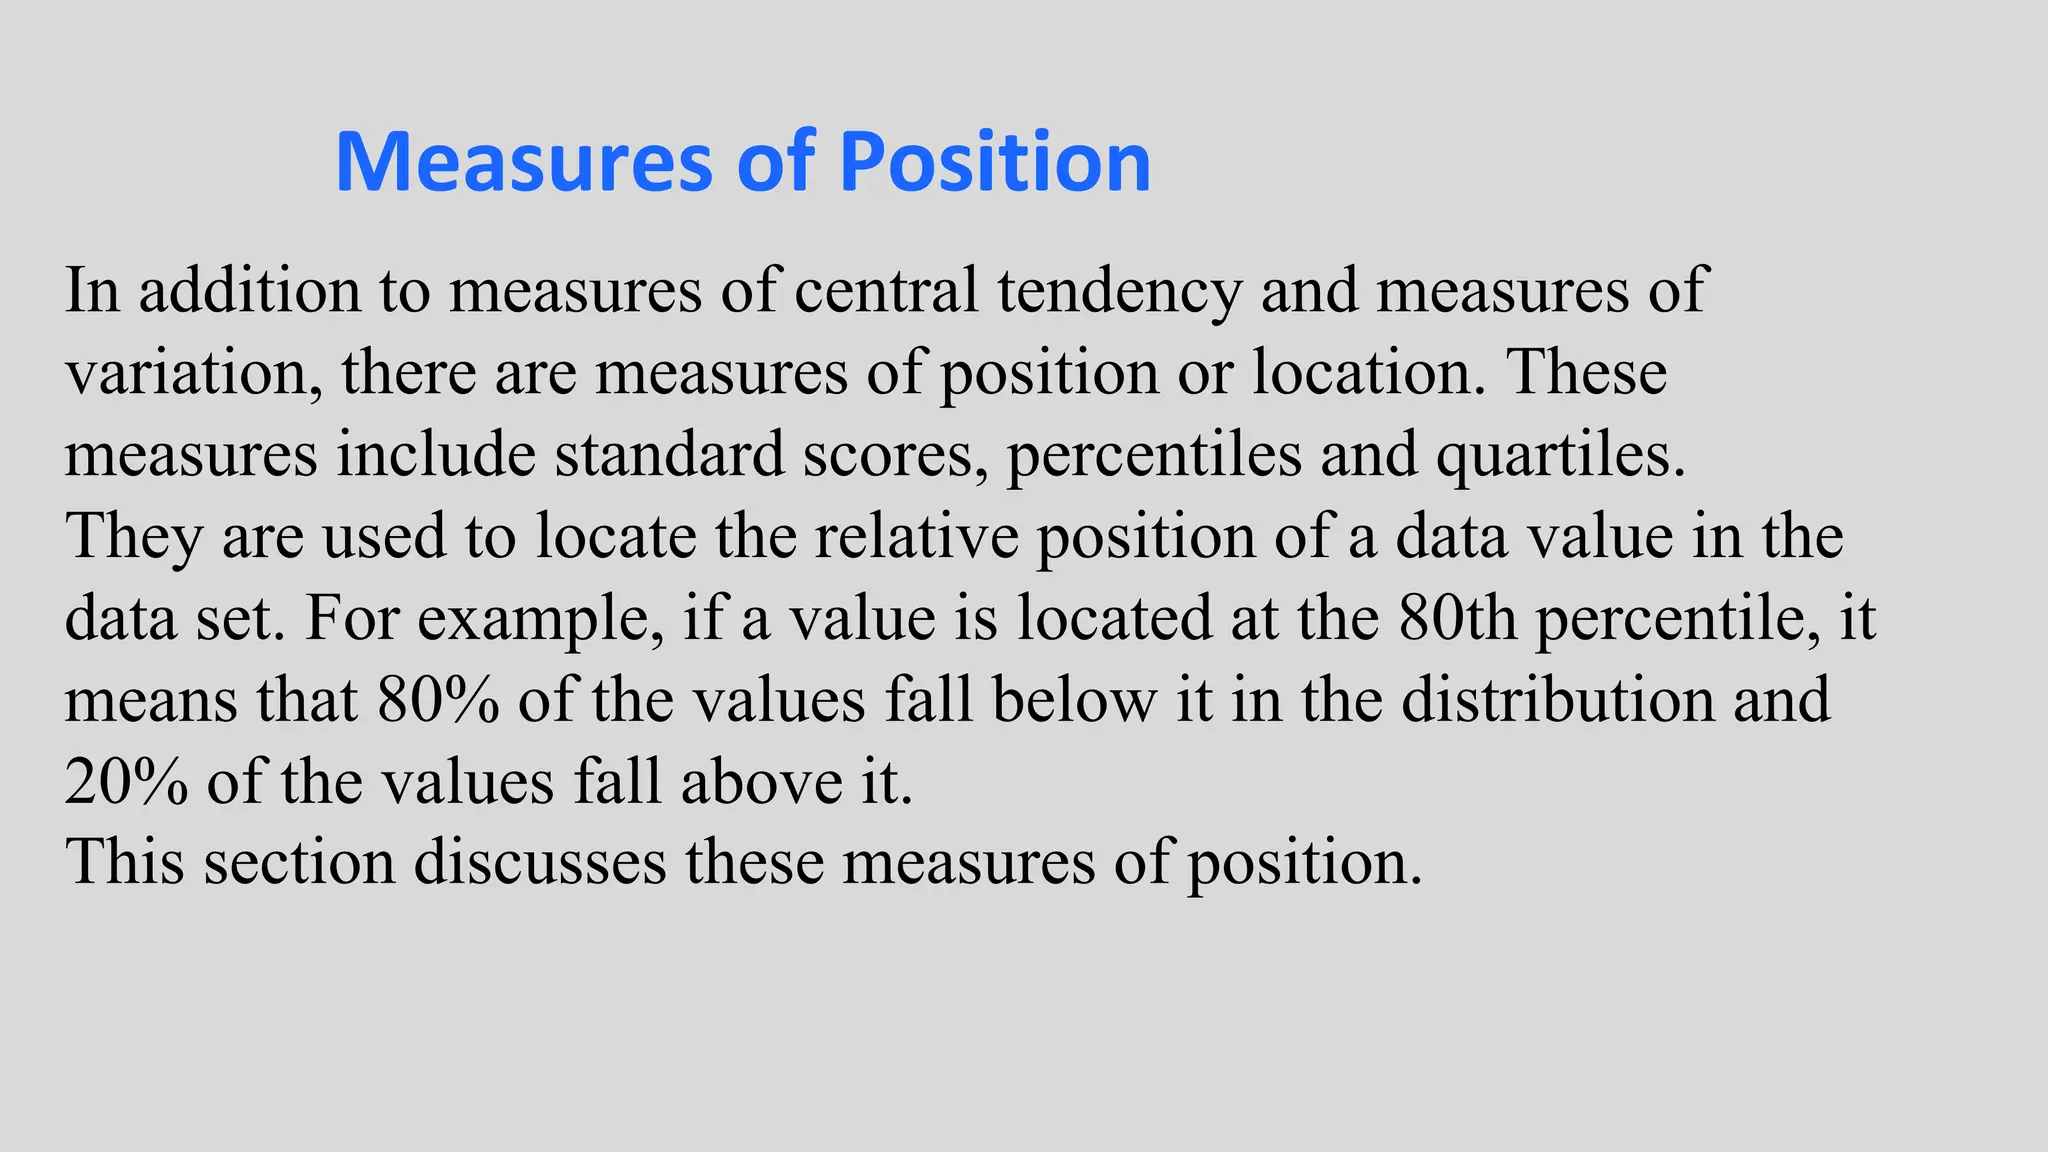
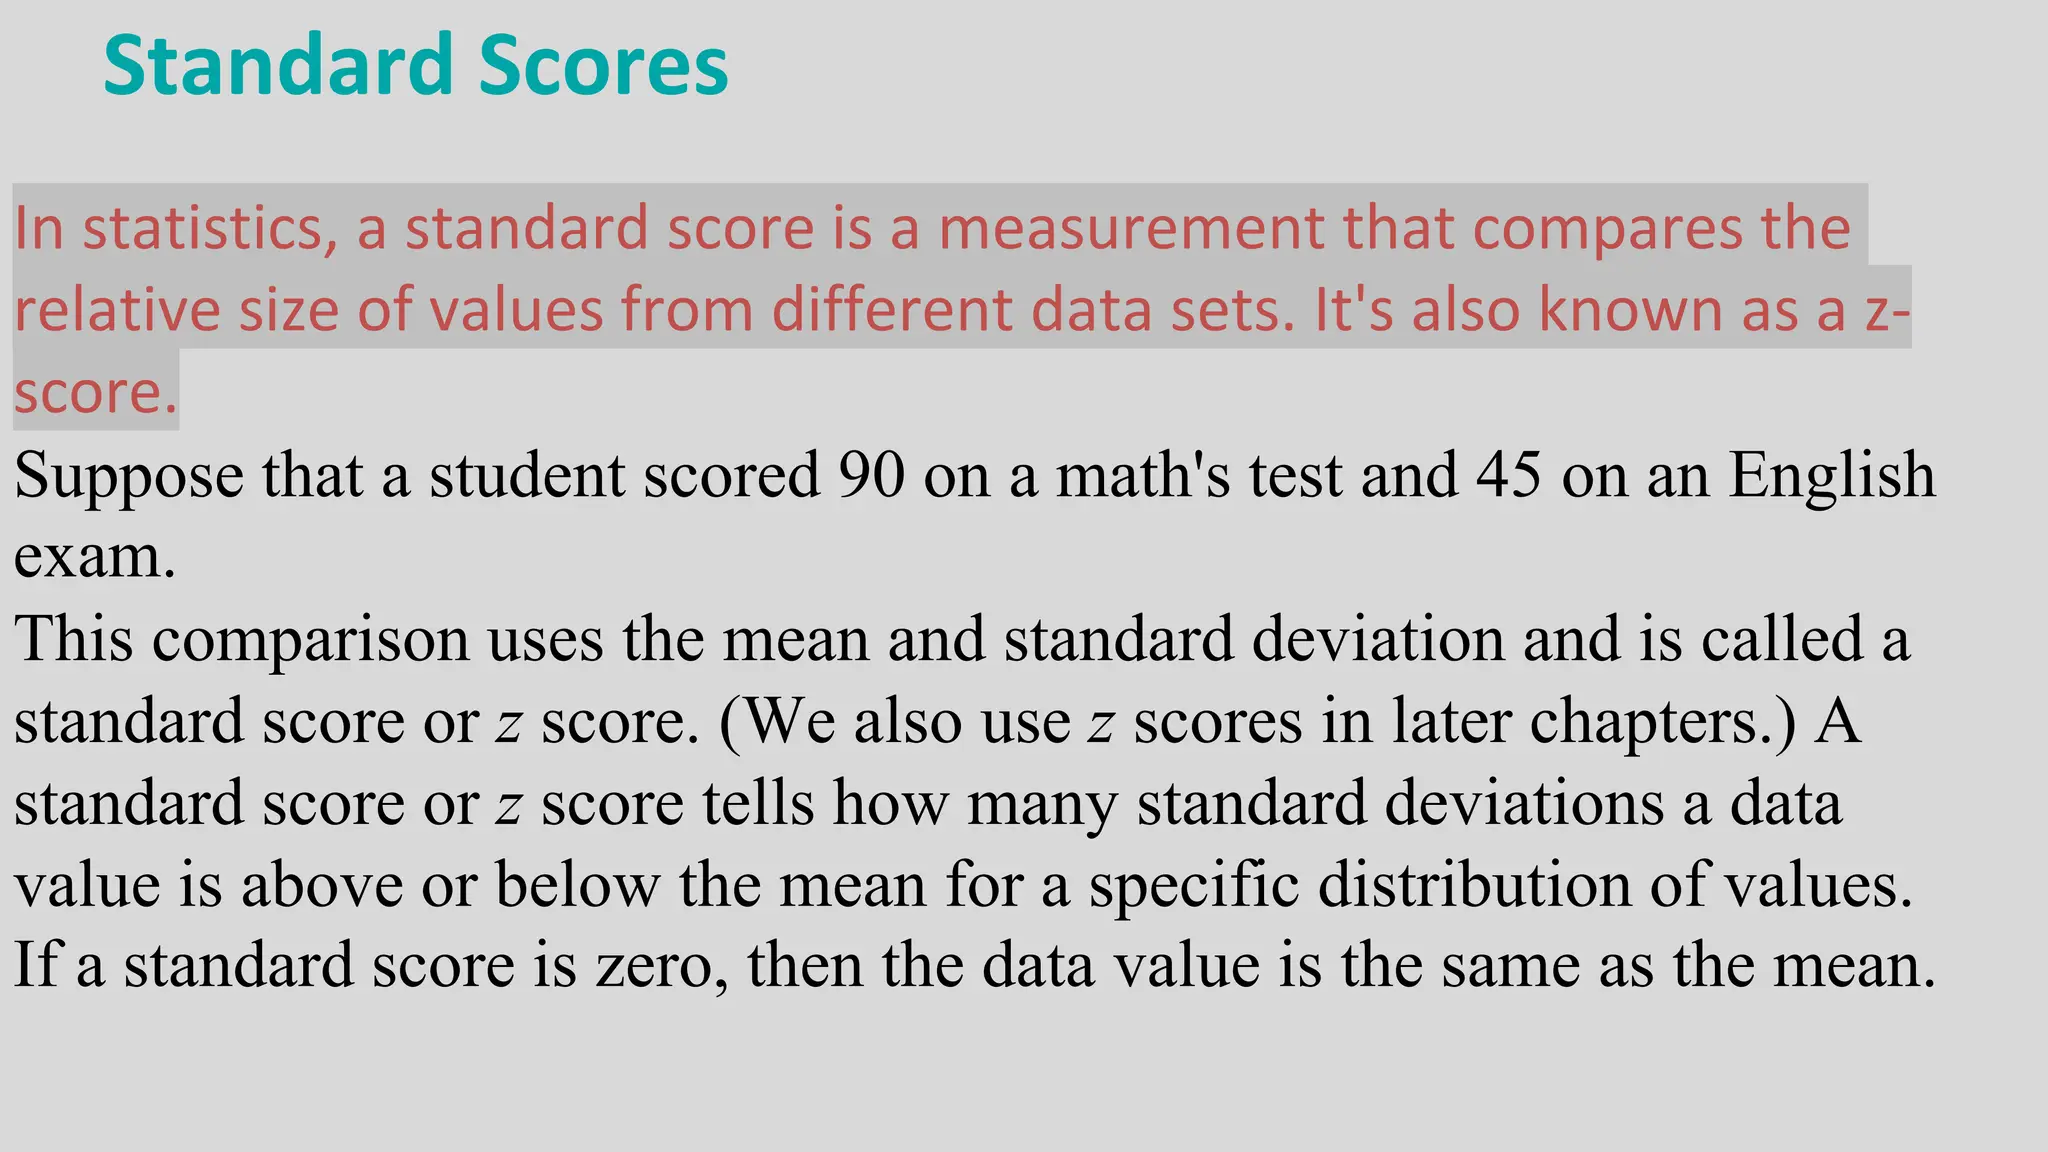
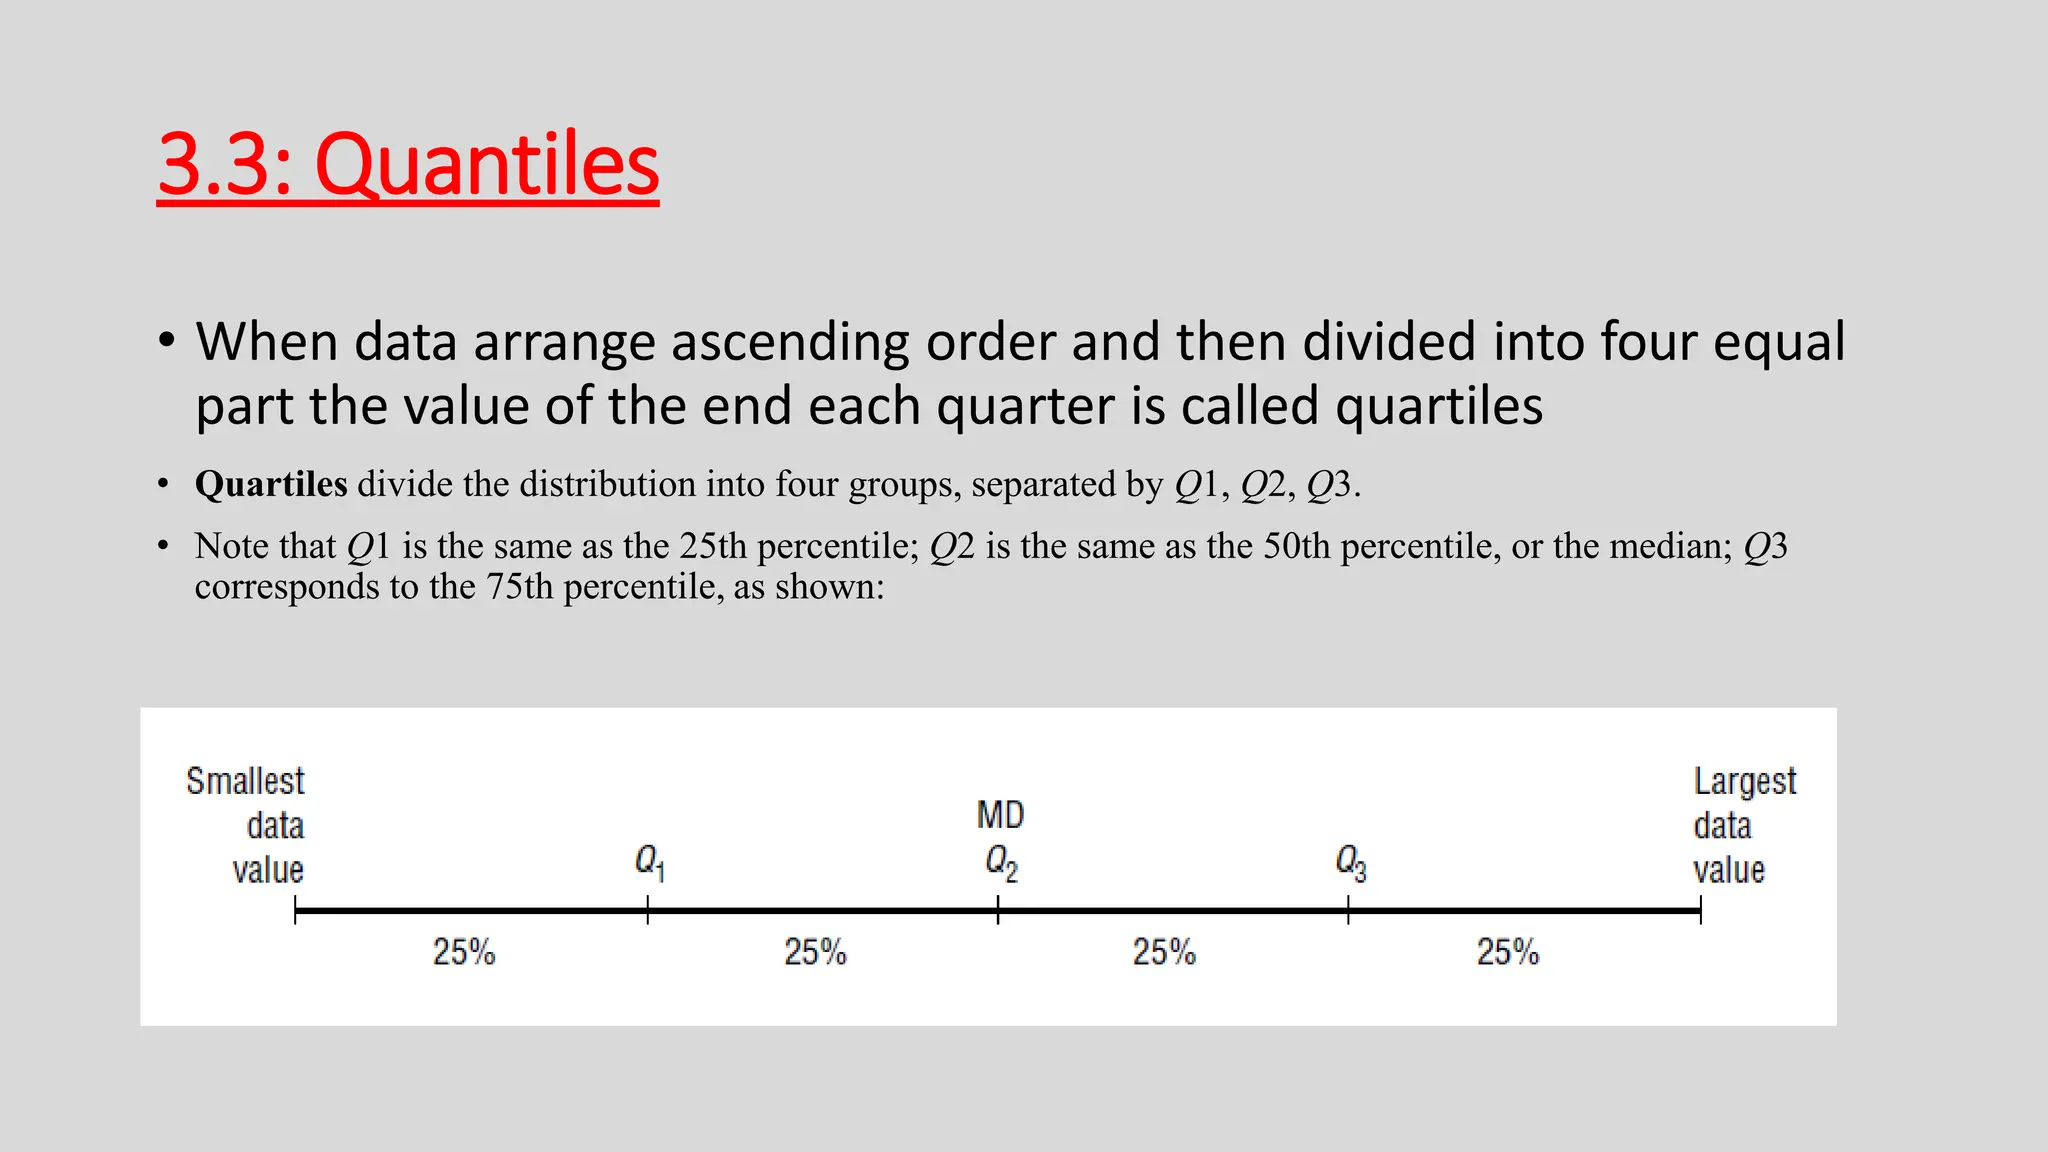
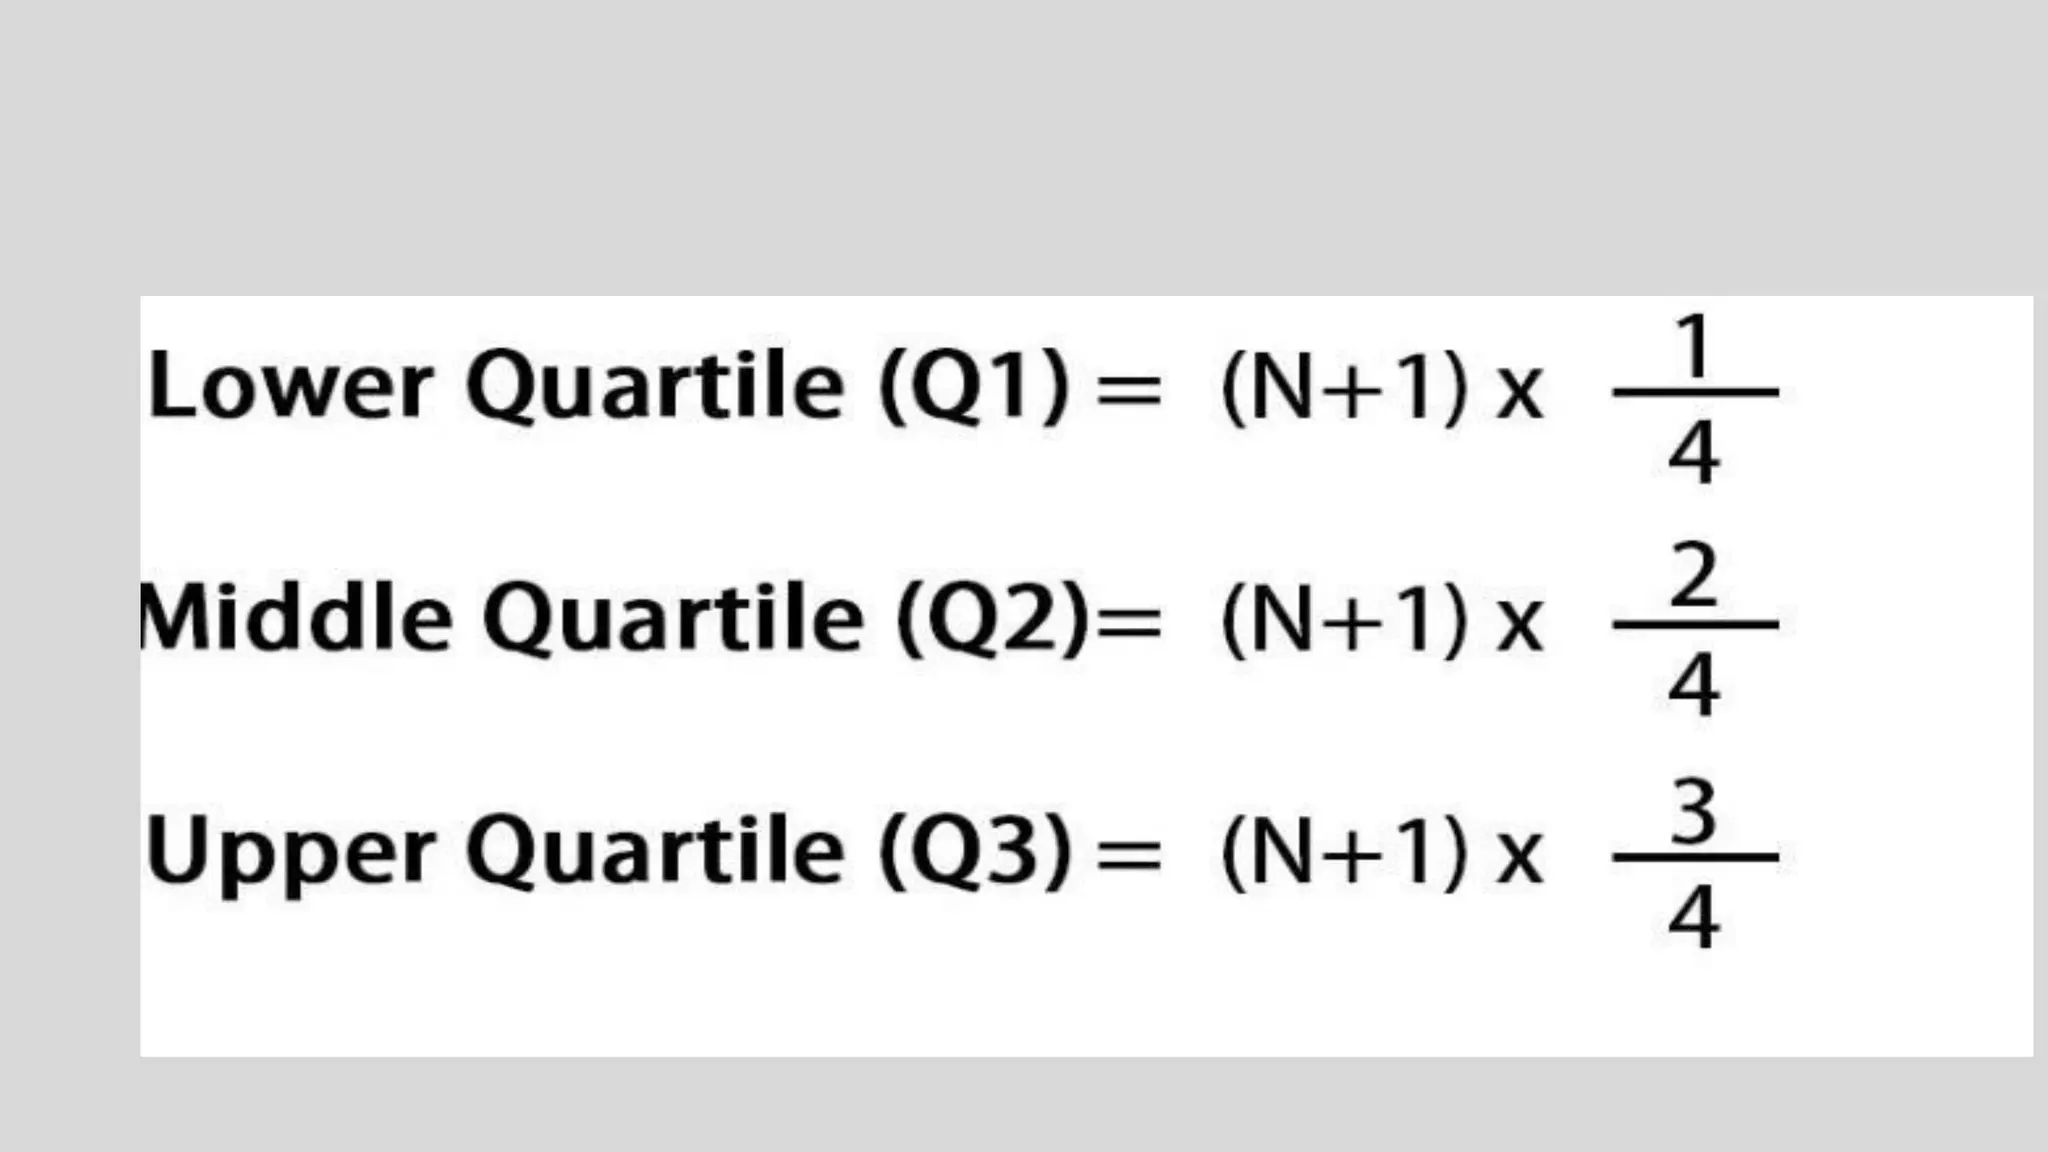
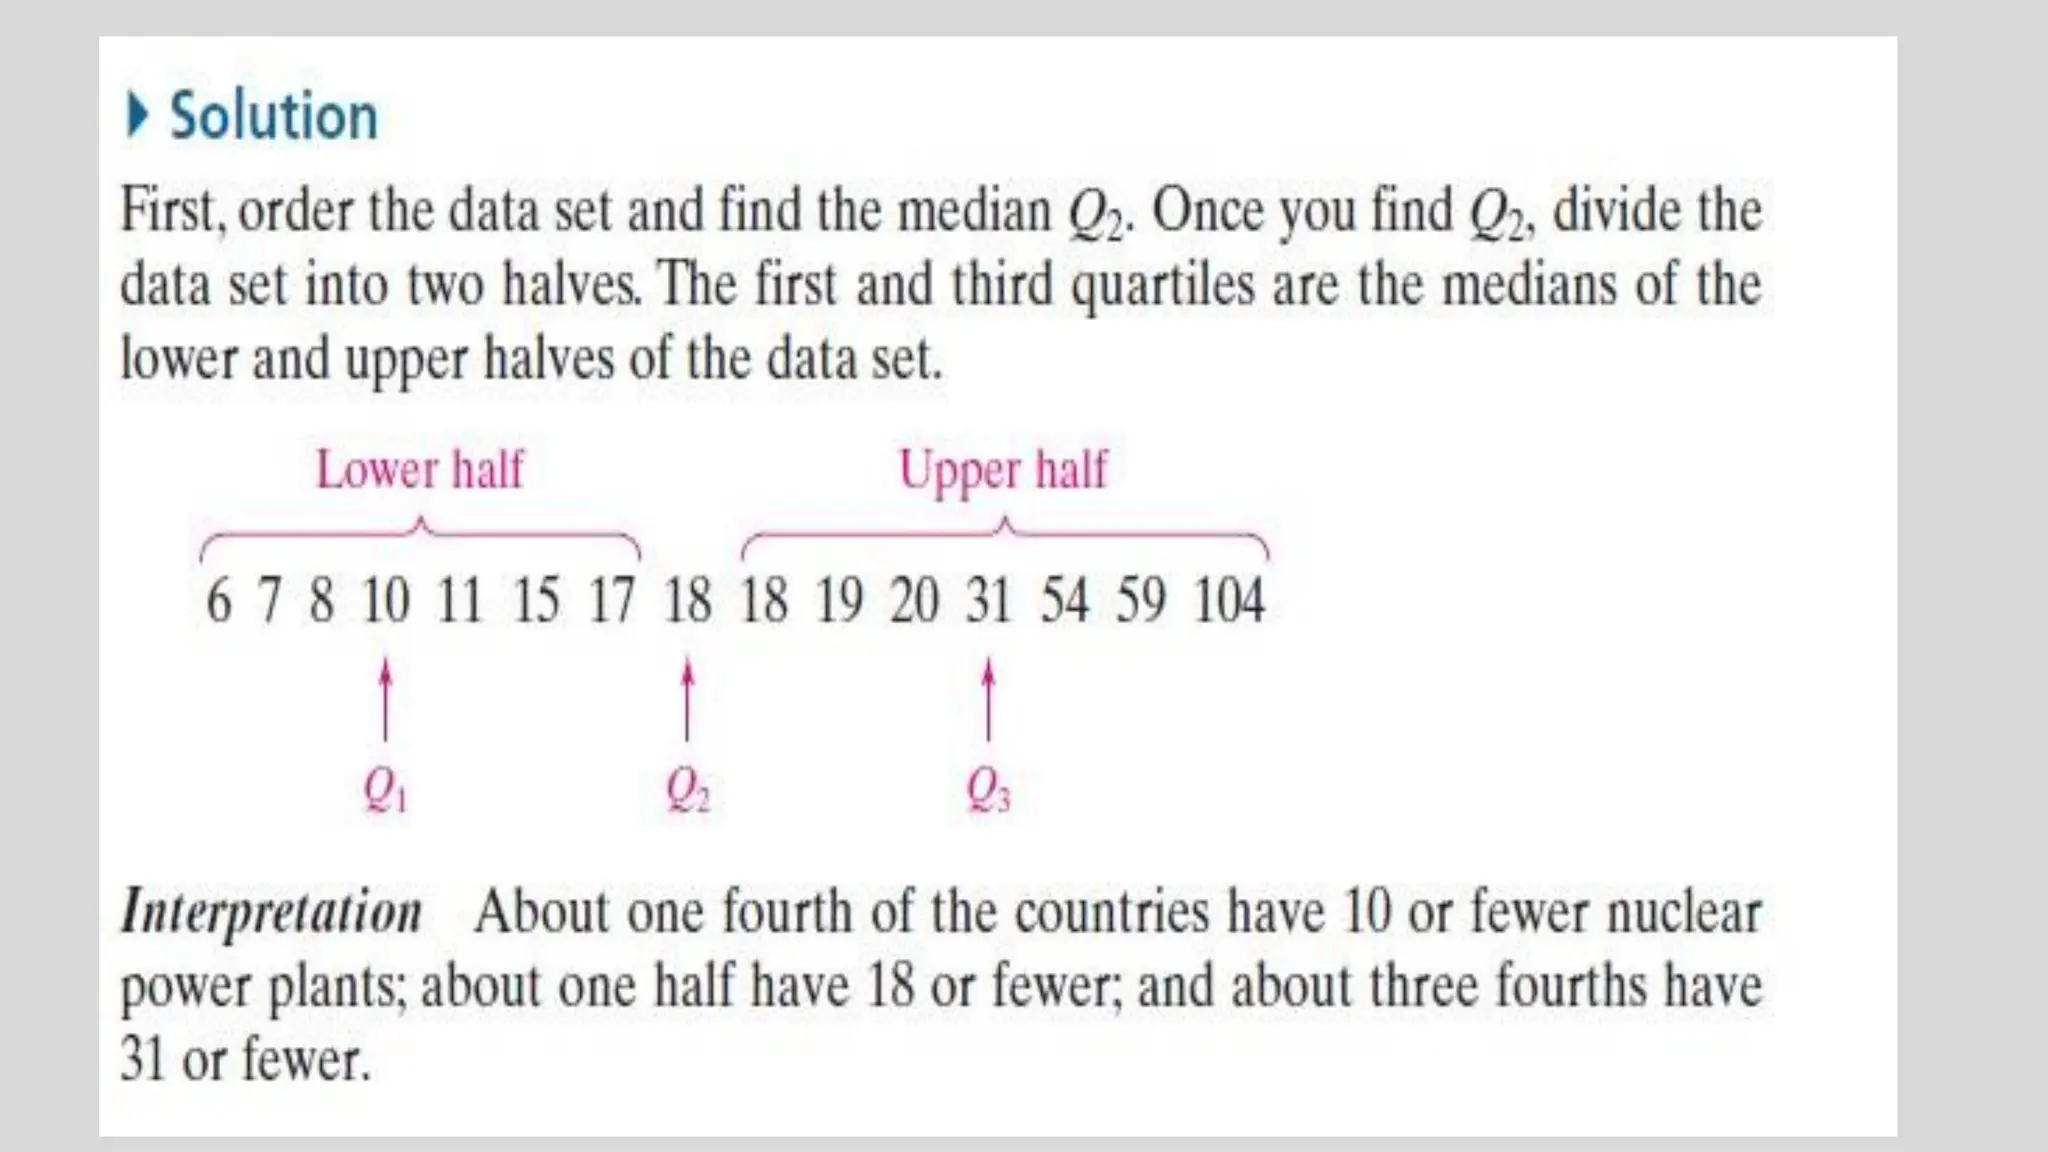
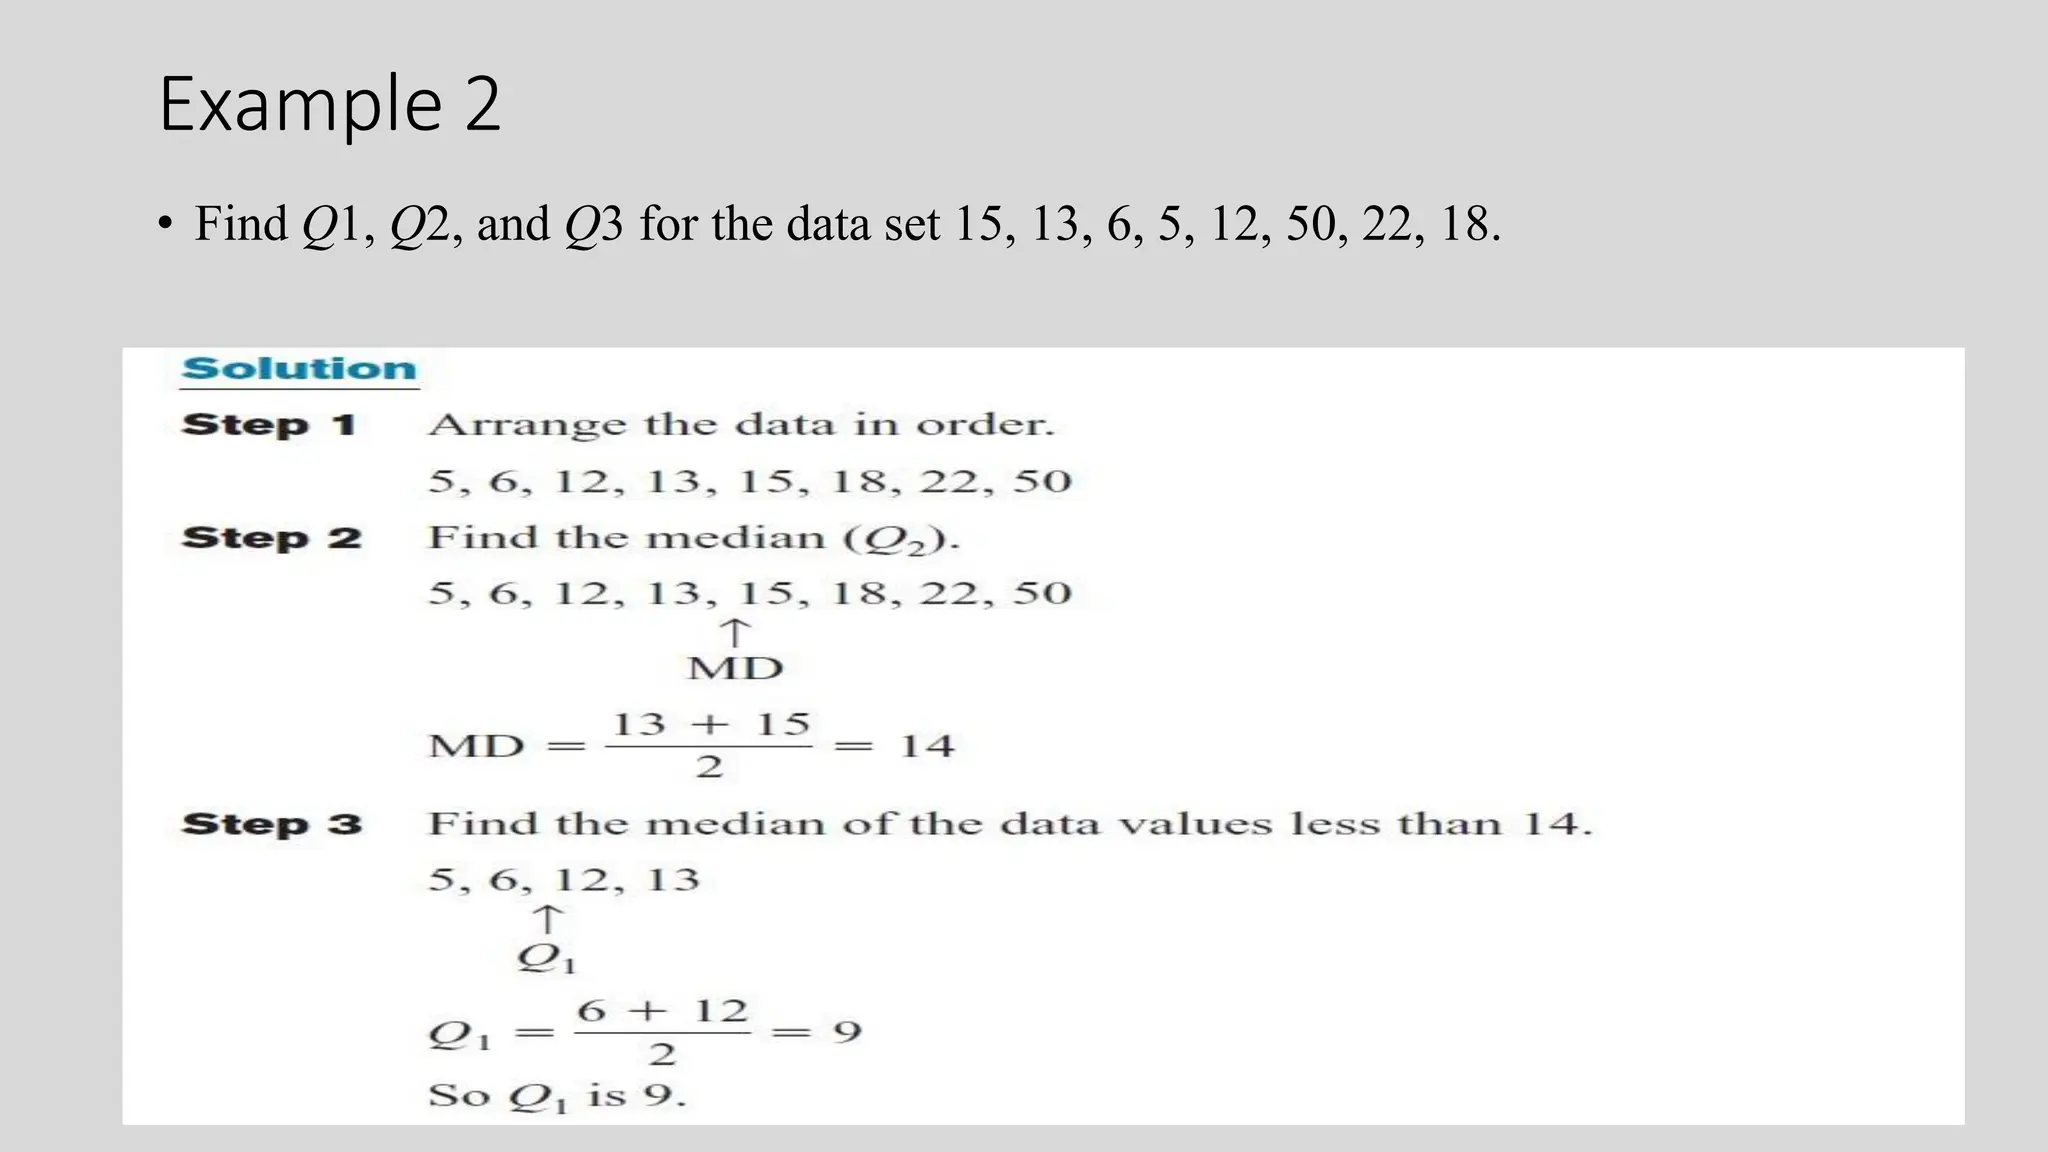
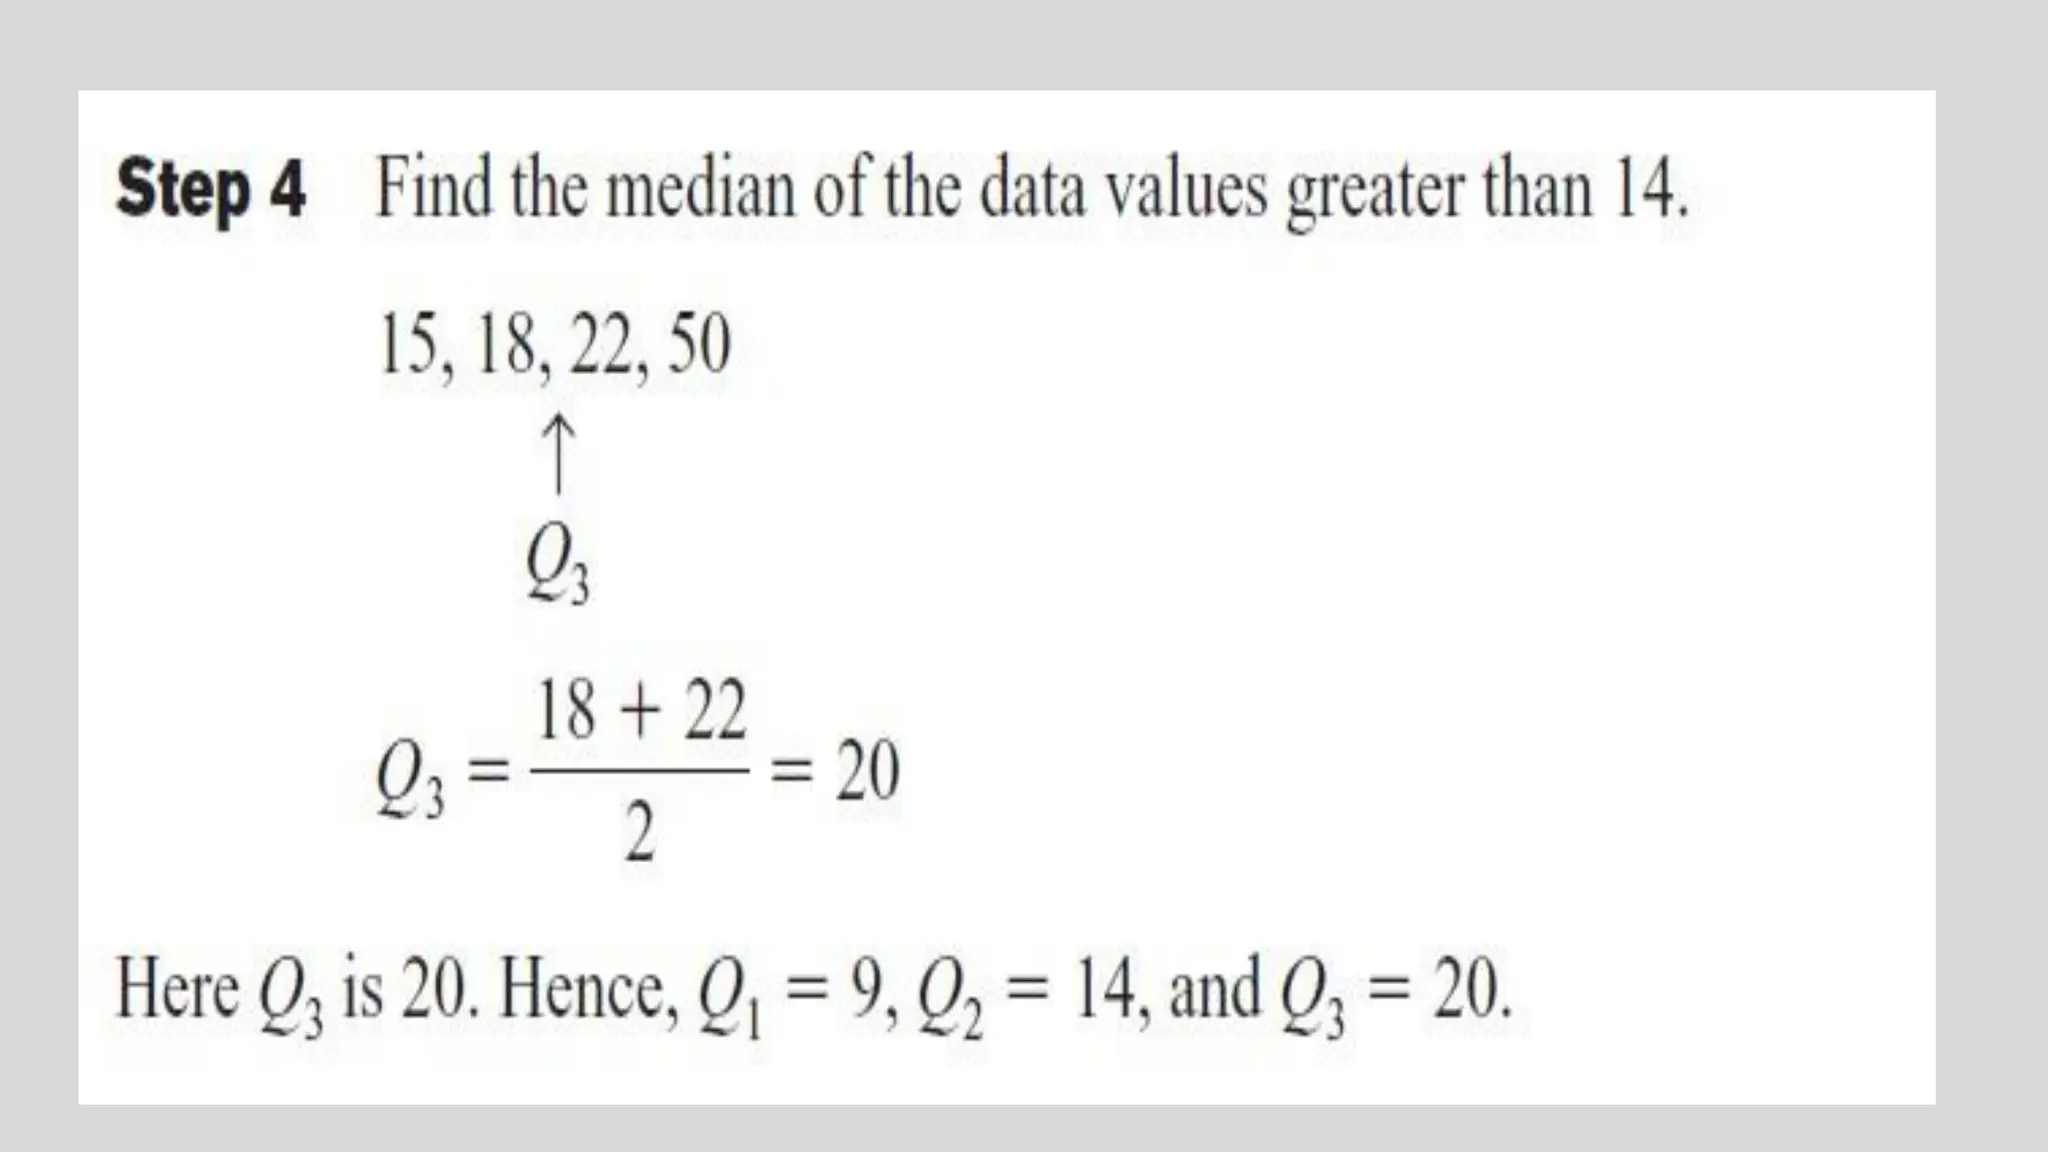
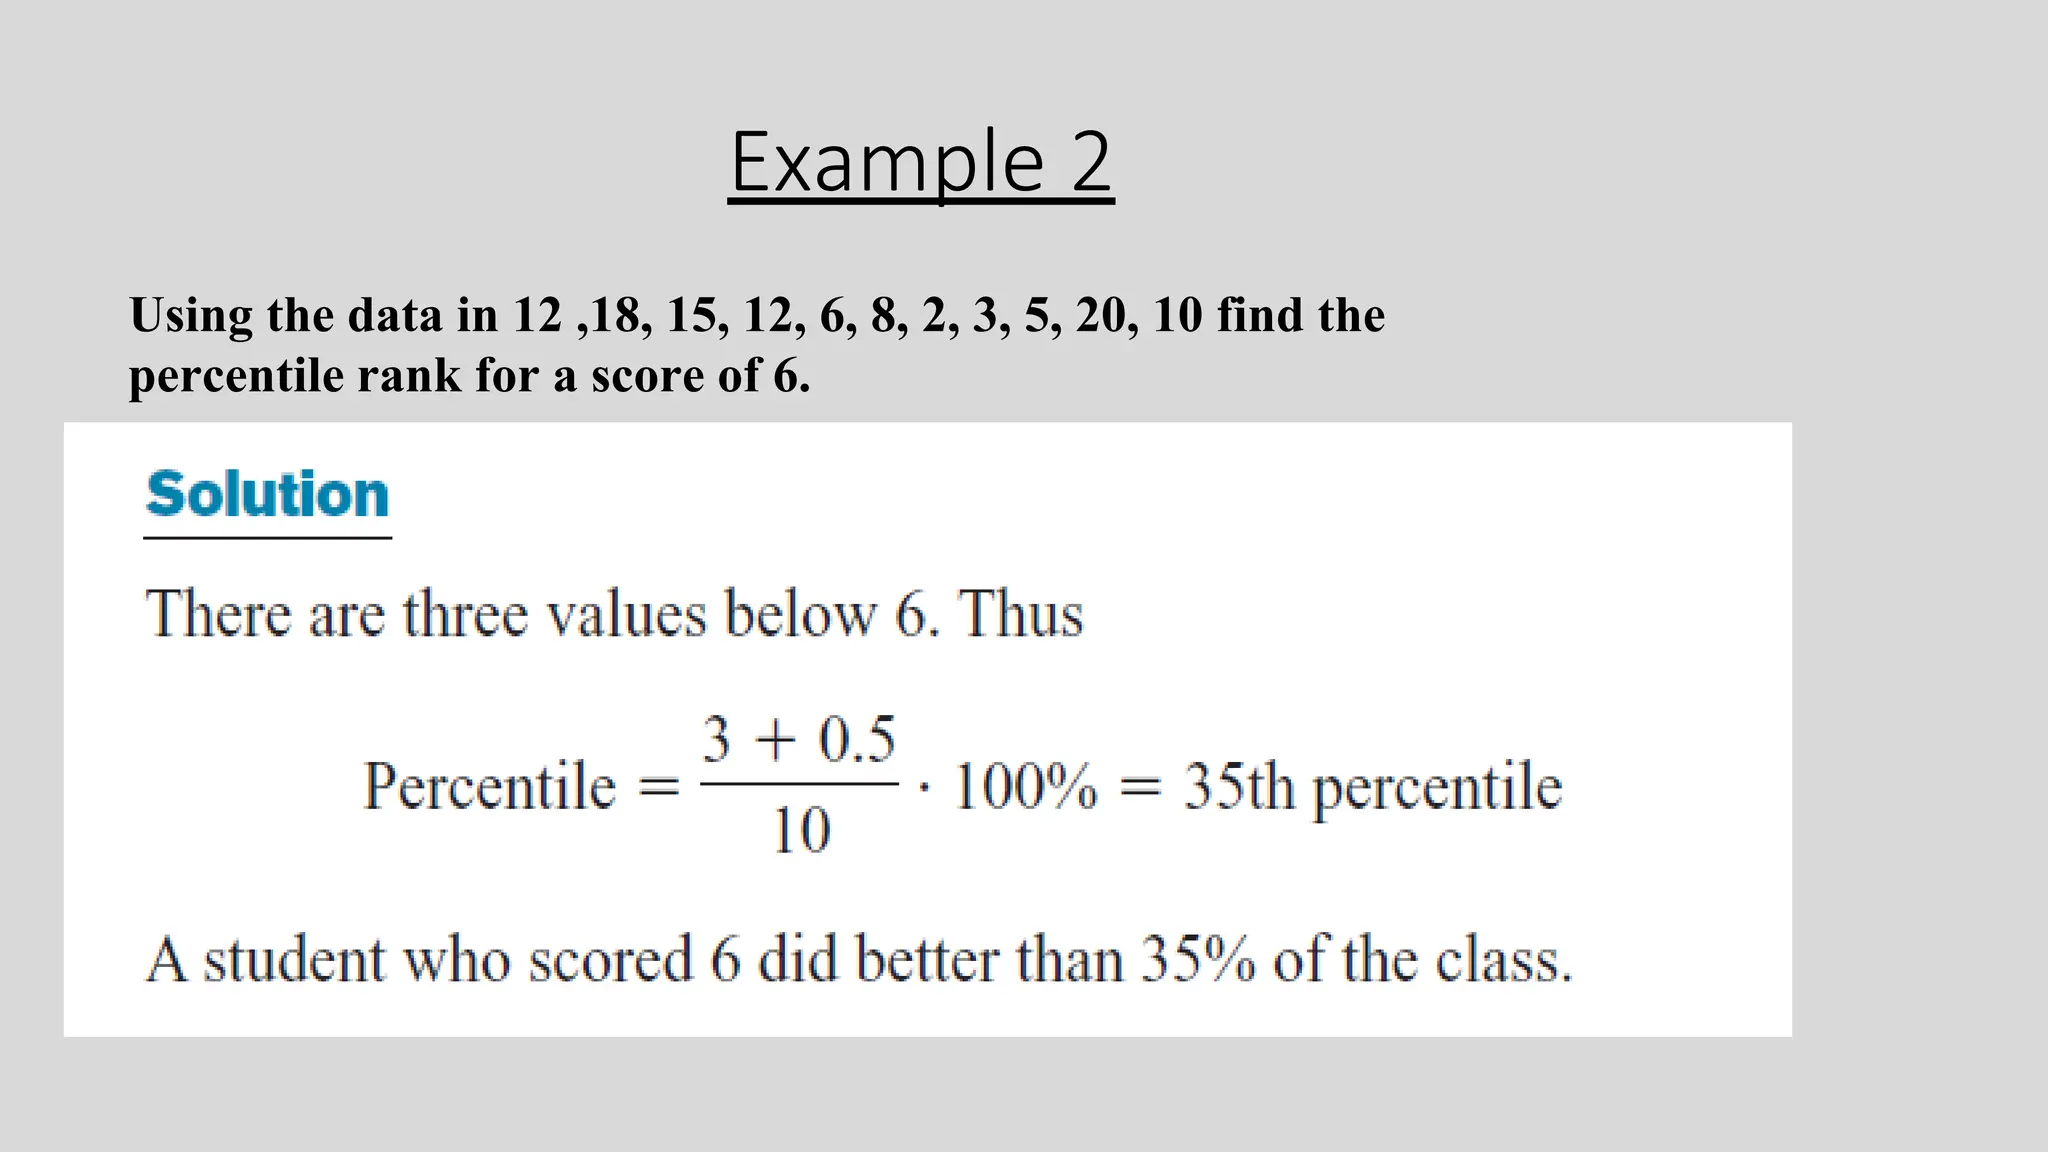
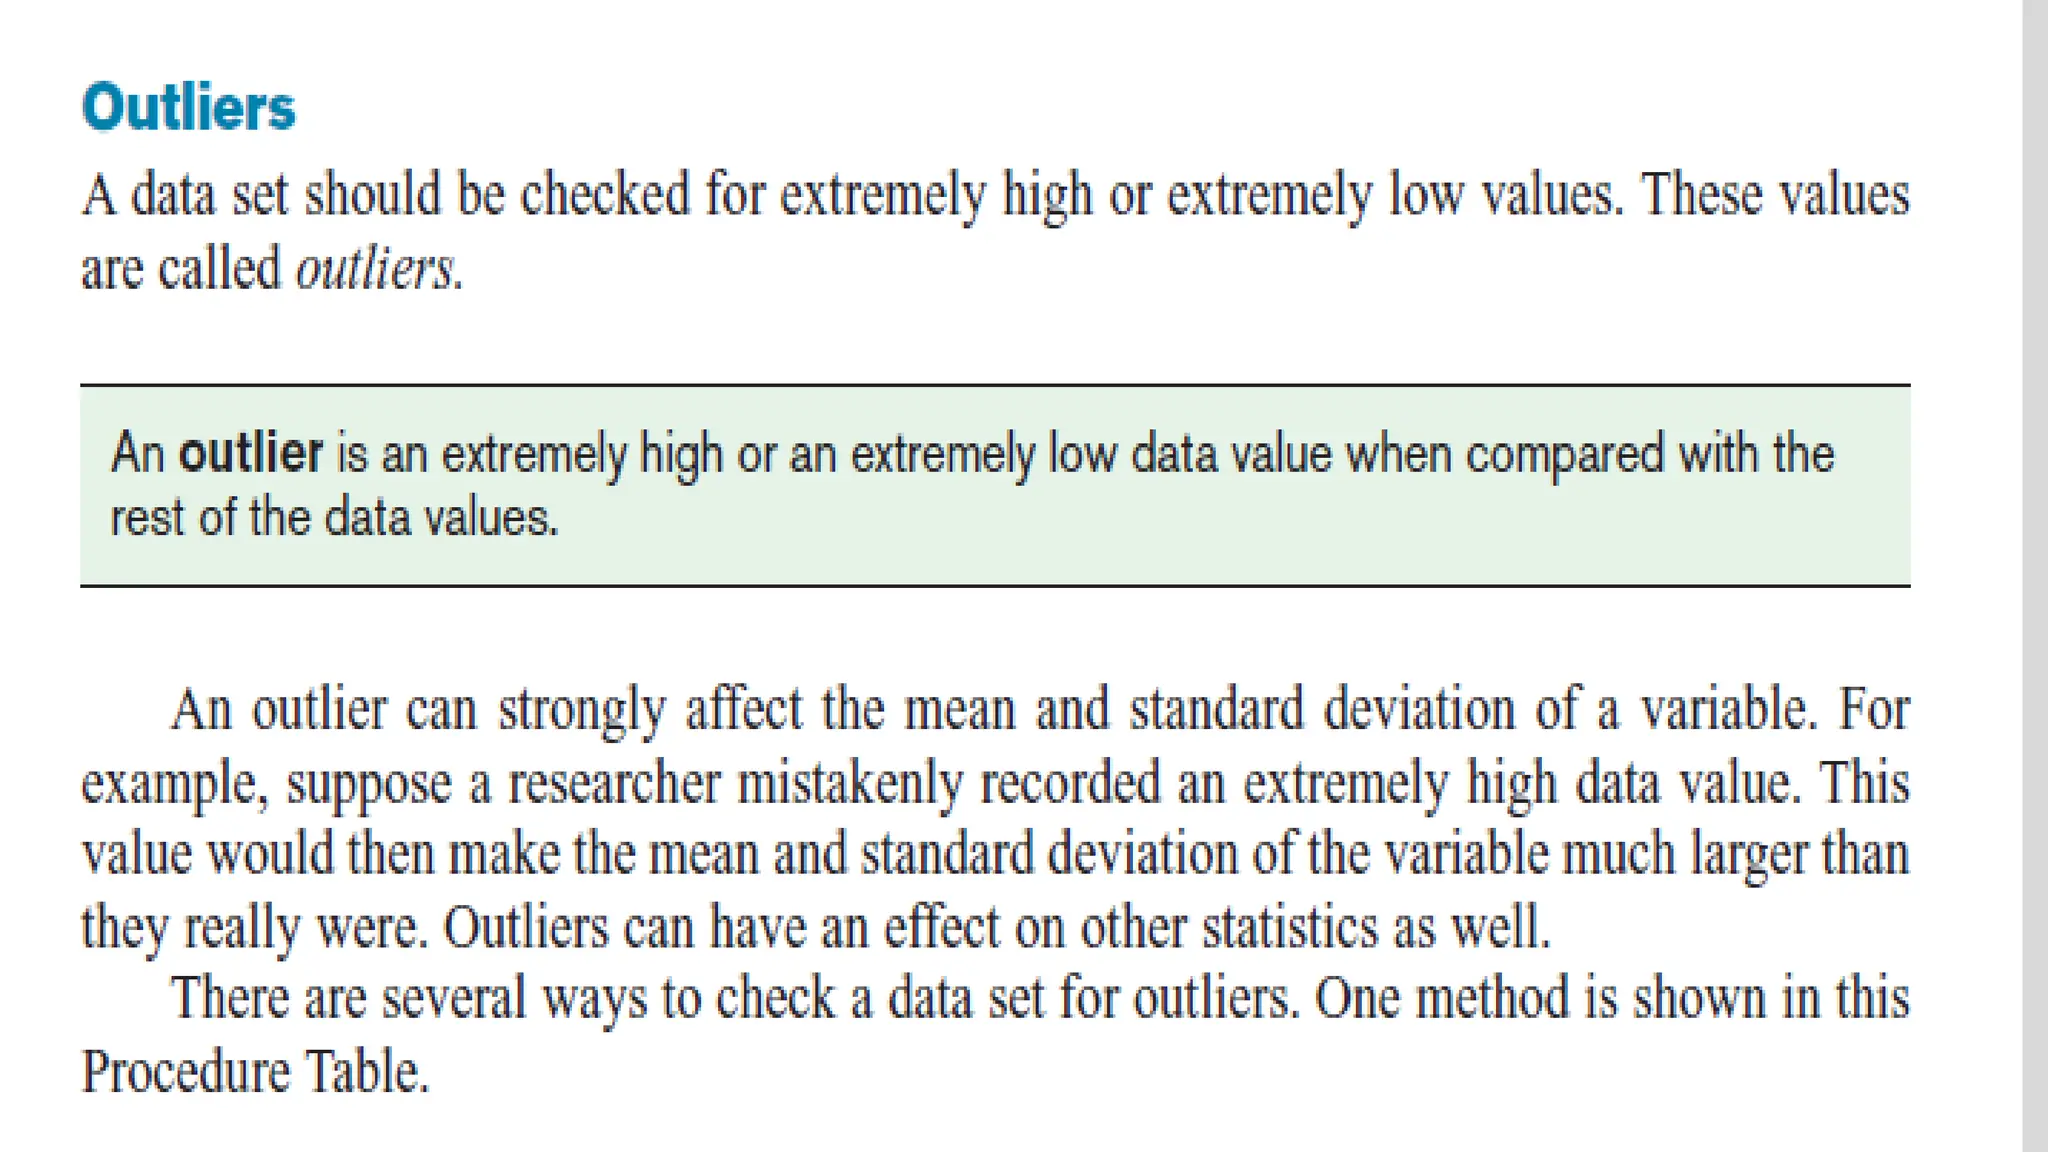
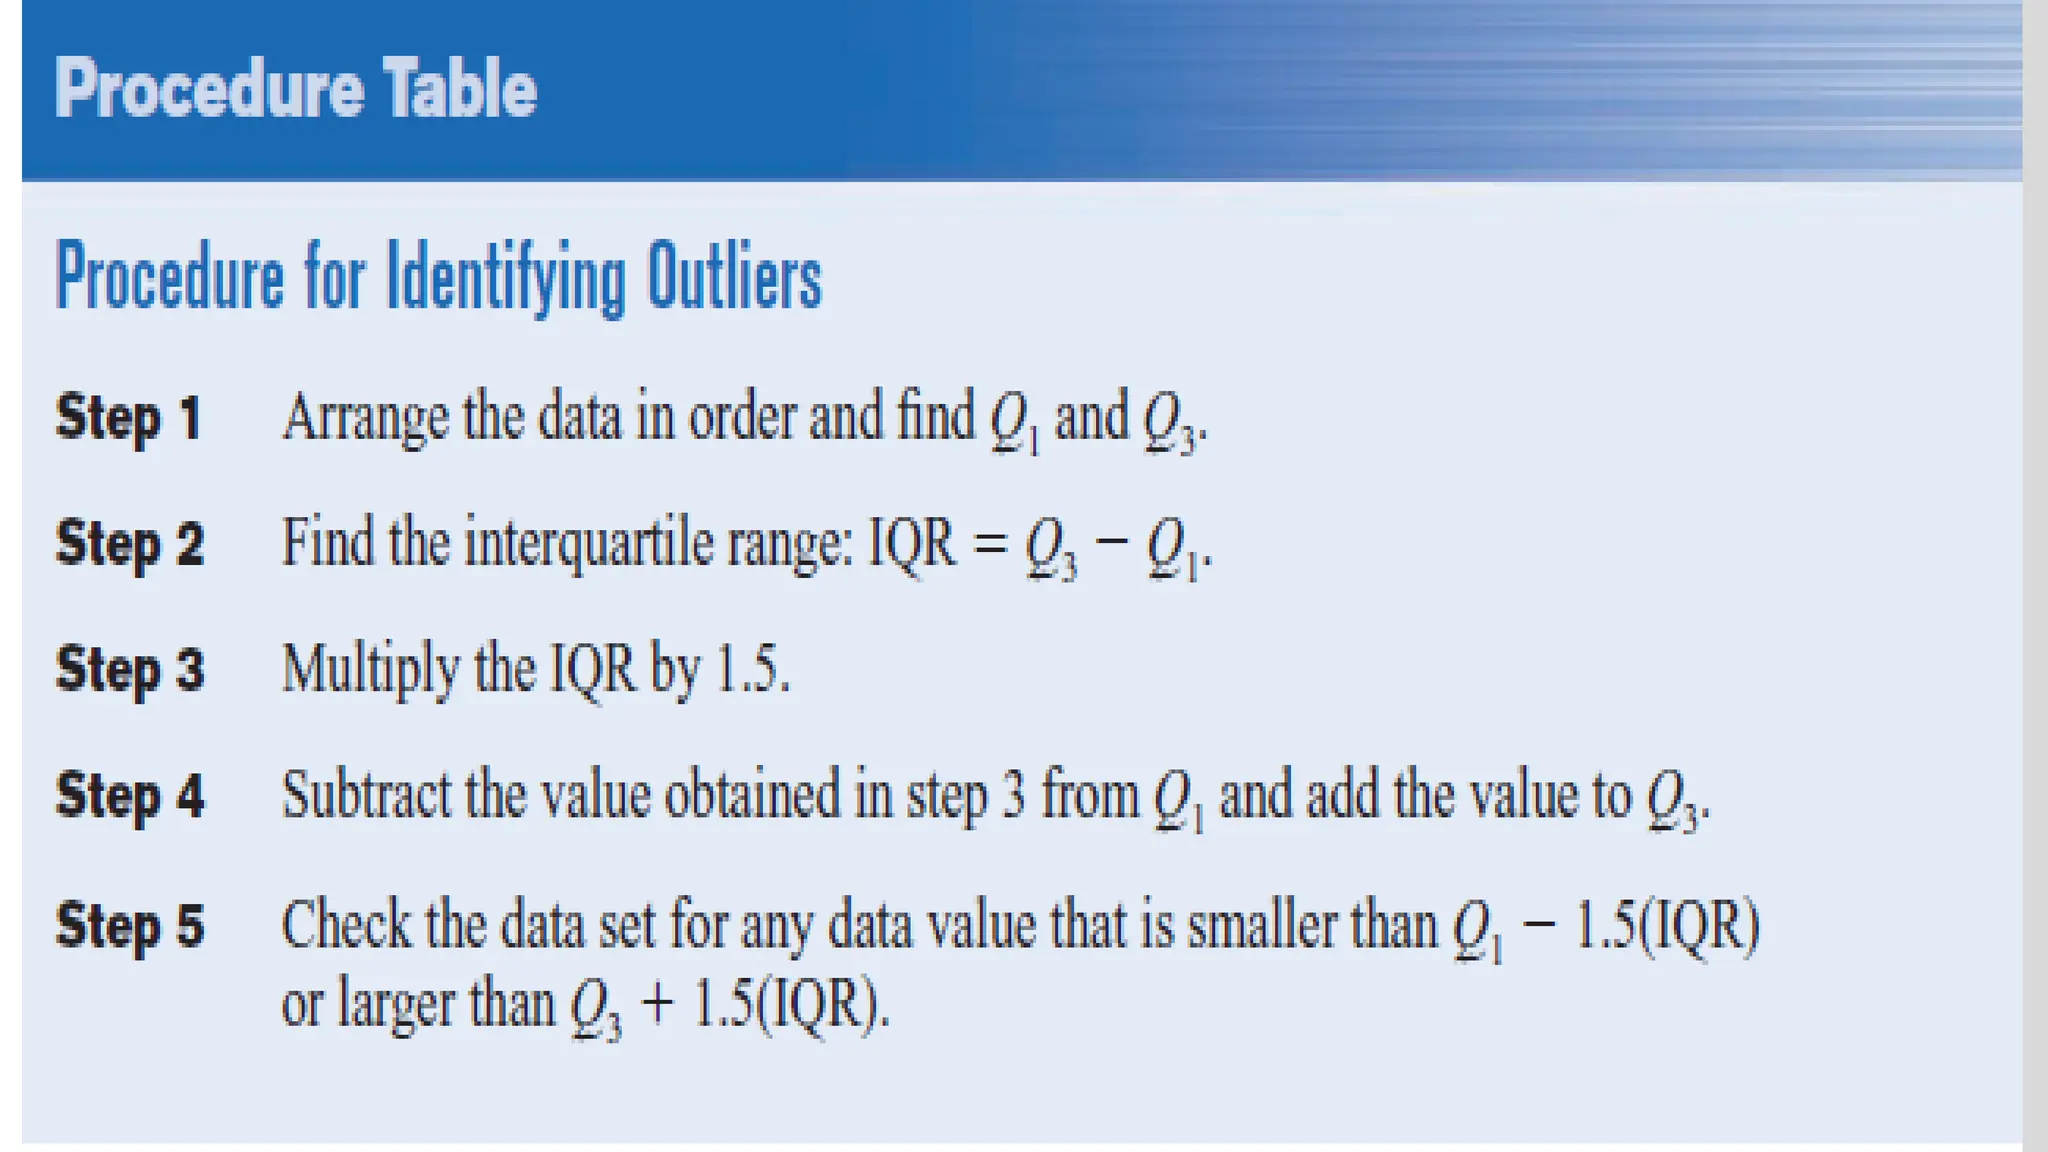
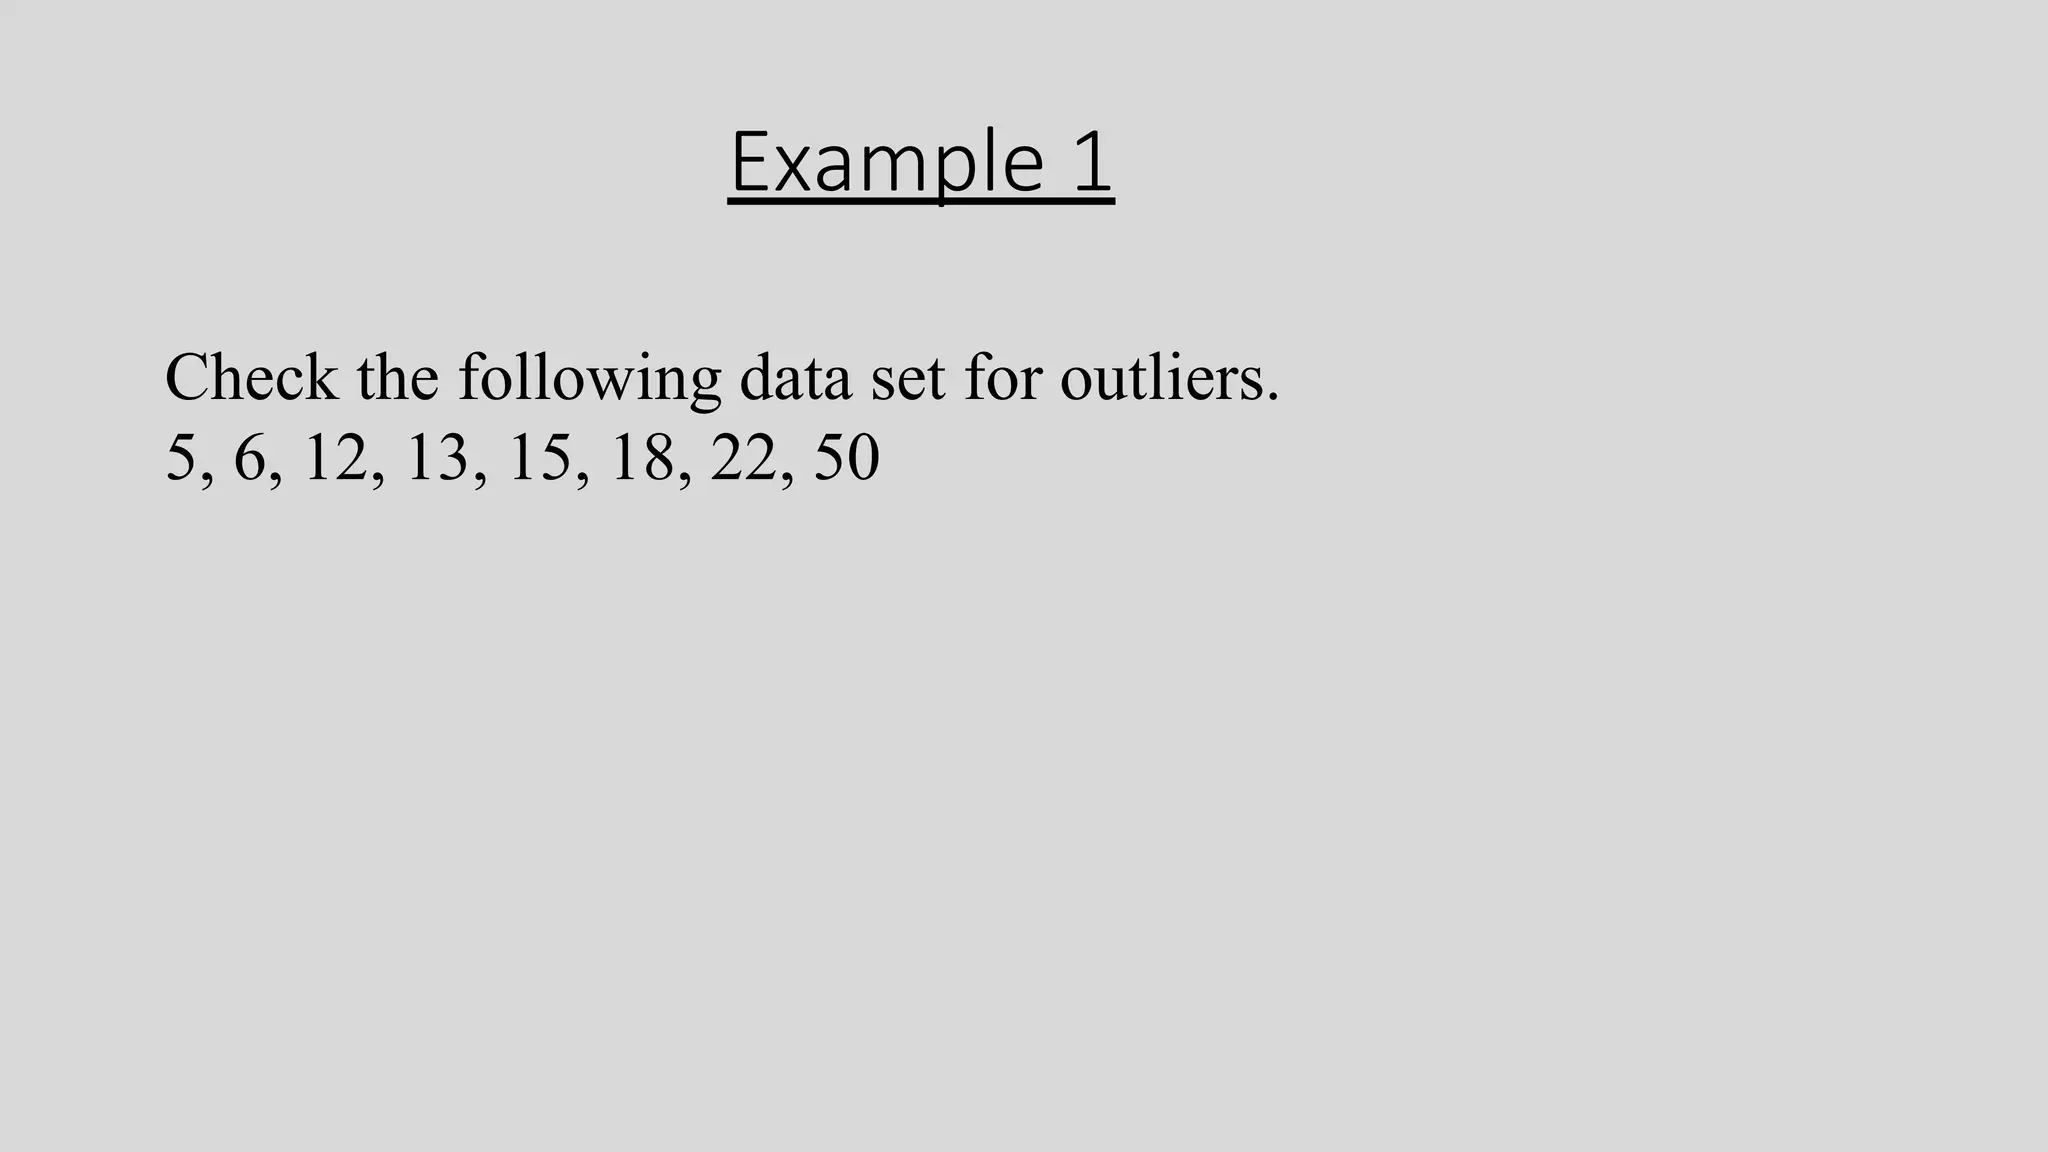
CHAPTER TWO
Data Description
Lecturer: Abdihakiim Dhagjar
Objectives
After completing this chapter, you should be able to
1 Summarize data, using measures of central tendency, such
as the mean, median, mode, and midrange.
2 Describe data, using measures of variation, such as the
range, variance, and standard deviation.
3 Identify the position of a data value in a data set, using
various measures of position, such as percentiles, deciles, and
quartiles.
• A measure of central tendency is a single value that attempts to
describe a set of data by identifying the central position within that
set of data.
• As such, measures of central tendency are sometimes called
measures of central location.
• They are also classed as summary statistics. The mean (often called
the average) is most likely the measure of central tendency that you
are most familiar with, but there are others, such as the median and
the mode.
2.0 Measures of Central
➢The difference measures of central tendency are:
❖ Mean
❖Median
❖ Mode
❖Mid range
1.The Arithmetic Mean or simple
Mean
• Definition: the arithmetic mean is the sum of all observations divided by the number of
observations. It is written in statistical terms as:
Example 1
• One measure of central location for this sample is the arithmetic mean ; it is usually denoted by .
• Suppose the sample consists of birth weights (in grams) of all live born infants born at a private
hospital in a city, during a 1-week period. This sample is shown in the following table:
Example 2
• The data represent the number of days off per year for a sample of
individuals selected from nine different countries. Find the mean.
• 20, 26, 40, 36, 23, 42, 35, 24, 30
Example 3
• Using the frequency distribution for Example previous find the mean.
The data represent the number of miles run during one week for a
sample of 20 runners.
Work out
• The data shown represent the number of nurses registrations for six counties in
southwesternAfrica . Find the mean.
• 3782, 6367, 9002, 4208, 6843, 1108
Try it
Percentage of College-Medical Science Population over 25
Below are the percentages of the population over 25 years of age who have completed 4 years of college or more
Find the mean and modal class.
2. Median
• An alternative measure of central location, perhaps second in popularity to the arithmetic mean, is
the median.
• Suppose there are n observations in a sample. If these observations are ordered from smallest to
largest, then the median is defined as follows:
Example 1
• The number of rooms in the seven hospital in east Africa is 713, 300, 618, 595,
311, 401, and 292. Find the median.
• Solution
Step 1 Arrange the data in order.
292, 300, 311, 401, 595, 618, 713
Step 2 Select the middle value.
292, 300, 311, 401, 595, 618, 713
Median
Hence, the median is 401 rooms
Example: 2
Compute the sample median for the birth weight data
3484, 2581, 2759, 2834, 4146,2838, 2841, 3031, 3101, 3200, 3245, 3248,
3260, 3265, 3314, 3323,, 3541, 3609, 3649, 2069.
Solution:
First arrange the sample in ascending order
2069, 2581, 2759, 2834, 2838, 2841, 3031, 3101, 3200, 3245, 3248,
3260, 3265, 3314, 3323, 3484, 3541, 3609, 3649, 4146
Since n=20 is even,
Median = average of the 10th and 11th largest observation =
(3245 + 3248)/2 = 3246.5 g
Try it
1.The number of patients that in hospital the United States. Find the median.
684, 764, 656, 702, 856, 1133, 1132,
2.The number of cloudy days for the top 10 cloudiest cities is shown. Find the
median.
209, 223, 211, 227, 213, 240, 240, 211, 229, 212
3.The Mode
The third measure of average is called the mode. The mode is the value that occurs most often in the data
set. It is sometimes said to be the most typical case.
The value that occurs most often in a data set is called the mode.
Adata set that has only one value that occurs with the greatest frequency is said to be unimodal.
If a data set has two values that occur with the same greatest frequency, both value are considered to be
the mode and the data set is said to be bimodal.
If a data set has mor than two values that occur with the same greatest frequency, each value is used as the
mode, and the data set is said to be multimodal.
When no data value occurs more than once, the data set is said to have no mode.
Adata set can have more than one mode or no mode at all. These situations will be shown in some of the
examples that follow.
Example 1
Find the mode of the bonuses of eight hospital given for a specific year. The
bonuses in millions of dollars are
18.0, 14.0, 34.5, 10, 11.3, 10, 12.4, 10
Solution
It is helpful to arrange the data in order although it is not necessary.
10, 10, 10, 11.3, 12.4, 14.0, 18.0, 34.5
Since $10 million occurred 3 times—a frequency larger than any other number—the
mode is $10 million.
Example 2
The average mark of the students in the class test is, 12, 14, 17, 19, 15,
14, 13, 18,
16, 17, 11, 18. Find the mode?
Try it
• The data show the number of factors nuclear reactors in the United States for a
recent 15-year period. Find the mode.
104 104 104 104 104
107 109 109 109 110
109 111 112 111 109
try it
• A small dental pharmacy consists of the owner, the manager, the doctor , and two technicians, all
of whose annual salaries are listed here. (Assume that this is the entire population.)
• Staff Salary
• Owner
• Manager
• doctor
• Technician
• Technician
$50,000
20,000
12,000
9,000
9,000
Find the mean, median, and mode?
The Midrange
• The midrange is a rough estimate of the middle. It is found by adding
the lowest and highest values in the data set and dividing by 2 The
Midrange
.
Example
• In the last two winter seasons, the city of Borama , Saylac, reported
these numbers of water-line breaks per month. Find the midrange.
• 2, 3, 6, 8, 4, 1
Weighted mean
Aweighted arithmetic mean is similar to an ordinary arithmetic mean (the most common type
of average), except that instead of each of the data points contributing equally to the final
average, some data points contribute more than others. The notion of weighted mean plays a role
in descriptive statistics and also occurs in a more general form in several other areas of
mathematics.
Example 1
• Grade Point Average
• A student received an A in English Composition I (3 credits), a C in
Introduction to Psychology (3 credits), a B in Biology I (4 credits), and
a D in Physical Education (2 credits). Assuming A 4 grade points, B 3
grade points, C 2 grade points, D 1 grade point, and F 0 grade
points, find the student’s grade point average.
Solution
Example 2
Try it
2.2. measures of variation
• Measures of variation in statistics are ways to describe the distribution
or dispersion of data.
• It shows how far apart data points are from one another. Statisticians
use measures of variation to summarize their data.
• You can draw many conclusions by using measures of variation, such
as high and low variability.
• You can use measures of variation to measure, analyze or describe
trends in your data, which can apply to many careers that use statistics.
example
try it
Standard Deviation and Variance
• Standard deviation and variance are two basic mathematical concepts that
have an important place in various parts of the financial sector, from
accounting to economics to investing.
• Standard deviation is a statistical measurement that looks at how far a group
of numbers is from the mean. Put simply, standard deviation measures how
far apart numbers are in a data set.
• Avariance is the average of the squared differences from the mean.
• The variance defines a measure of the spread or dispersion within a set of
data. There are two types: the population variance, usually denoted by σ
and the sample variance is usually denoted by
e
Example 1
Find the deviation of each starting salary for CorporationAgiven in Example 1.
Variance population and Standard Deviation
Example 1
• Find the variance and standard deviation for the data starting salaries for CorporationA.
• 10, 60, 50, 30, 40, 20
Example 2
• Find the variance and standard deviation for the data starting
salaries for Corporation B. 35, 45, 30, 35, 40, 25
Class work
For this data set, find the mean and standard deviation of the
variable.
The data represent the serum cholesterol levels of 10
individuals
211 240 255 219 204
200 212 193 187 205
Sample Variance and Standard Deviation
Example 1
• Example: There are 45 students in a class. 5 students were randomly
selected from this class and their heights (in cm) were recorded as
follows.
• Find the sample variance and standard deviation?
131 148 139 142 152
Example 2
• Find the sample variance and standard deviation for the amount of
European auto sales for a sample of 6 years shown. The data are in
millions of dollars.
• 11.2, 11.9, 12.0, 12.8, 13.4, 14.3
Variance and Standard Deviation for Grouped Data
The procedure for finding the variance and standard deviation for grouped data is similar to that for finding the
mean for grouped data, and it uses the midpoints of each class.
Example
Find the variance and the standard deviation for the frequency distribution of the data in Example .The data
represent the number of miles that 20 runners ran during one week.
Measures of Position
In addition to measures of central tendency and measures of
variation, there are measures of position or location. These
measures include standard scores, percentiles and quartiles.
They are used to locate the relative position of a data value in the
data set. For example, if a value is located at the 80th percentile, it
means that 80% of the values fall below it in the distribution and
20% of the values fall above it.
This section discusses these measures of position.
Standard Scores
In statistics, a standard score is a measurement that compares the
relative size of values from different data sets. It's also known as a z-
score.
Suppose that a student scored 90 on a math's test and 45 on an English
exam.
This comparison uses the mean and standard deviation and is called a
standard score or z score. (We also use z scores in later chapters.) A
standard score or z score tells how many standard deviations a data
value is above or below the mean for a specific distribution of values.
If a standard score is zero, then the data value is the same as the mean.
Example 1
Test Scores
A student scored 65 on a calculus test that had a mean of 50 and a standard
deviation of 10; she scored 30 on a history test with a mean of 25 and a standard
deviation of 5. Compare her relative positions on the two tests.
Try it
3.3: Quantiles
• When data arrange ascending order and then divided into four equal
part the value of the end each quarter is called quartiles
• Quartiles divide the distribution into four groups, separated by Q1, Q2, Q3.
• Note that Q1 is the same as the 25th percentile; Q2 is the same as the 50th percentile, or the median; Q3
corresponds to the 75th percentile, as shown:
Example 2
• Find Q1, Q2, and Q3 for the data set 15, 13, 6, 5, 12, 50, 22, 18.
Try it
• Suppose the distribution of math scores in a class of 19 students in
ascending order is: Find Q1, Q2, and Q3 for the data set
• 59, 60, 65, 65, 68, 69, 70, 72, 75, 75, 76, 77, 81, 82, 84, 87, 90, 95,
98
Example
A teacher gives a 20-point test to 10 students. The scores are shown here. Find
the percentile rank of a score of 12.
18, 15, 12, 6, 8, 2, 3, 5, 20, 10
Example 2
Using the data in 12 ,18, 15, 12, 6, 8, 2, 3, 5, 20, 10 find the
percentile rank for a score of 6.
Example 1
Check the following data set for outliers.
5, 6, 12, 13, 15, 18, 22, 50
End

CHapter two desctriptive biostatistics.pdf

  • 1.
  • 2.
    Objectives After completing thischapter, you should be able to 1 Summarize data, using measures of central tendency, such as the mean, median, mode, and midrange. 2 Describe data, using measures of variation, such as the range, variance, and standard deviation. 3 Identify the position of a data value in a data set, using various measures of position, such as percentiles, deciles, and quartiles.
  • 3.
    • A measureof central tendency is a single value that attempts to describe a set of data by identifying the central position within that set of data. • As such, measures of central tendency are sometimes called measures of central location. • They are also classed as summary statistics. The mean (often called the average) is most likely the measure of central tendency that you are most familiar with, but there are others, such as the median and the mode. 2.0 Measures of Central
  • 4.
    ➢The difference measuresof central tendency are: ❖ Mean ❖Median ❖ Mode ❖Mid range
  • 5.
    1.The Arithmetic Meanor simple Mean • Definition: the arithmetic mean is the sum of all observations divided by the number of observations. It is written in statistical terms as:
  • 6.
    Example 1 • Onemeasure of central location for this sample is the arithmetic mean ; it is usually denoted by . • Suppose the sample consists of birth weights (in grams) of all live born infants born at a private hospital in a city, during a 1-week period. This sample is shown in the following table:
  • 8.
    Example 2 • Thedata represent the number of days off per year for a sample of individuals selected from nine different countries. Find the mean. • 20, 26, 40, 36, 23, 42, 35, 24, 30
  • 9.
    Example 3 • Usingthe frequency distribution for Example previous find the mean. The data represent the number of miles run during one week for a sample of 20 runners.
  • 11.
    Work out • Thedata shown represent the number of nurses registrations for six counties in southwesternAfrica . Find the mean. • 3782, 6367, 9002, 4208, 6843, 1108
  • 12.
    Try it Percentage ofCollege-Medical Science Population over 25 Below are the percentages of the population over 25 years of age who have completed 4 years of college or more Find the mean and modal class.
  • 13.
    2. Median • Analternative measure of central location, perhaps second in popularity to the arithmetic mean, is the median. • Suppose there are n observations in a sample. If these observations are ordered from smallest to largest, then the median is defined as follows:
  • 14.
    Example 1 • Thenumber of rooms in the seven hospital in east Africa is 713, 300, 618, 595, 311, 401, and 292. Find the median. • Solution Step 1 Arrange the data in order. 292, 300, 311, 401, 595, 618, 713 Step 2 Select the middle value. 292, 300, 311, 401, 595, 618, 713 Median Hence, the median is 401 rooms
  • 15.
    Example: 2 Compute thesample median for the birth weight data 3484, 2581, 2759, 2834, 4146,2838, 2841, 3031, 3101, 3200, 3245, 3248, 3260, 3265, 3314, 3323,, 3541, 3609, 3649, 2069. Solution: First arrange the sample in ascending order 2069, 2581, 2759, 2834, 2838, 2841, 3031, 3101, 3200, 3245, 3248, 3260, 3265, 3314, 3323, 3484, 3541, 3609, 3649, 4146 Since n=20 is even, Median = average of the 10th and 11th largest observation = (3245 + 3248)/2 = 3246.5 g
  • 16.
    Try it 1.The numberof patients that in hospital the United States. Find the median. 684, 764, 656, 702, 856, 1133, 1132, 2.The number of cloudy days for the top 10 cloudiest cities is shown. Find the median. 209, 223, 211, 227, 213, 240, 240, 211, 229, 212
  • 17.
    3.The Mode The thirdmeasure of average is called the mode. The mode is the value that occurs most often in the data set. It is sometimes said to be the most typical case. The value that occurs most often in a data set is called the mode. Adata set that has only one value that occurs with the greatest frequency is said to be unimodal. If a data set has two values that occur with the same greatest frequency, both value are considered to be the mode and the data set is said to be bimodal. If a data set has mor than two values that occur with the same greatest frequency, each value is used as the mode, and the data set is said to be multimodal. When no data value occurs more than once, the data set is said to have no mode. Adata set can have more than one mode or no mode at all. These situations will be shown in some of the examples that follow.
  • 18.
    Example 1 Find themode of the bonuses of eight hospital given for a specific year. The bonuses in millions of dollars are 18.0, 14.0, 34.5, 10, 11.3, 10, 12.4, 10 Solution It is helpful to arrange the data in order although it is not necessary. 10, 10, 10, 11.3, 12.4, 14.0, 18.0, 34.5 Since $10 million occurred 3 times—a frequency larger than any other number—the mode is $10 million.
  • 19.
    Example 2 The averagemark of the students in the class test is, 12, 14, 17, 19, 15, 14, 13, 18, 16, 17, 11, 18. Find the mode?
  • 20.
    Try it • Thedata show the number of factors nuclear reactors in the United States for a recent 15-year period. Find the mode. 104 104 104 104 104 107 109 109 109 110 109 111 112 111 109
  • 21.
    try it • Asmall dental pharmacy consists of the owner, the manager, the doctor , and two technicians, all of whose annual salaries are listed here. (Assume that this is the entire population.) • Staff Salary • Owner • Manager • doctor • Technician • Technician $50,000 20,000 12,000 9,000 9,000 Find the mean, median, and mode?
  • 22.
    The Midrange • Themidrange is a rough estimate of the middle. It is found by adding the lowest and highest values in the data set and dividing by 2 The Midrange .
  • 23.
    Example • In thelast two winter seasons, the city of Borama , Saylac, reported these numbers of water-line breaks per month. Find the midrange. • 2, 3, 6, 8, 4, 1
  • 24.
    Weighted mean Aweighted arithmeticmean is similar to an ordinary arithmetic mean (the most common type of average), except that instead of each of the data points contributing equally to the final average, some data points contribute more than others. The notion of weighted mean plays a role in descriptive statistics and also occurs in a more general form in several other areas of mathematics.
  • 25.
    Example 1 • GradePoint Average • A student received an A in English Composition I (3 credits), a C in Introduction to Psychology (3 credits), a B in Biology I (4 credits), and a D in Physical Education (2 credits). Assuming A 4 grade points, B 3 grade points, C 2 grade points, D 1 grade point, and F 0 grade points, find the student’s grade point average.
  • 26.
  • 27.
  • 29.
  • 30.
    2.2. measures ofvariation • Measures of variation in statistics are ways to describe the distribution or dispersion of data. • It shows how far apart data points are from one another. Statisticians use measures of variation to summarize their data. • You can draw many conclusions by using measures of variation, such as high and low variability. • You can use measures of variation to measure, analyze or describe trends in your data, which can apply to many careers that use statistics.
  • 32.
  • 34.
  • 35.
    Standard Deviation andVariance • Standard deviation and variance are two basic mathematical concepts that have an important place in various parts of the financial sector, from accounting to economics to investing. • Standard deviation is a statistical measurement that looks at how far a group of numbers is from the mean. Put simply, standard deviation measures how far apart numbers are in a data set. • Avariance is the average of the squared differences from the mean. • The variance defines a measure of the spread or dispersion within a set of data. There are two types: the population variance, usually denoted by σ and the sample variance is usually denoted by
  • 36.
    e Example 1 Find thedeviation of each starting salary for CorporationAgiven in Example 1.
  • 37.
    Variance population andStandard Deviation
  • 38.
    Example 1 • Findthe variance and standard deviation for the data starting salaries for CorporationA. • 10, 60, 50, 30, 40, 20
  • 40.
    Example 2 • Findthe variance and standard deviation for the data starting salaries for Corporation B. 35, 45, 30, 35, 40, 25
  • 42.
    Class work For thisdata set, find the mean and standard deviation of the variable. The data represent the serum cholesterol levels of 10 individuals 211 240 255 219 204 200 212 193 187 205
  • 43.
    Sample Variance andStandard Deviation
  • 45.
    Example 1 • Example:There are 45 students in a class. 5 students were randomly selected from this class and their heights (in cm) were recorded as follows. • Find the sample variance and standard deviation? 131 148 139 142 152
  • 46.
    Example 2 • Findthe sample variance and standard deviation for the amount of European auto sales for a sample of 6 years shown. The data are in millions of dollars. • 11.2, 11.9, 12.0, 12.8, 13.4, 14.3
  • 47.
    Variance and StandardDeviation for Grouped Data The procedure for finding the variance and standard deviation for grouped data is similar to that for finding the mean for grouped data, and it uses the midpoints of each class.
  • 48.
    Example Find the varianceand the standard deviation for the frequency distribution of the data in Example .The data represent the number of miles that 20 runners ran during one week.
  • 51.
    Measures of Position Inaddition to measures of central tendency and measures of variation, there are measures of position or location. These measures include standard scores, percentiles and quartiles. They are used to locate the relative position of a data value in the data set. For example, if a value is located at the 80th percentile, it means that 80% of the values fall below it in the distribution and 20% of the values fall above it. This section discusses these measures of position.
  • 52.
    Standard Scores In statistics,a standard score is a measurement that compares the relative size of values from different data sets. It's also known as a z- score. Suppose that a student scored 90 on a math's test and 45 on an English exam. This comparison uses the mean and standard deviation and is called a standard score or z score. (We also use z scores in later chapters.) A standard score or z score tells how many standard deviations a data value is above or below the mean for a specific distribution of values. If a standard score is zero, then the data value is the same as the mean.
  • 54.
    Example 1 Test Scores Astudent scored 65 on a calculus test that had a mean of 50 and a standard deviation of 10; she scored 30 on a history test with a mean of 25 and a standard deviation of 5. Compare her relative positions on the two tests.
  • 56.
  • 57.
    3.3: Quantiles • Whendata arrange ascending order and then divided into four equal part the value of the end each quarter is called quartiles • Quartiles divide the distribution into four groups, separated by Q1, Q2, Q3. • Note that Q1 is the same as the 25th percentile; Q2 is the same as the 50th percentile, or the median; Q3 corresponds to the 75th percentile, as shown:
  • 63.
    Example 2 • FindQ1, Q2, and Q3 for the data set 15, 13, 6, 5, 12, 50, 22, 18.
  • 65.
    Try it • Supposethe distribution of math scores in a class of 19 students in ascending order is: Find Q1, Q2, and Q3 for the data set • 59, 60, 65, 65, 68, 69, 70, 72, 75, 75, 76, 77, 81, 82, 84, 87, 90, 95, 98
  • 67.
    Example A teacher givesa 20-point test to 10 students. The scores are shown here. Find the percentile rank of a score of 12. 18, 15, 12, 6, 8, 2, 3, 5, 20, 10
  • 69.
    Example 2 Using thedata in 12 ,18, 15, 12, 6, 8, 2, 3, 5, 20, 10 find the percentile rank for a score of 6.
  • 72.
    Example 1 Check thefollowing data set for outliers. 5, 6, 12, 13, 15, 18, 22, 50
  • 74.