SlideShare a Scribd company logo
1 of 19
Populations and
samples
2
Population
Unknown: we would like to
make inferences (statement)
about
Take a
Sample
Use the sample to say
something about the
population
3
Sampling: A Pictorial View
Sample
Target Population
Sampled
(Study)
Population
Sample
Target Population  Sampled(STUDY) Population 
Sampling variation
We need to distinguish between a population and a sample of a
population
• Data from a sample:
• The mean of a variable ( ) is considered an estimate of the
true population mean (µ)
• The standard deviation of the variable (s) estimates the
population standard deviation (s)
However, if another sample is drawn:
The second sample mean will differ from the first sample mean
• This is called sampling variation
x
µ = population mean
1 , 2 are sample means
1 2
µ
Frequency
Population
Samples
How variable are the sample means
The Standard Deviation (sd):
• The sample standard deviation (s) estimates the variability of the
individual data in the population (s)
The Standard Error (SE)
• Represents the variability of the sample means
• Can be estimated from the standard deviation as s/√n
• Standard Error decreases as the sample size increases
standard deviation represents the variability in the individual data
standard error represents the variability in the sample means
Normal Distribution
Definitions
 Continuous data are data such as age, weight, height,
haemoglobin.
 In descriptive stats we use the mean and standard
deviation to describe these data
 Assumption the data are approximately Normal
 If not we could use median and IQR to describe the
data
WHY THE NORMAL DISTRIBUTION IS
IMPORTANT
 A good empirical description of the distribution of many
variables
the sampling distribution of a mean is normal, even
when the individual observations are not normally
distributed, provided that the sample size is not too
small
 it occupies a central role in statistical analysis.
CI’s, P-values, proportions and rates
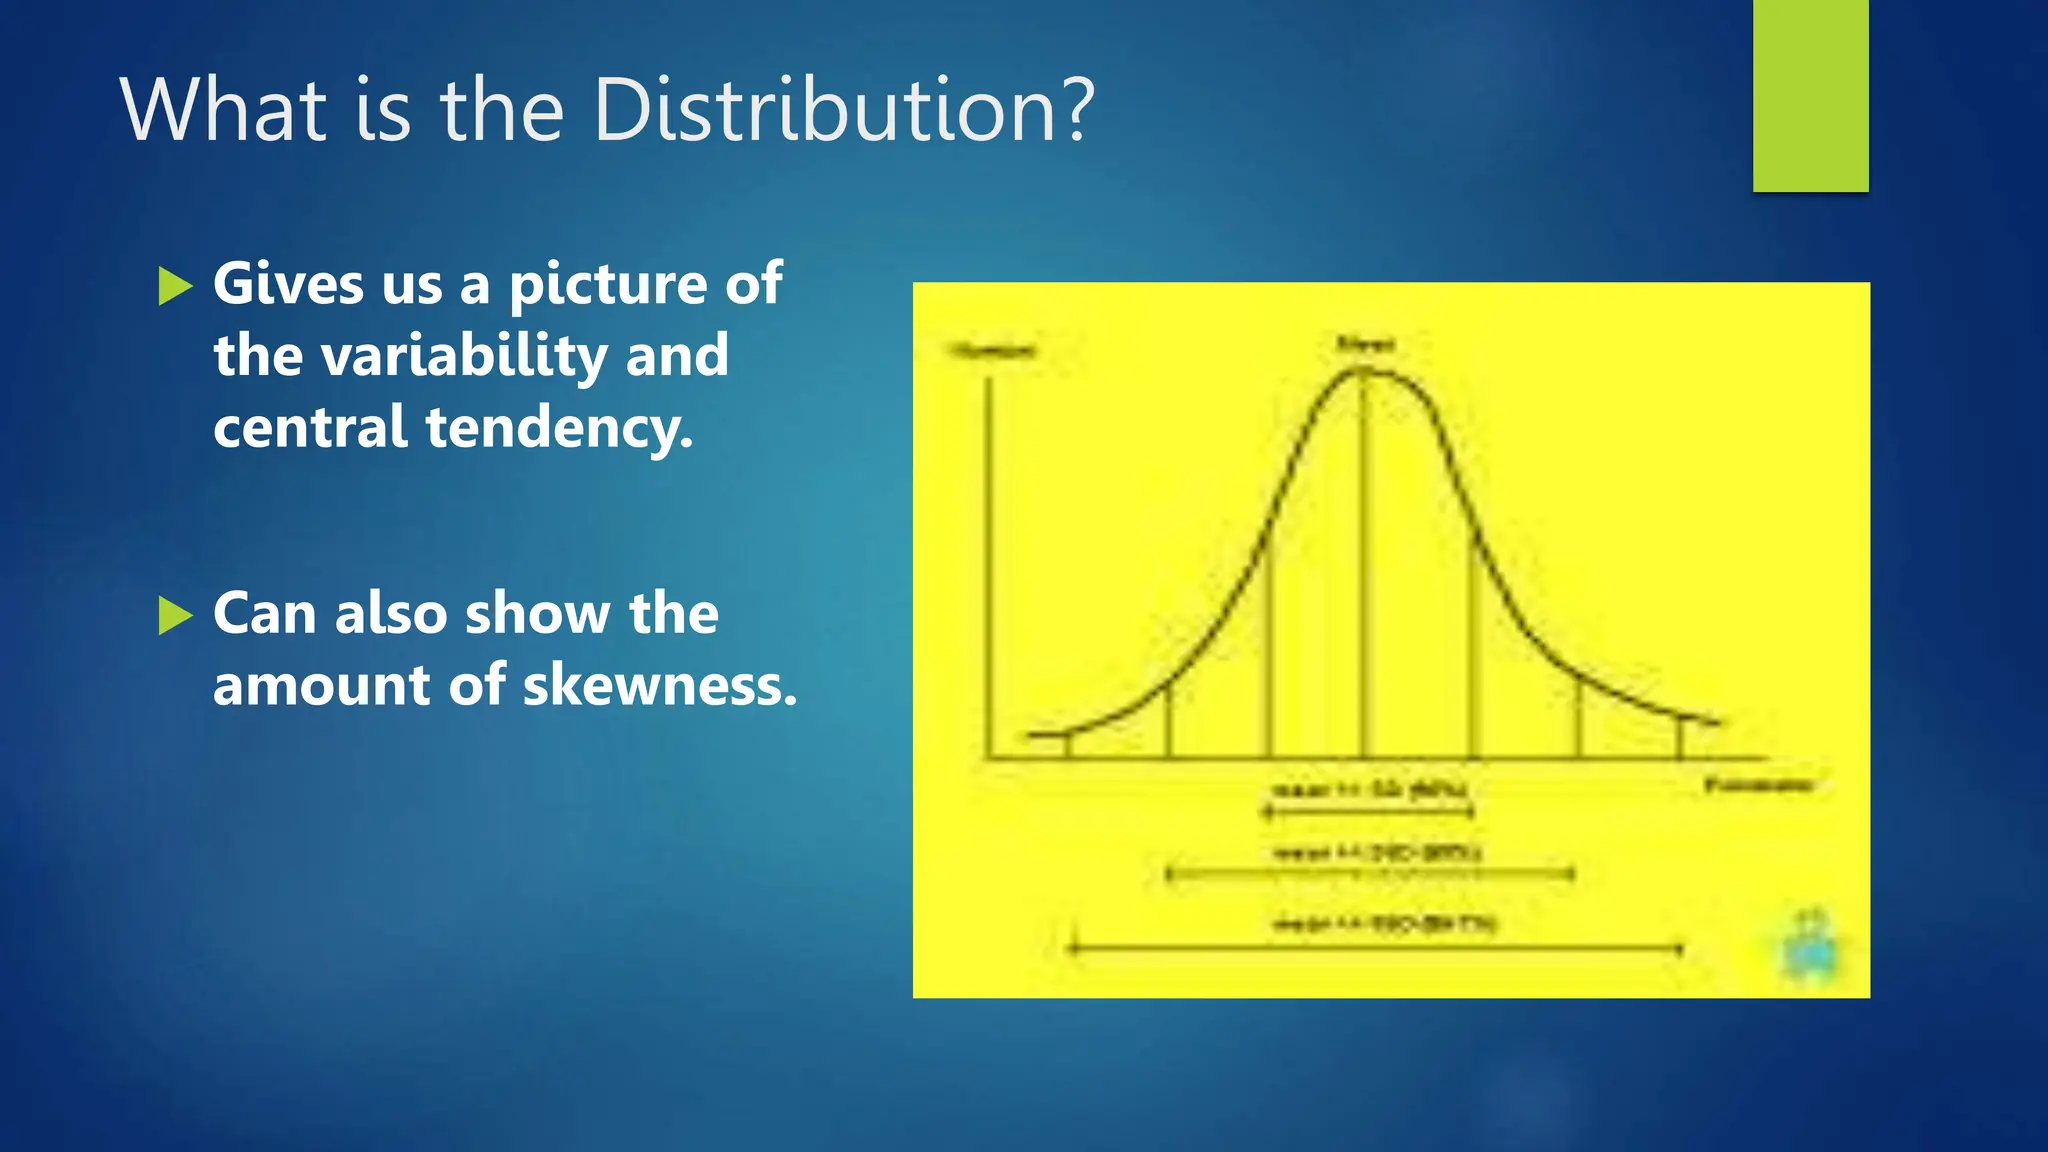
What is the Distribution?
 Gives us a picture of
the variability and
central tendency.
 Can also show the
amount of skewness.
Normal Distributions
(aka Bell-Shaped Curves, Gaussian Distributions)
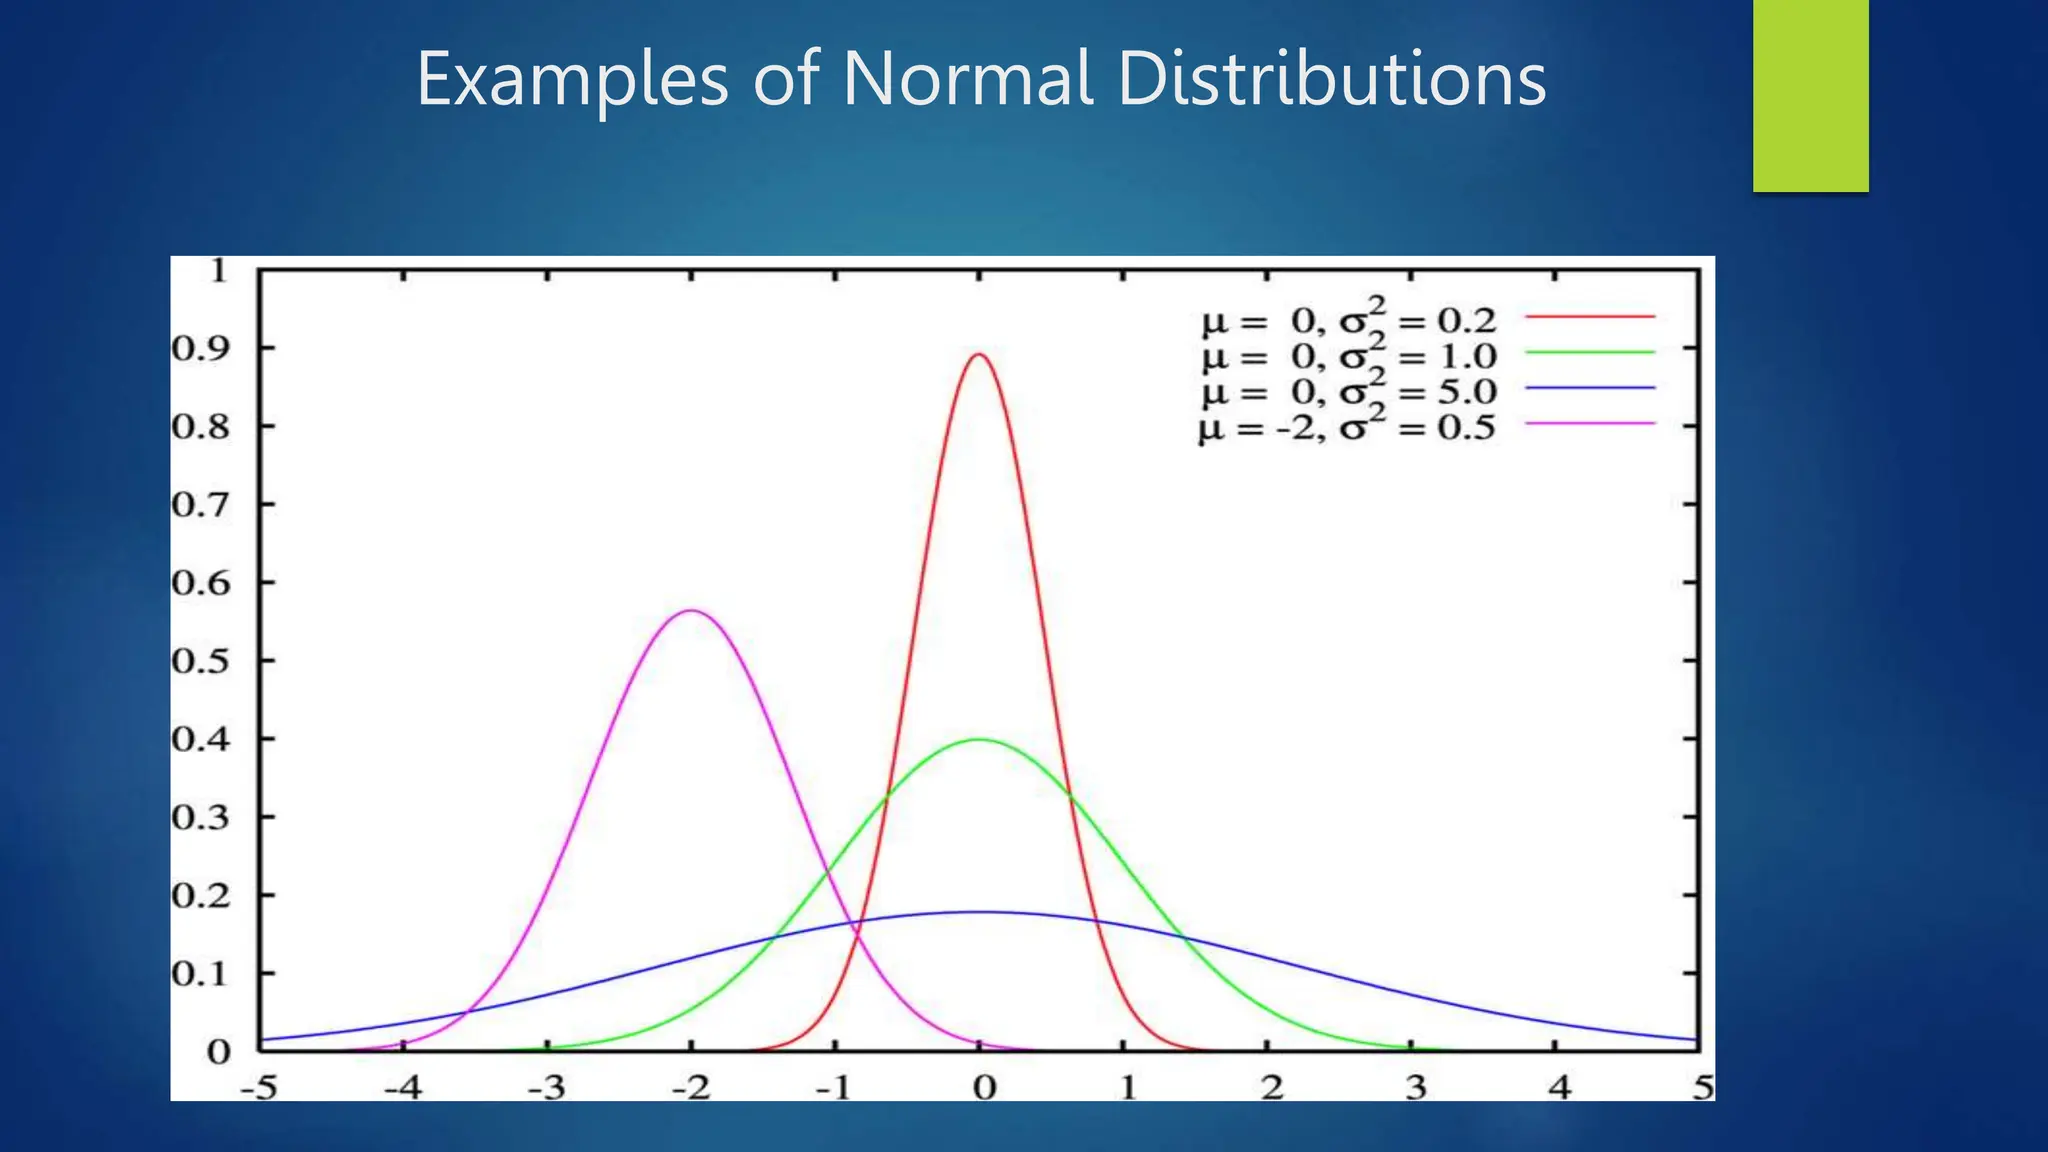
Examples of Normal Distributions
Characteristics of Normal Distributions
Mean = Median = Mode
Bilaterally symmetrical
Tails never touch x-axis
Total area under curve = 1
Notation
 A random sample of size n is taken from the population of
interest.
 The mean and standard deviation of the quantitative variable
x in the population and in the sample are given by:
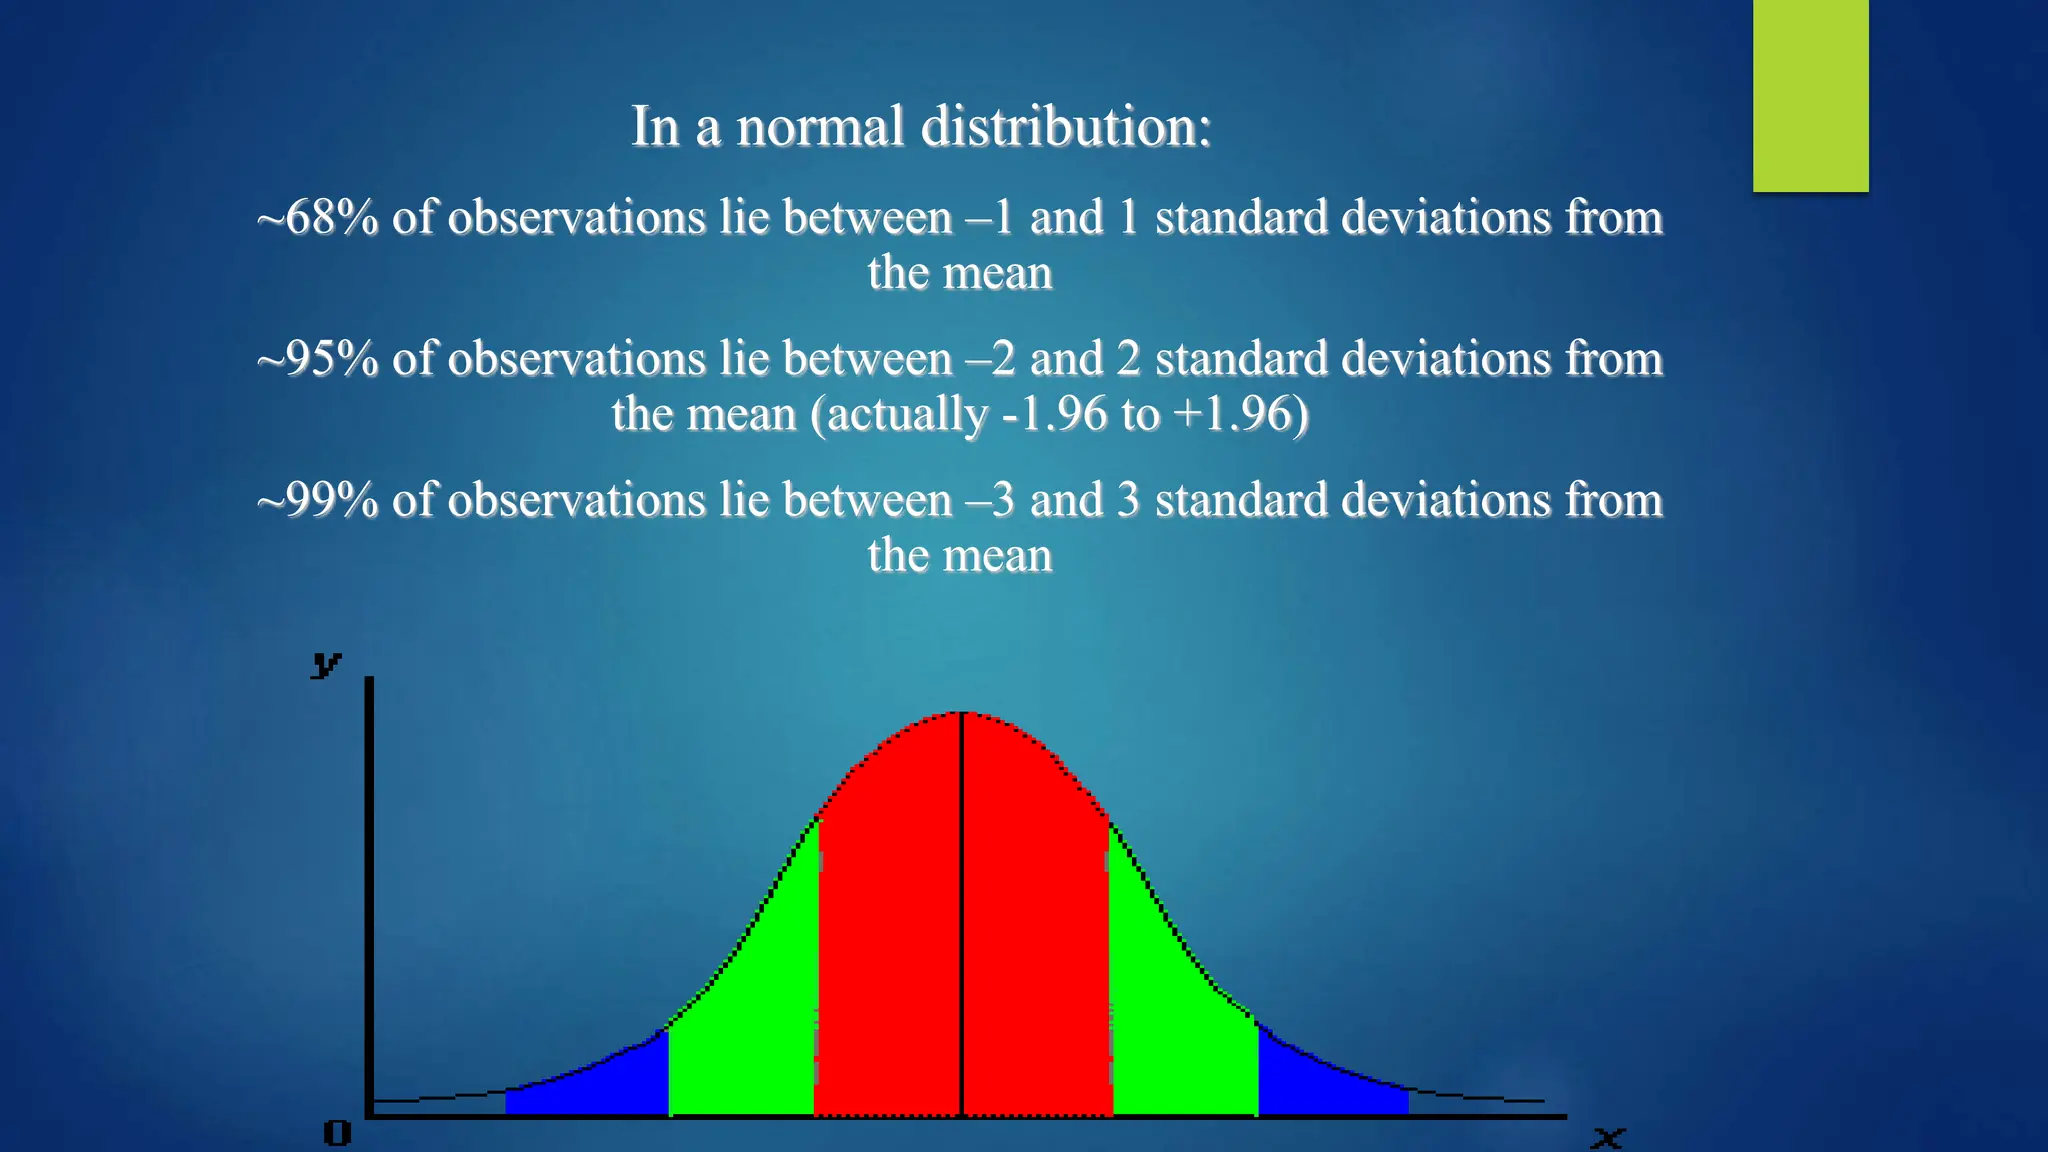
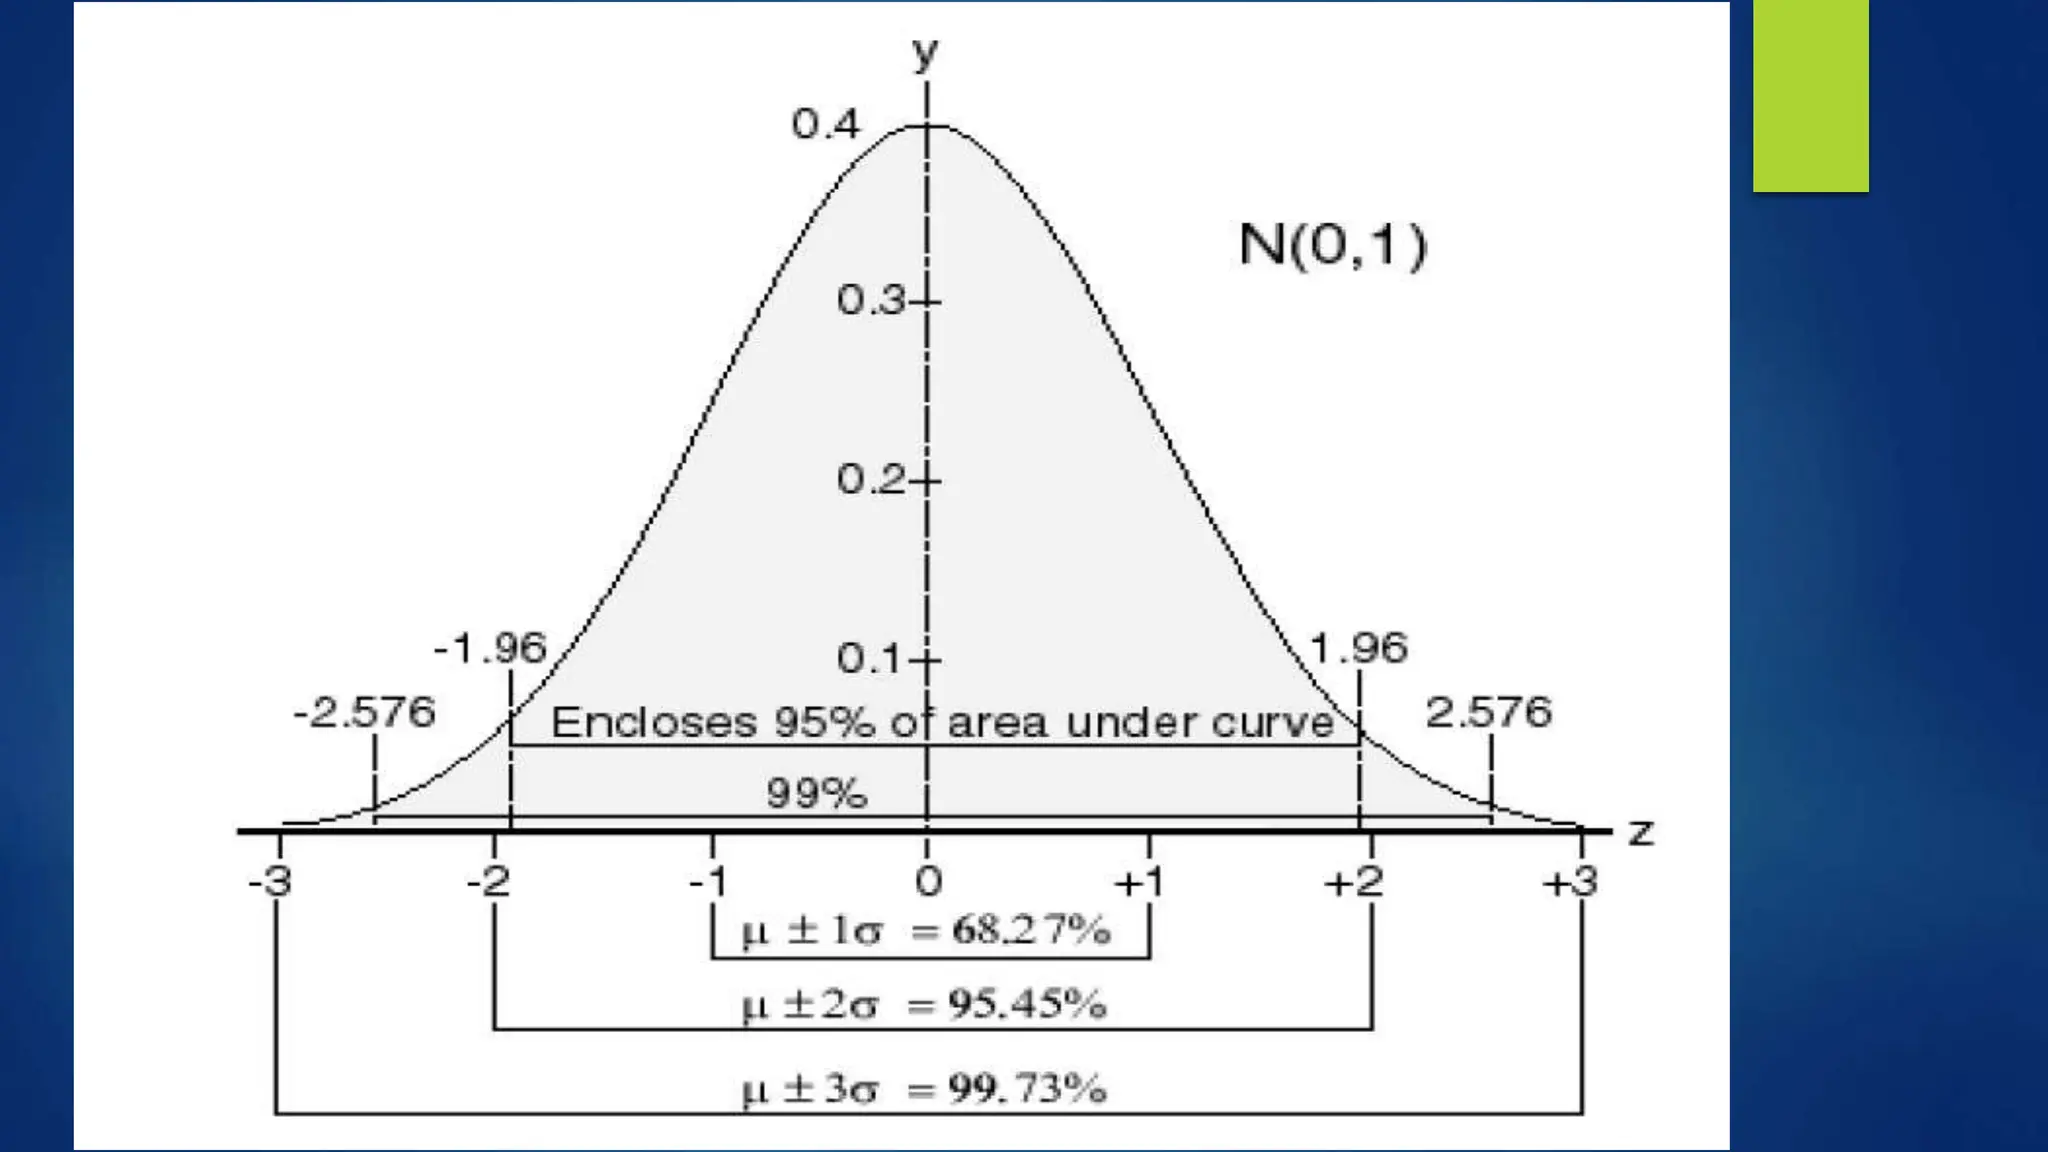
In a normal distribution:
~68% of observations lie between –1 and 1 standard deviations from
the mean
~95% of observations lie between –2 and 2 standard deviations from
the mean (actually -1.96 to +1.96)
~99% of observations lie between –3 and 3 standard deviations from
the mean
Example of normal distribution
Relationship between the mean, standard
deviation and the normal distribution
 For symmetric distributions, approximately, 95% of all observations
lie in the interval  2s
 The limits: - 2s and + 2s are referred to as the 95% tolerance limits
(or 95% spread limits)
 Values contained in the interval are commonly termed as “THE
NORMAL VALUES”
In Summary
 For most continuous data, the data points are Normally
distributed, around the Mean, with a spread which is called the
Standard deviations
 From any sample of continuous data, the mean is calculated, and
will vary from sample to sample.
 The sample mean will have a distribution which is centered on
the Population mean , and will have a spread which is called
the Standard Error.
 The standard error of the sample mean is related to the
standard deviation and the sample size.

More Related Content

Similar to Lecture 9-Normal distribution......... ...pptx

Research methodology and iostatistics ppt
Research methodology and iostatistics pptResearch methodology and iostatistics ppt
Research methodology and iostatistics ppt
Nikhat Mohammadi
 
Research methodology3
Research methodology3Research methodology3
Research methodology3
Tosif Ahmad
 

Similar to Lecture 9-Normal distribution......... ...pptx (20)

Stat 4 the normal distribution & steps of testing hypothesis
Stat 4 the normal distribution & steps of testing hypothesisStat 4 the normal distribution & steps of testing hypothesis
Stat 4 the normal distribution & steps of testing hypothesis
 
Sampling distribution
Sampling distributionSampling distribution
Sampling distribution
 
Inferential statistics-estimation
Inferential statistics-estimationInferential statistics-estimation
Inferential statistics-estimation
 
Basic for DoE ruchir
Basic for DoE ruchirBasic for DoE ruchir
Basic for DoE ruchir
 
Research methodology and iostatistics ppt
Research methodology and iostatistics pptResearch methodology and iostatistics ppt
Research methodology and iostatistics ppt
 
determinatiion of
determinatiion of determinatiion of
determinatiion of
 
1.1 course notes inferential statistics
1.1 course notes inferential statistics1.1 course notes inferential statistics
1.1 course notes inferential statistics
 
Basics of biostatistic
Basics of biostatisticBasics of biostatistic
Basics of biostatistic
 
Basic statistics
Basic statisticsBasic statistics
Basic statistics
 
Basic statistics 1
Basic statistics  1Basic statistics  1
Basic statistics 1
 
Statr sessions 4 to 6
Statr sessions 4 to 6Statr sessions 4 to 6
Statr sessions 4 to 6
 
Descriptive Statistics
Descriptive StatisticsDescriptive Statistics
Descriptive Statistics
 
Research methodology3
Research methodology3Research methodology3
Research methodology3
 
Chp11 - Research Methods for Business By Authors Uma Sekaran and Roger Bougie
Chp11  - Research Methods for Business By Authors Uma Sekaran and Roger BougieChp11  - Research Methods for Business By Authors Uma Sekaran and Roger Bougie
Chp11 - Research Methods for Business By Authors Uma Sekaran and Roger Bougie
 
Review on probability distributions, estimation and hypothesis testing
Review on probability distributions, estimation and hypothesis testingReview on probability distributions, estimation and hypothesis testing
Review on probability distributions, estimation and hypothesis testing
 
ch-4-measures-of-variability-11 2.ppt for nursing
ch-4-measures-of-variability-11 2.ppt for nursingch-4-measures-of-variability-11 2.ppt for nursing
ch-4-measures-of-variability-11 2.ppt for nursing
 
measures-of-variability-11.ppt
measures-of-variability-11.pptmeasures-of-variability-11.ppt
measures-of-variability-11.ppt
 
descriptive data analysis
 descriptive data analysis descriptive data analysis
descriptive data analysis
 
Statistics "Descriptive & Inferential"
Statistics "Descriptive & Inferential"Statistics "Descriptive & Inferential"
Statistics "Descriptive & Inferential"
 
Statistics (GE 4 CLASS).pptx
Statistics (GE 4 CLASS).pptxStatistics (GE 4 CLASS).pptx
Statistics (GE 4 CLASS).pptx
 

Recently uploaded

The basics of sentences session 4pptx.pptx
The basics of sentences session 4pptx.pptxThe basics of sentences session 4pptx.pptx
The basics of sentences session 4pptx.pptx
heathfieldcps1
 
會考英文會考英文會考英文會考英文會考英文會考英文會考英文會考英文會考英文會考英文會考英文
會考英文會考英文會考英文會考英文會考英文會考英文會考英文會考英文會考英文會考英文會考英文會考英文會考英文會考英文會考英文會考英文會考英文會考英文會考英文會考英文會考英文會考英文
會考英文會考英文會考英文會考英文會考英文會考英文會考英文會考英文會考英文會考英文會考英文
中 央社
 
會考英聽會考英聽會考英聽會考英聽會考英聽會考英聽會考英聽會考英聽會考英聽會考英聽
會考英聽會考英聽會考英聽會考英聽會考英聽會考英聽會考英聽會考英聽會考英聽會考英聽會考英聽會考英聽會考英聽會考英聽會考英聽會考英聽會考英聽會考英聽會考英聽會考英聽
會考英聽會考英聽會考英聽會考英聽會考英聽會考英聽會考英聽會考英聽會考英聽會考英聽
中 央社
 
Neurulation and the formation of the neural tube
Neurulation and the formation of the neural tubeNeurulation and the formation of the neural tube
Neurulation and the formation of the neural tube
SaadHumayun7
 
IATP How-to Foreign Travel May 2024.pdff
IATP How-to Foreign Travel May 2024.pdffIATP How-to Foreign Travel May 2024.pdff
IATP How-to Foreign Travel May 2024.pdff
17thcssbs2
 

Recently uploaded (20)

Word Stress rules esl .pptx
Word Stress rules esl               .pptxWord Stress rules esl               .pptx
Word Stress rules esl .pptx
 
Gyanartha SciBizTech Quiz slideshare.pptx
Gyanartha SciBizTech Quiz slideshare.pptxGyanartha SciBizTech Quiz slideshare.pptx
Gyanartha SciBizTech Quiz slideshare.pptx
 
Research Methods in Psychology | Cambridge AS Level | Cambridge Assessment In...
Research Methods in Psychology | Cambridge AS Level | Cambridge Assessment In...Research Methods in Psychology | Cambridge AS Level | Cambridge Assessment In...
Research Methods in Psychology | Cambridge AS Level | Cambridge Assessment In...
 
Mbaye_Astou.Education Civica_Human Rights.pptx
Mbaye_Astou.Education Civica_Human Rights.pptxMbaye_Astou.Education Civica_Human Rights.pptx
Mbaye_Astou.Education Civica_Human Rights.pptx
 
The basics of sentences session 4pptx.pptx
The basics of sentences session 4pptx.pptxThe basics of sentences session 4pptx.pptx
The basics of sentences session 4pptx.pptx
 
Features of Video Calls in the Discuss Module in Odoo 17
Features of Video Calls in the Discuss Module in Odoo 17Features of Video Calls in the Discuss Module in Odoo 17
Features of Video Calls in the Discuss Module in Odoo 17
 
UNIT – IV_PCI Complaints: Complaints and evaluation of complaints, Handling o...
UNIT – IV_PCI Complaints: Complaints and evaluation of complaints, Handling o...UNIT – IV_PCI Complaints: Complaints and evaluation of complaints, Handling o...
UNIT – IV_PCI Complaints: Complaints and evaluation of complaints, Handling o...
 
會考英文會考英文會考英文會考英文會考英文會考英文會考英文會考英文會考英文會考英文會考英文
會考英文會考英文會考英文會考英文會考英文會考英文會考英文會考英文會考英文會考英文會考英文會考英文會考英文會考英文會考英文會考英文會考英文會考英文會考英文會考英文會考英文會考英文
會考英文會考英文會考英文會考英文會考英文會考英文會考英文會考英文會考英文會考英文會考英文
 
slides CapTechTalks Webinar May 2024 Alexander Perry.pptx
slides CapTechTalks Webinar May 2024 Alexander Perry.pptxslides CapTechTalks Webinar May 2024 Alexander Perry.pptx
slides CapTechTalks Webinar May 2024 Alexander Perry.pptx
 
The Benefits and Challenges of Open Educational Resources
The Benefits and Challenges of Open Educational ResourcesThe Benefits and Challenges of Open Educational Resources
The Benefits and Challenges of Open Educational Resources
 
Application of Matrices in real life. Presentation on application of matrices
Application of Matrices in real life. Presentation on application of matricesApplication of Matrices in real life. Presentation on application of matrices
Application of Matrices in real life. Presentation on application of matrices
 
Morse OER Some Benefits and Challenges.pptx
Morse OER Some Benefits and Challenges.pptxMorse OER Some Benefits and Challenges.pptx
Morse OER Some Benefits and Challenges.pptx
 
Pragya Champions Chalice 2024 Prelims & Finals Q/A set, General Quiz
Pragya Champions Chalice 2024 Prelims & Finals Q/A set, General QuizPragya Champions Chalice 2024 Prelims & Finals Q/A set, General Quiz
Pragya Champions Chalice 2024 Prelims & Finals Q/A set, General Quiz
 
INU_CAPSTONEDESIGN_비밀번호486_업로드용 발표자료.pdf
INU_CAPSTONEDESIGN_비밀번호486_업로드용 발표자료.pdfINU_CAPSTONEDESIGN_비밀번호486_업로드용 발표자료.pdf
INU_CAPSTONEDESIGN_비밀번호486_업로드용 발표자료.pdf
 
Basic_QTL_Marker-assisted_Selection_Sourabh.ppt
Basic_QTL_Marker-assisted_Selection_Sourabh.pptBasic_QTL_Marker-assisted_Selection_Sourabh.ppt
Basic_QTL_Marker-assisted_Selection_Sourabh.ppt
 
會考英聽會考英聽會考英聽會考英聽會考英聽會考英聽會考英聽會考英聽會考英聽會考英聽
會考英聽會考英聽會考英聽會考英聽會考英聽會考英聽會考英聽會考英聽會考英聽會考英聽會考英聽會考英聽會考英聽會考英聽會考英聽會考英聽會考英聽會考英聽會考英聽會考英聽
會考英聽會考英聽會考英聽會考英聽會考英聽會考英聽會考英聽會考英聽會考英聽會考英聽
 
Neurulation and the formation of the neural tube
Neurulation and the formation of the neural tubeNeurulation and the formation of the neural tube
Neurulation and the formation of the neural tube
 
size separation d pharm 1st year pharmaceutics
size separation d pharm 1st year pharmaceuticssize separation d pharm 1st year pharmaceutics
size separation d pharm 1st year pharmaceutics
 
Danh sách HSG Bộ môn cấp trường - Cấp THPT.pdf
Danh sách HSG Bộ môn cấp trường - Cấp THPT.pdfDanh sách HSG Bộ môn cấp trường - Cấp THPT.pdf
Danh sách HSG Bộ môn cấp trường - Cấp THPT.pdf
 
IATP How-to Foreign Travel May 2024.pdff
IATP How-to Foreign Travel May 2024.pdffIATP How-to Foreign Travel May 2024.pdff
IATP How-to Foreign Travel May 2024.pdff
 

Lecture 9-Normal distribution......... ...pptx

  • 2. 2 Population Unknown: we would like to make inferences (statement) about Take a Sample Use the sample to say something about the population
  • 3. 3 Sampling: A Pictorial View Sample Target Population Sampled (Study) Population Sample Target Population  Sampled(STUDY) Population 
  • 4. Sampling variation We need to distinguish between a population and a sample of a population • Data from a sample: • The mean of a variable ( ) is considered an estimate of the true population mean (µ) • The standard deviation of the variable (s) estimates the population standard deviation (s) However, if another sample is drawn: The second sample mean will differ from the first sample mean • This is called sampling variation x
  • 5. µ = population mean 1 , 2 are sample means 1 2 µ Frequency Population Samples
  • 6. How variable are the sample means The Standard Deviation (sd): • The sample standard deviation (s) estimates the variability of the individual data in the population (s) The Standard Error (SE) • Represents the variability of the sample means • Can be estimated from the standard deviation as s/√n • Standard Error decreases as the sample size increases standard deviation represents the variability in the individual data standard error represents the variability in the sample means
  • 8. Definitions  Continuous data are data such as age, weight, height, haemoglobin.  In descriptive stats we use the mean and standard deviation to describe these data  Assumption the data are approximately Normal  If not we could use median and IQR to describe the data
  • 9. WHY THE NORMAL DISTRIBUTION IS IMPORTANT  A good empirical description of the distribution of many variables the sampling distribution of a mean is normal, even when the individual observations are not normally distributed, provided that the sample size is not too small  it occupies a central role in statistical analysis. CI’s, P-values, proportions and rates
  • 10. What is the Distribution?  Gives us a picture of the variability and central tendency.  Can also show the amount of skewness.
  • 11. Normal Distributions (aka Bell-Shaped Curves, Gaussian Distributions)
  • 12. Examples of Normal Distributions
  • 13. Characteristics of Normal Distributions Mean = Median = Mode Bilaterally symmetrical Tails never touch x-axis Total area under curve = 1
  • 14. Notation  A random sample of size n is taken from the population of interest.  The mean and standard deviation of the quantitative variable x in the population and in the sample are given by:
  • 15. In a normal distribution: ~68% of observations lie between –1 and 1 standard deviations from the mean ~95% of observations lie between –2 and 2 standard deviations from the mean (actually -1.96 to +1.96) ~99% of observations lie between –3 and 3 standard deviations from the mean
  • 16.
  • 17. Example of normal distribution
  • 18. Relationship between the mean, standard deviation and the normal distribution  For symmetric distributions, approximately, 95% of all observations lie in the interval  2s  The limits: - 2s and + 2s are referred to as the 95% tolerance limits (or 95% spread limits)  Values contained in the interval are commonly termed as “THE NORMAL VALUES”
  • 19. In Summary  For most continuous data, the data points are Normally distributed, around the Mean, with a spread which is called the Standard deviations  From any sample of continuous data, the mean is calculated, and will vary from sample to sample.  The sample mean will have a distribution which is centered on the Population mean , and will have a spread which is called the Standard Error.  The standard error of the sample mean is related to the standard deviation and the sample size.