Downloaded 4,161 times

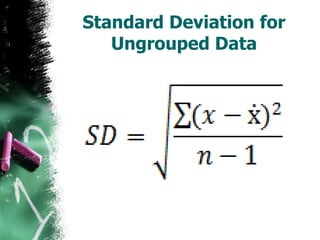
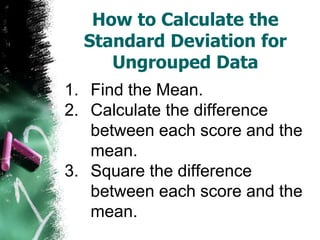
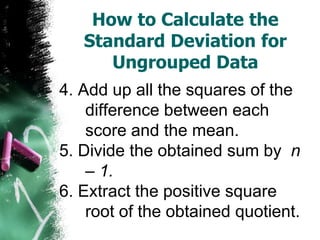
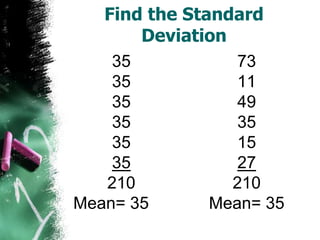
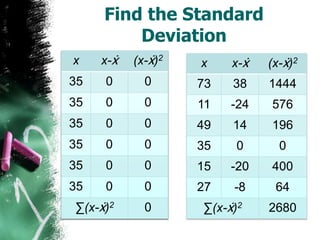
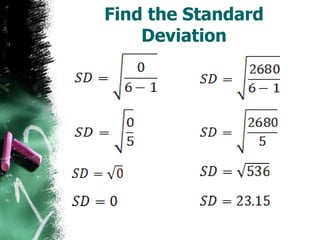
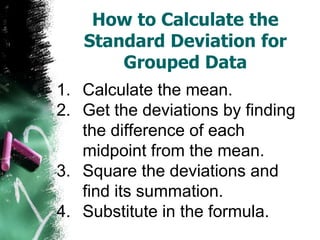
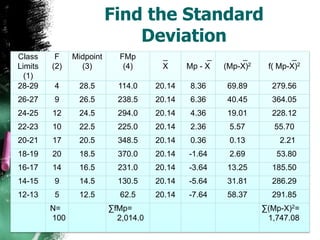
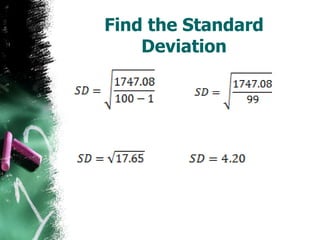
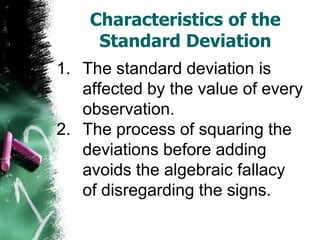
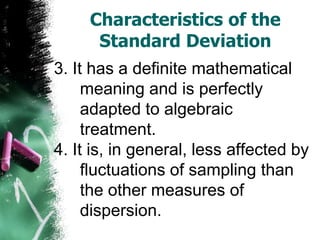
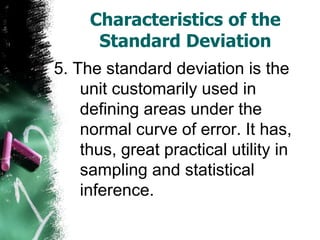
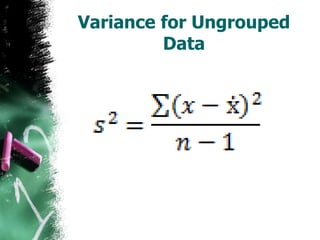
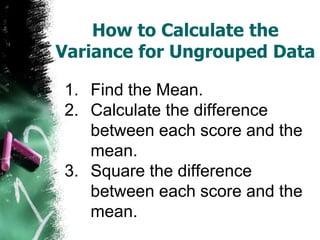
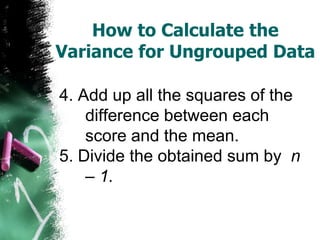
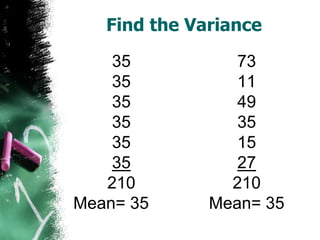
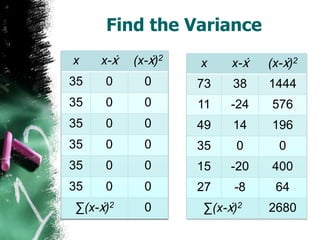
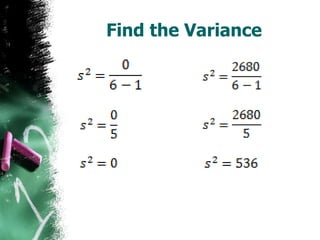
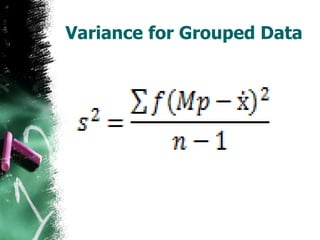
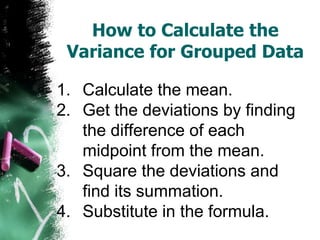
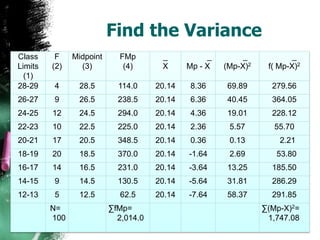
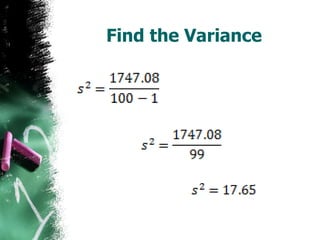


The document discusses how to calculate standard deviation and variance for both ungrouped and grouped data. It provides step-by-step instructions for finding the mean, deviations from the mean, summing the squared deviations, and using these values to calculate standard deviation and variance through standard formulas. Standard deviation measures how spread out numbers are from the mean, while variance is the square of the standard deviation.