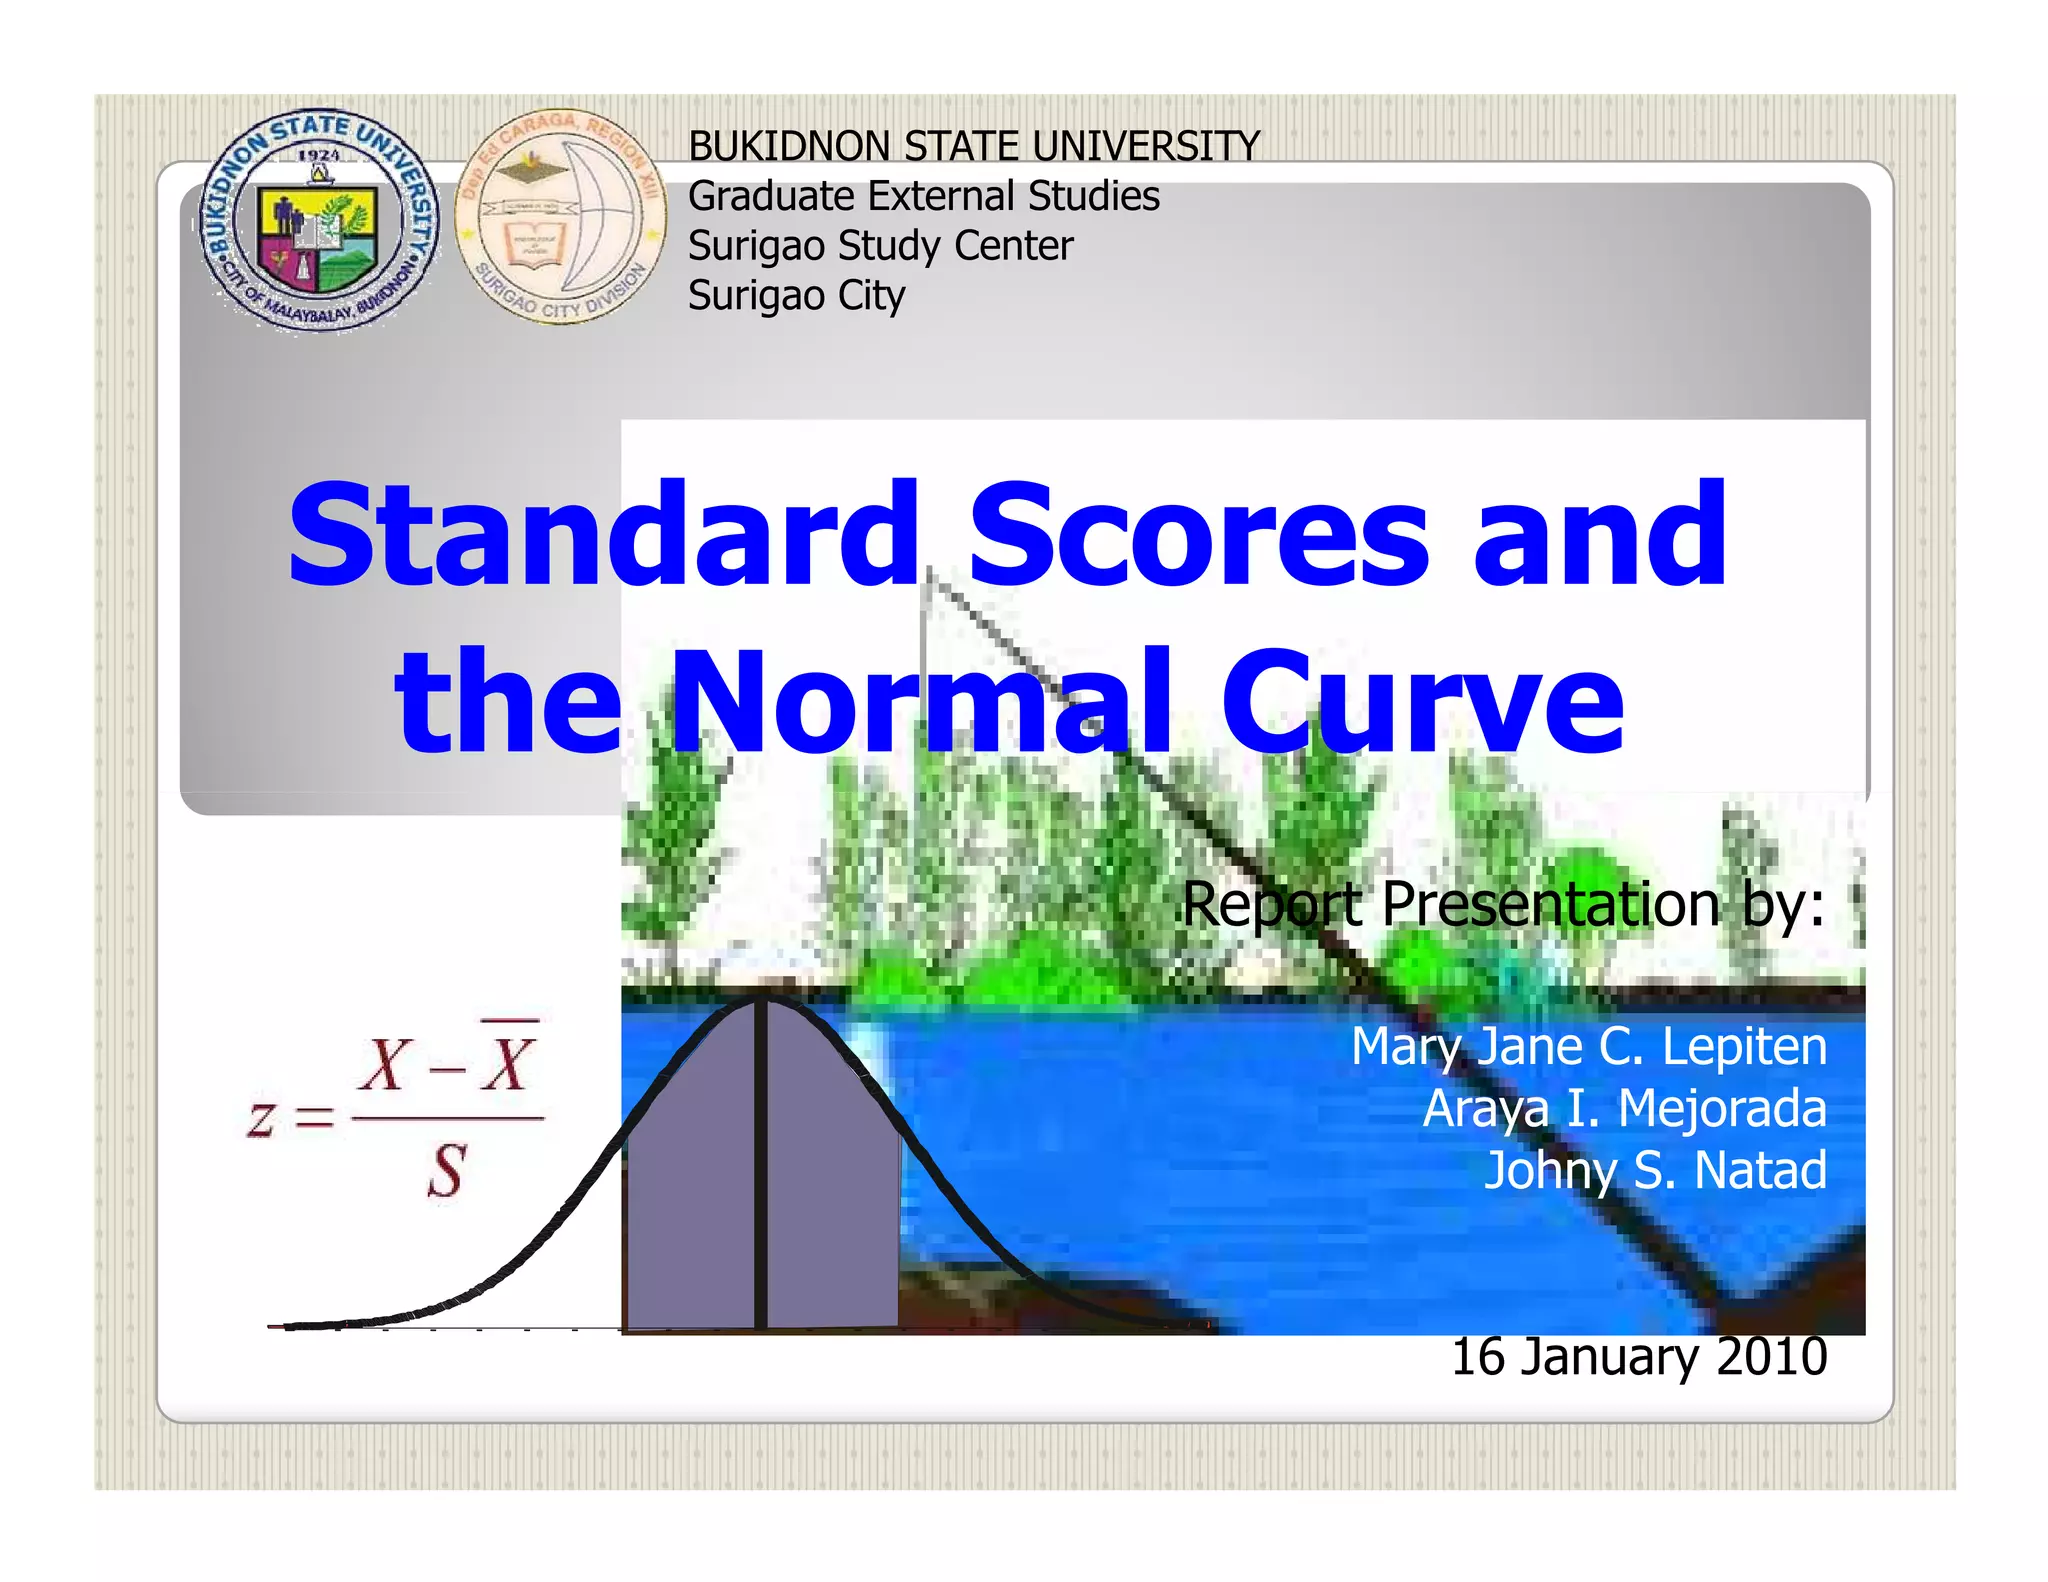
BUKIDNON STATE UNIVERSITY
Graduate External Studies
Surigao Study Center
Surigao City
Standard Scores and
the Normal Curve
Report Presentation by:
Mary Jane C. Lepiten
Araya I. Mejorada
Johny S. Natad
16 January 2010
2.
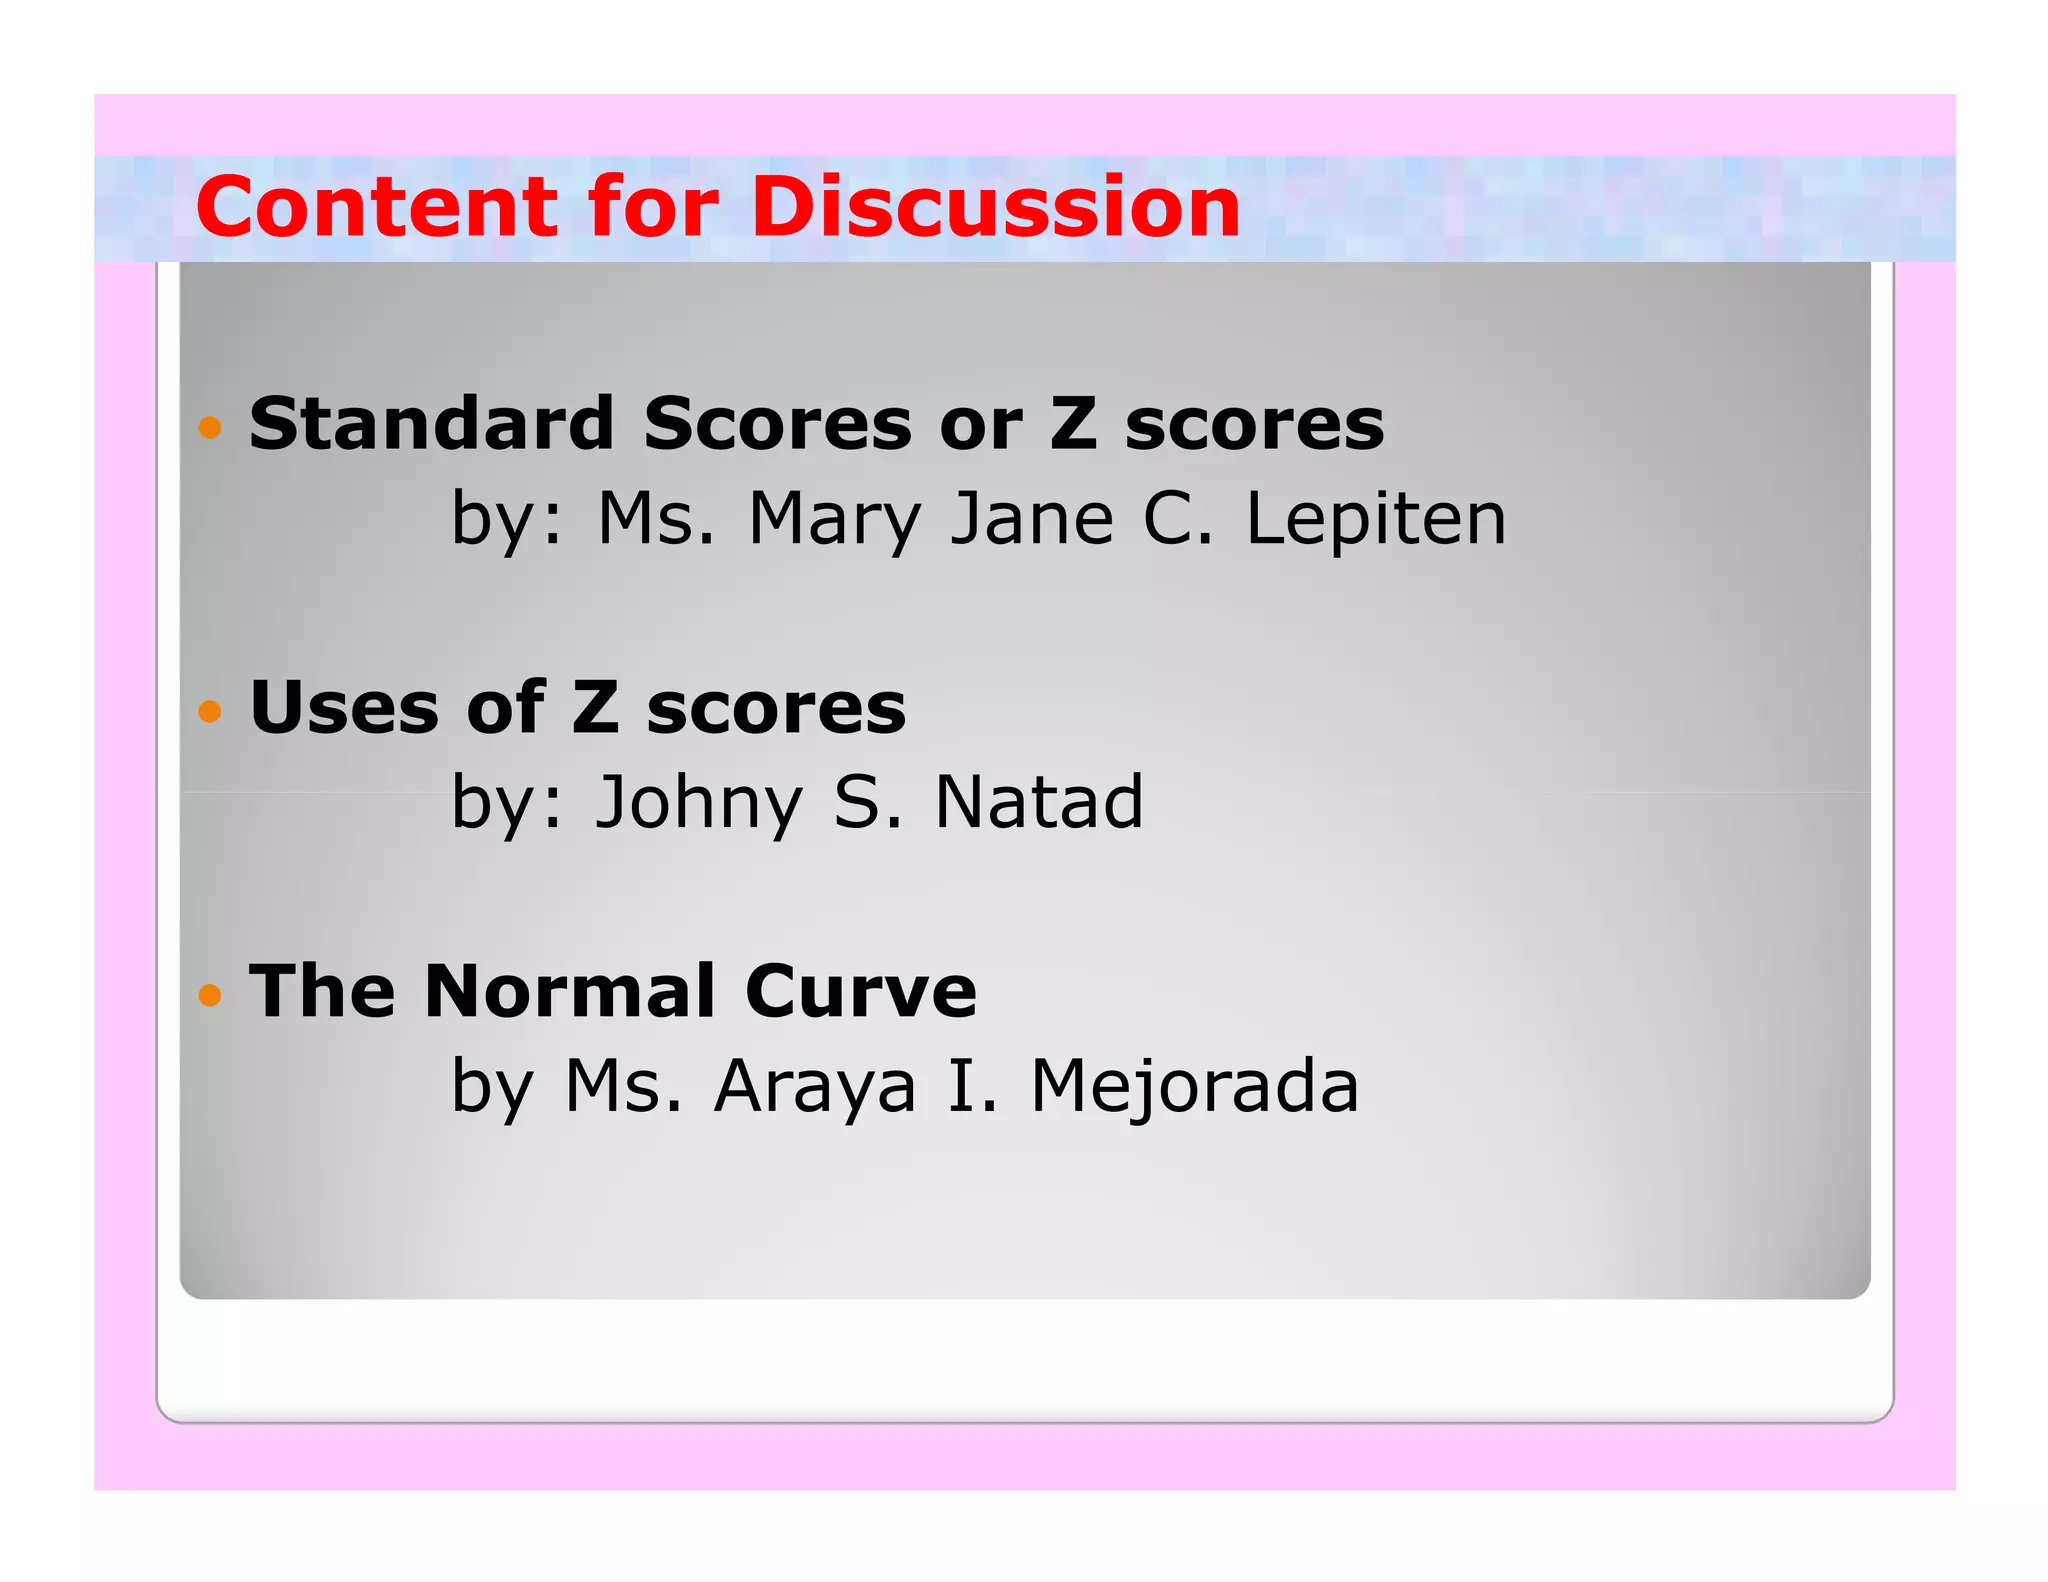
Content for Discussion
Standard Scores or Z scores
by: Ms. Mary Jane C. Lepiten
Uses of Z scores
by: Johny S. Natad
The Normal Curve
by Ms. Araya I. Mejorada
3.
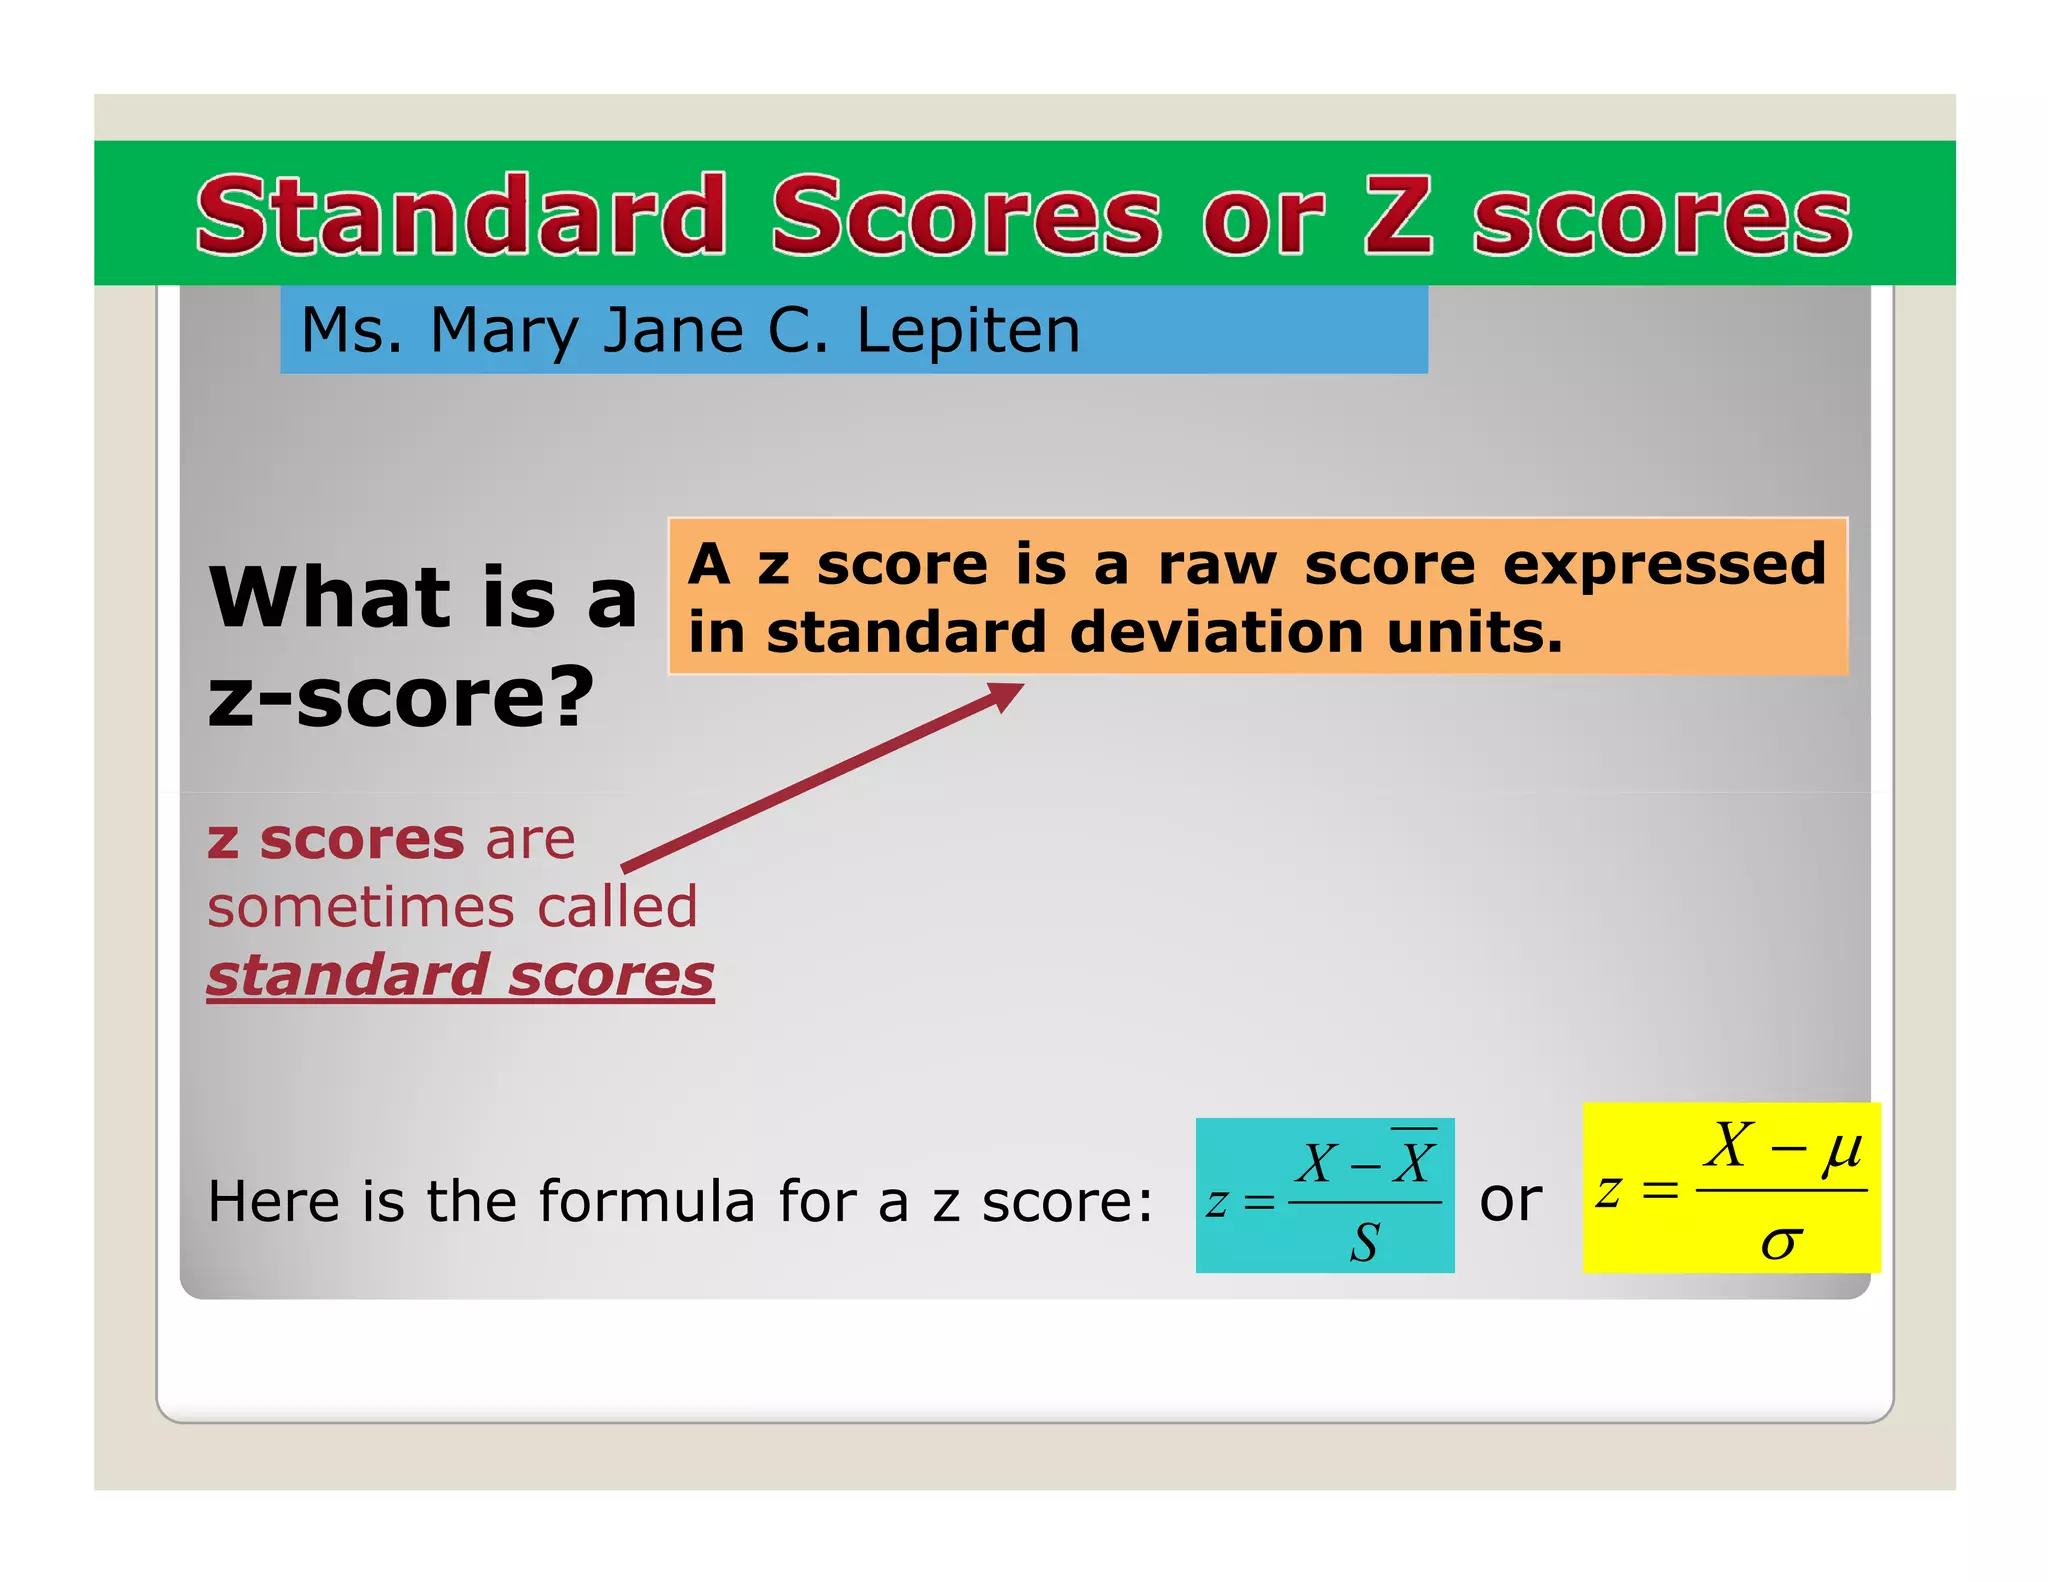
Ms. Mary JaneC. Lepiten
A z score is a raw score expressed
What is a in standard deviation units.
z-score?
z scores are
sometimes called
standard scores
X −X X −µ
Here is the formula for a z score: z = or z =
S σ
4.
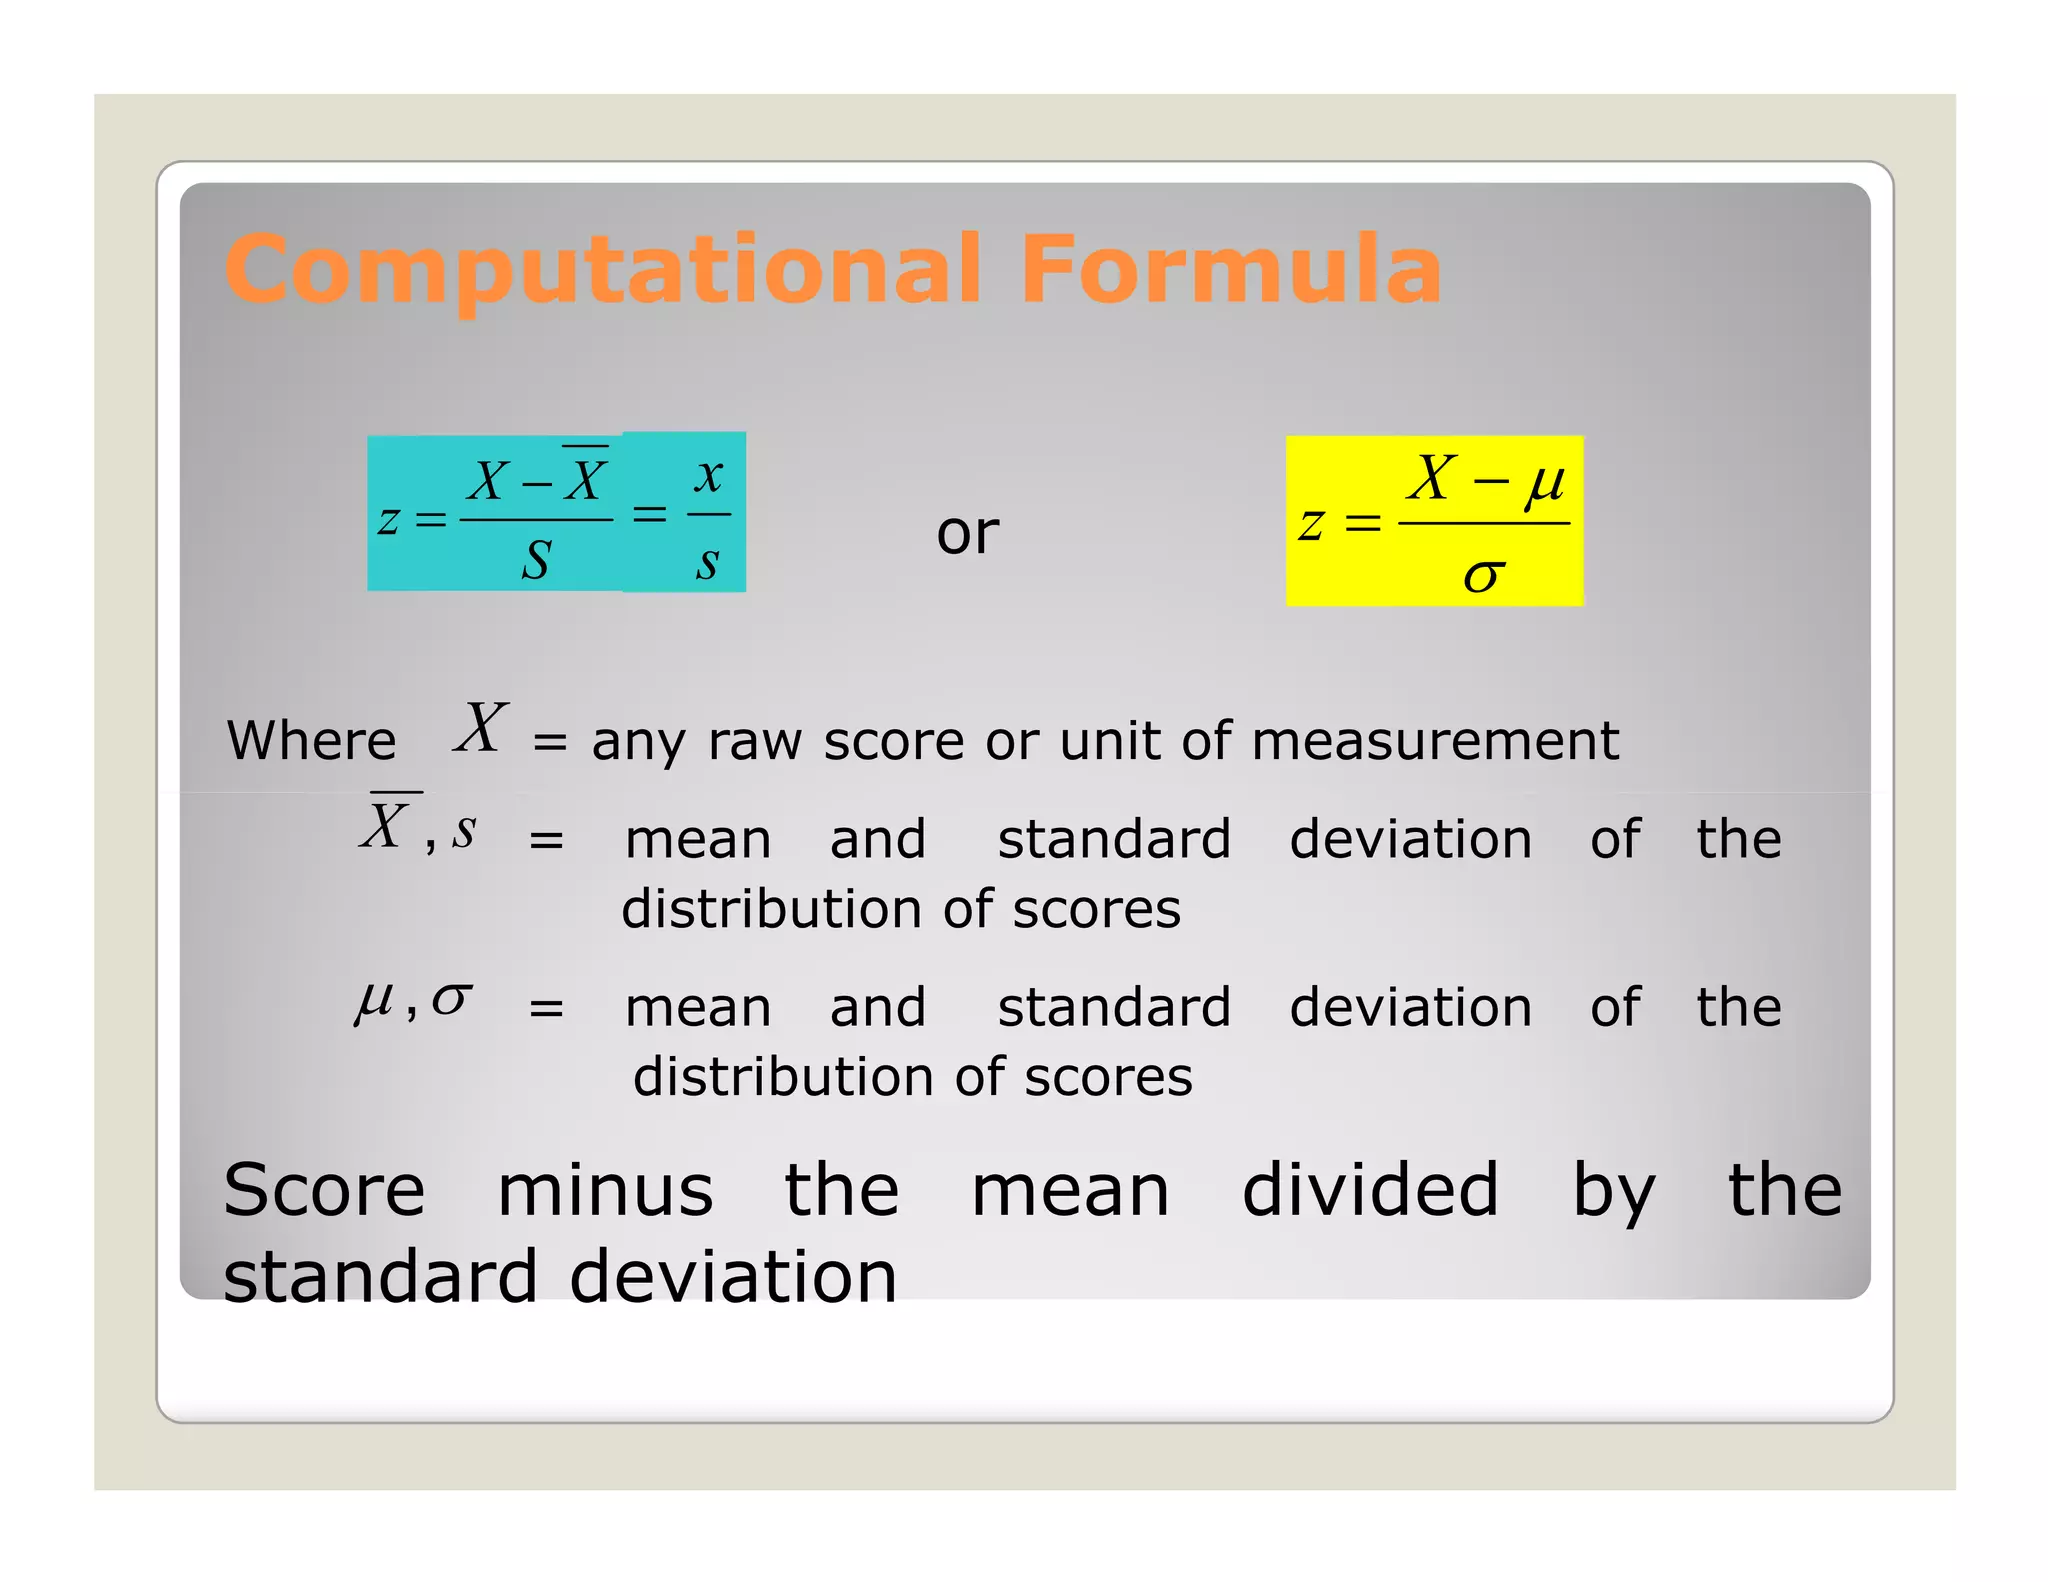
Computational Formula
X −X x X −µ
z= = or z=
S s σ
Where X = any raw score or unit of measurement
X , s = mean and standard deviation of the
distribution of scores
µ ,σ = mean and standard deviation of the
distribution of scores
Score minus the mean divided by the
standard deviation
5.
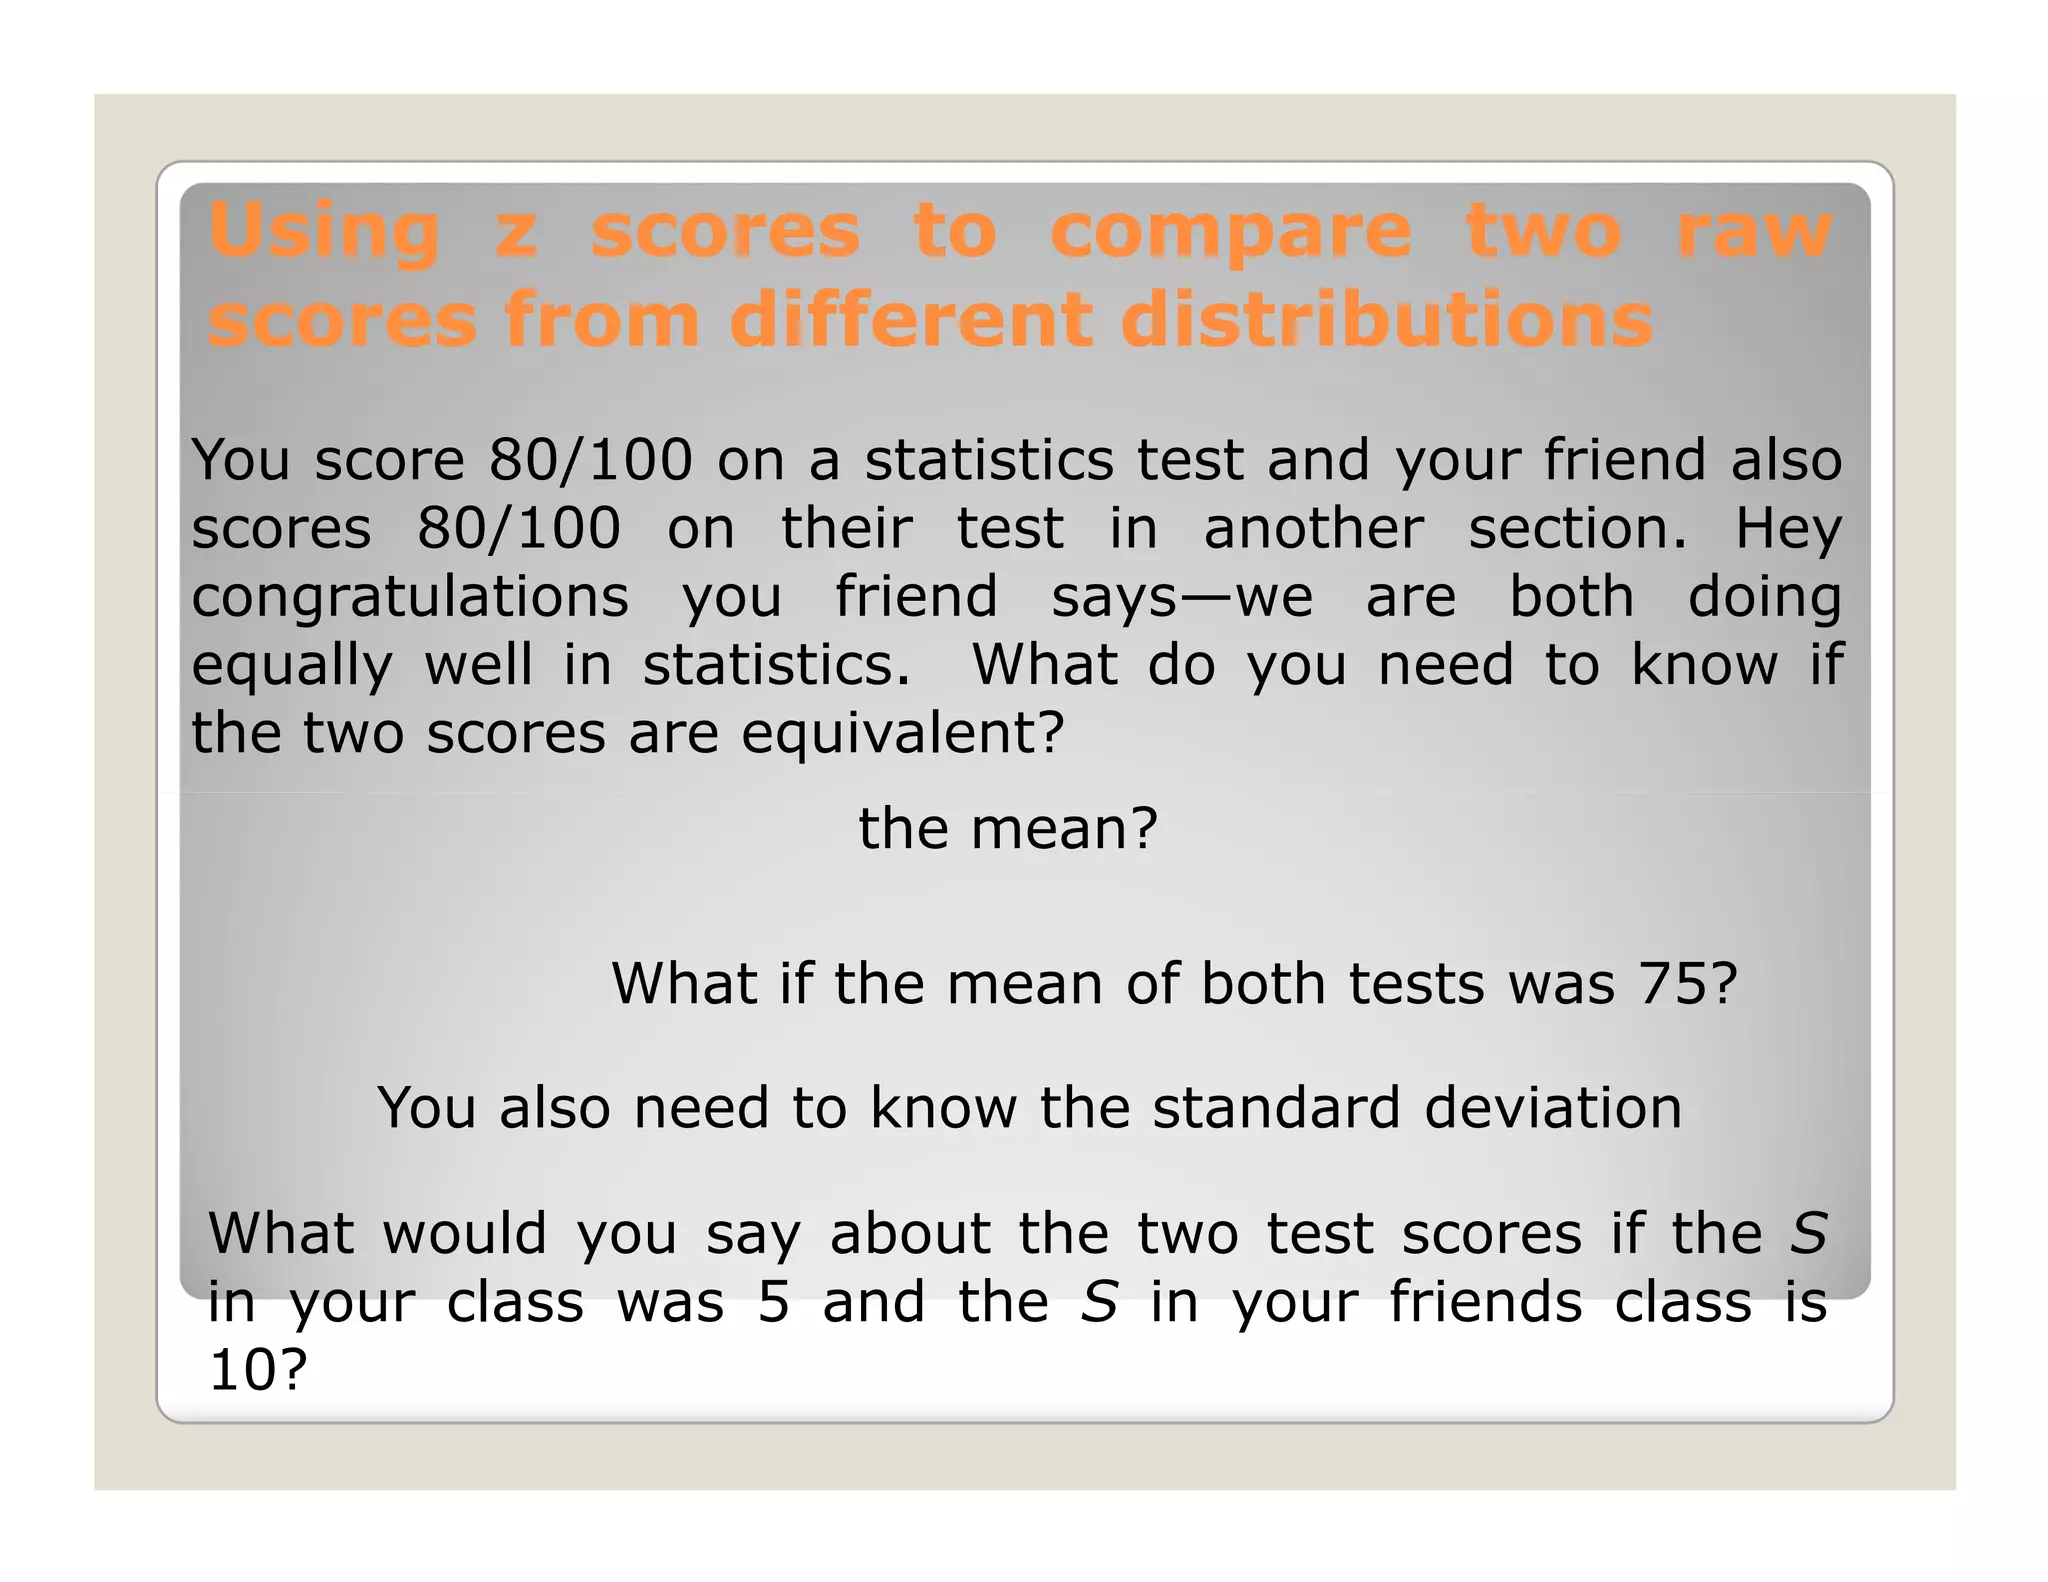
Using z scoresto compare two raw
scores from different distributions
You score 80/100 on a statistics test and your friend also
scores 80/100 on their test in another section. Hey
congratulations you friend says—we are both doing
equally well in statistics. What do you need to know if
the two scores are equivalent?
the mean?
What if the mean of both tests was 75?
You also need to know the standard deviation
What would you say about the two test scores if the S
in your class was 5 and the S in your friends class is
10?
6.
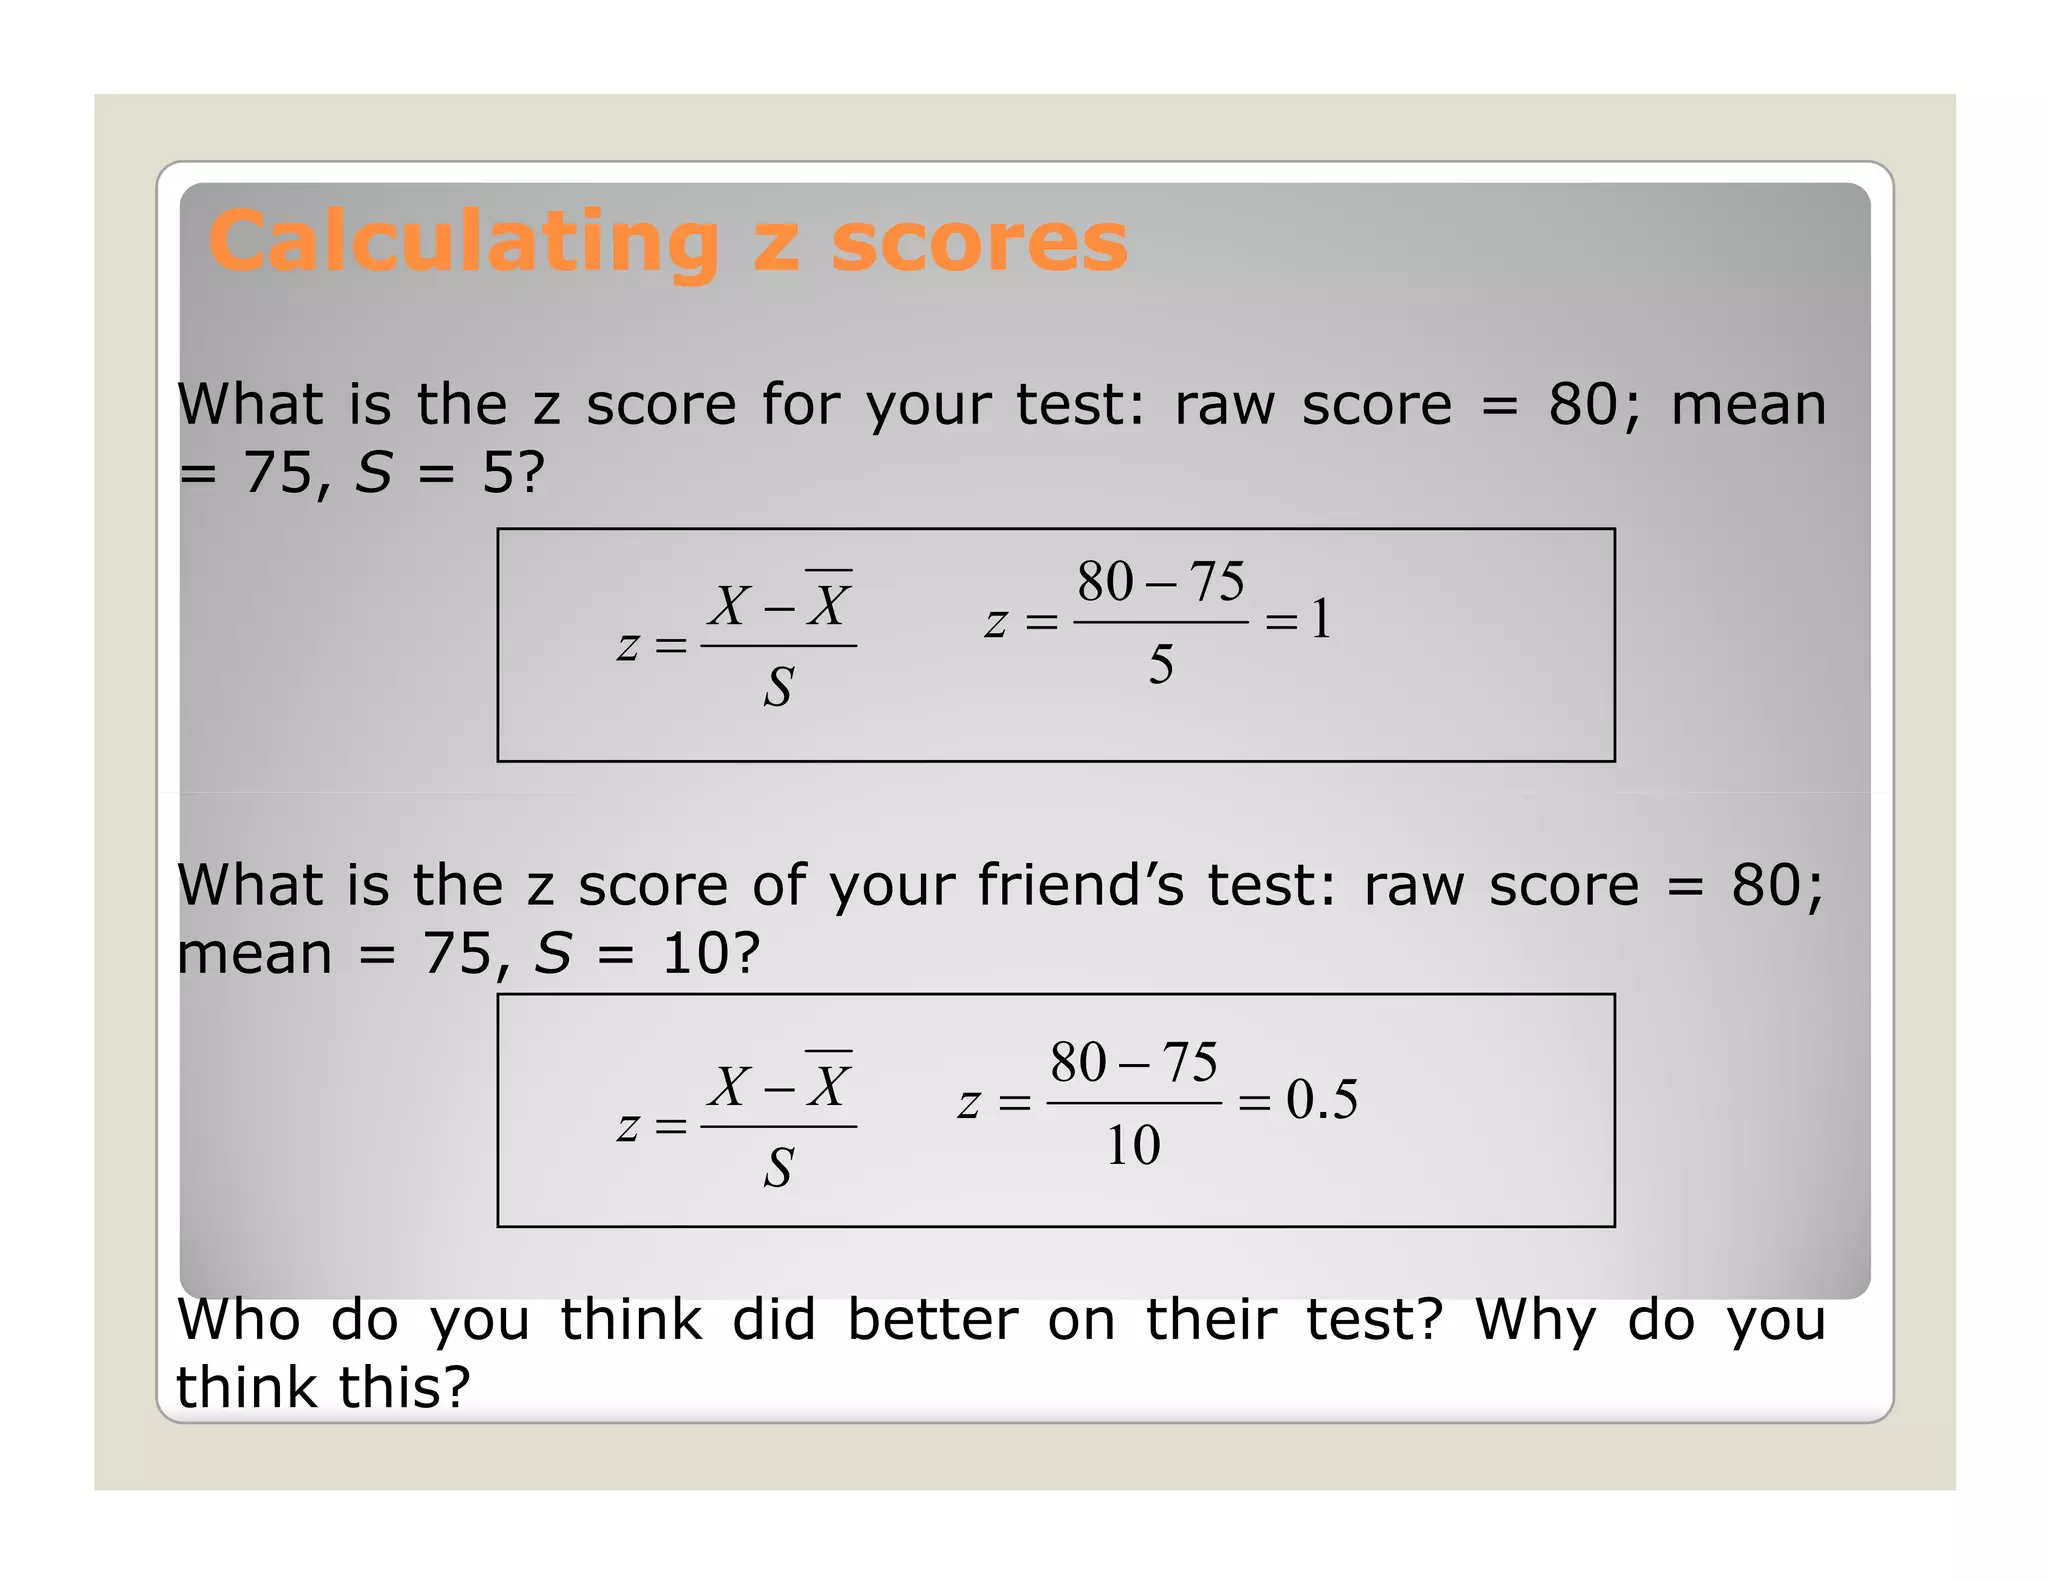
Calculating z scores
Whatis the z score for your test: raw score = 80; mean
= 75, S = 5?
X −X 80 − 75
z= z= =1
S 5
What is the z score of your friend’s test: raw score = 80;
mean = 75, S = 10?
X −X 80 − 75
z= z= = 0. 5
S 10
Who do you think did better on their test? Why do you
think this?
7.
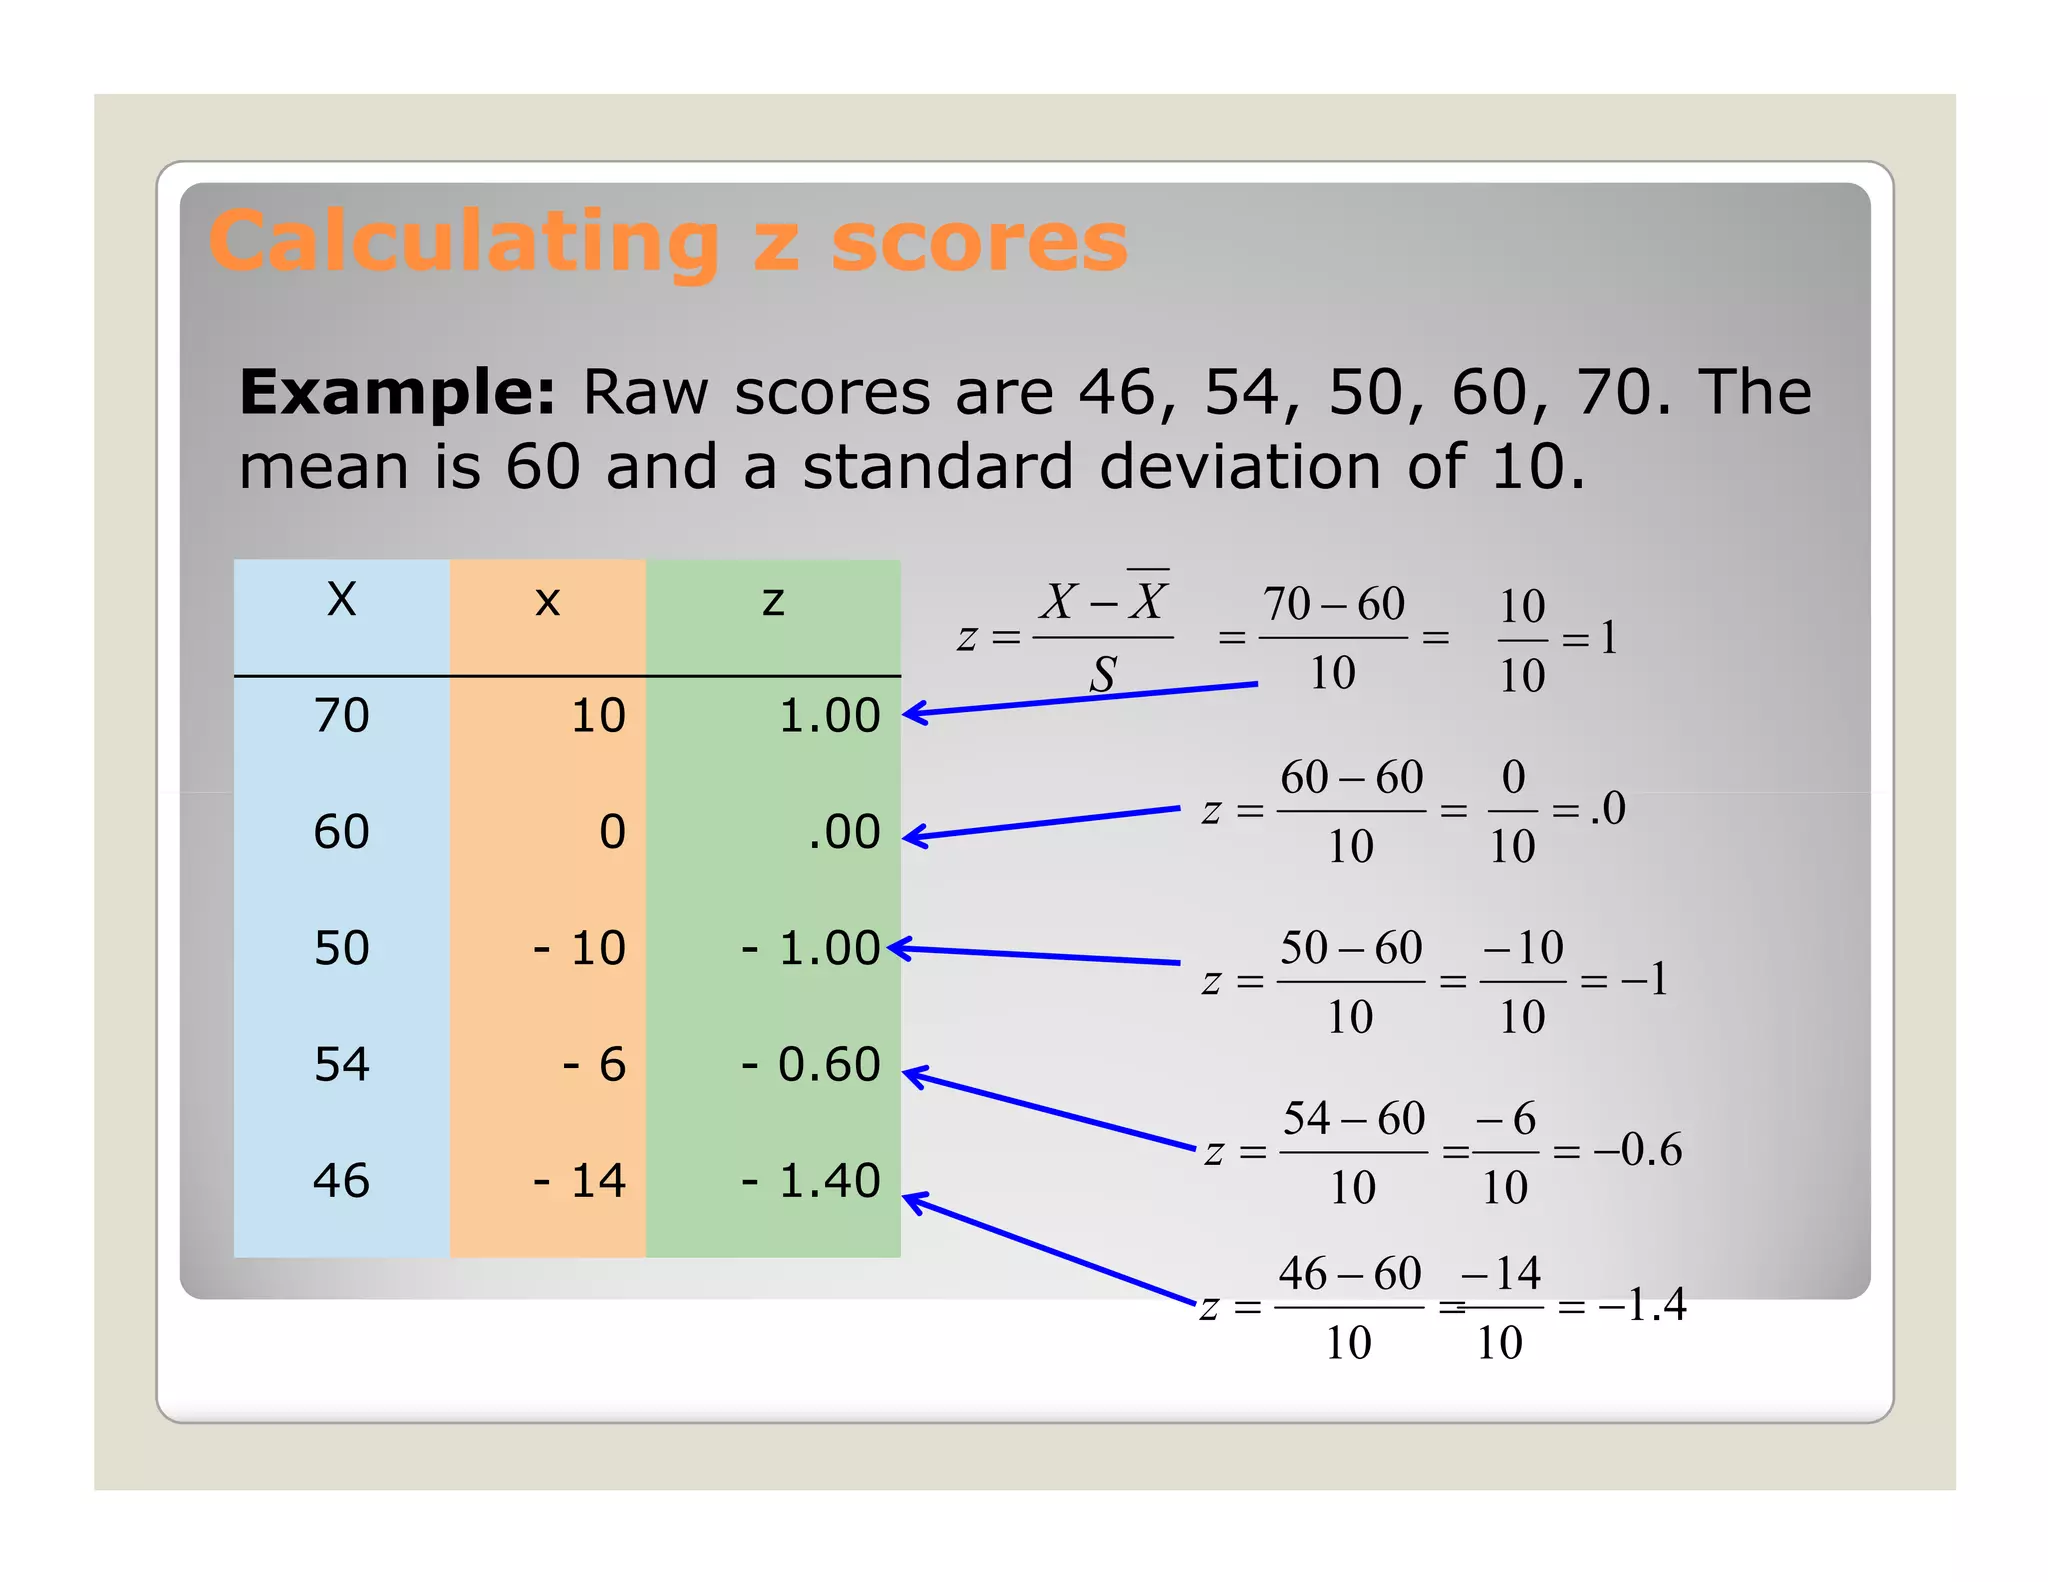
Calculating z scores
Example:Raw scores are 46, 54, 50, 60, 70. The
mean is 60 and a standard deviation of 10.
X x z X −X 70 − 60 10
z= = = =1
S 10 10
70 10 1.00
60 − 60 0
60 0 .00
z= = = .0
10 10
50 - 10 - 1.00 50 − 60 − 10
z= = = −1
10 10
54 -6 - 0.60
54 − 60 − 6
z= = = −0.6
46 - 14 - 1.40 10 10
46 − 60 − 14
z= = = −1.4
10 10
8.
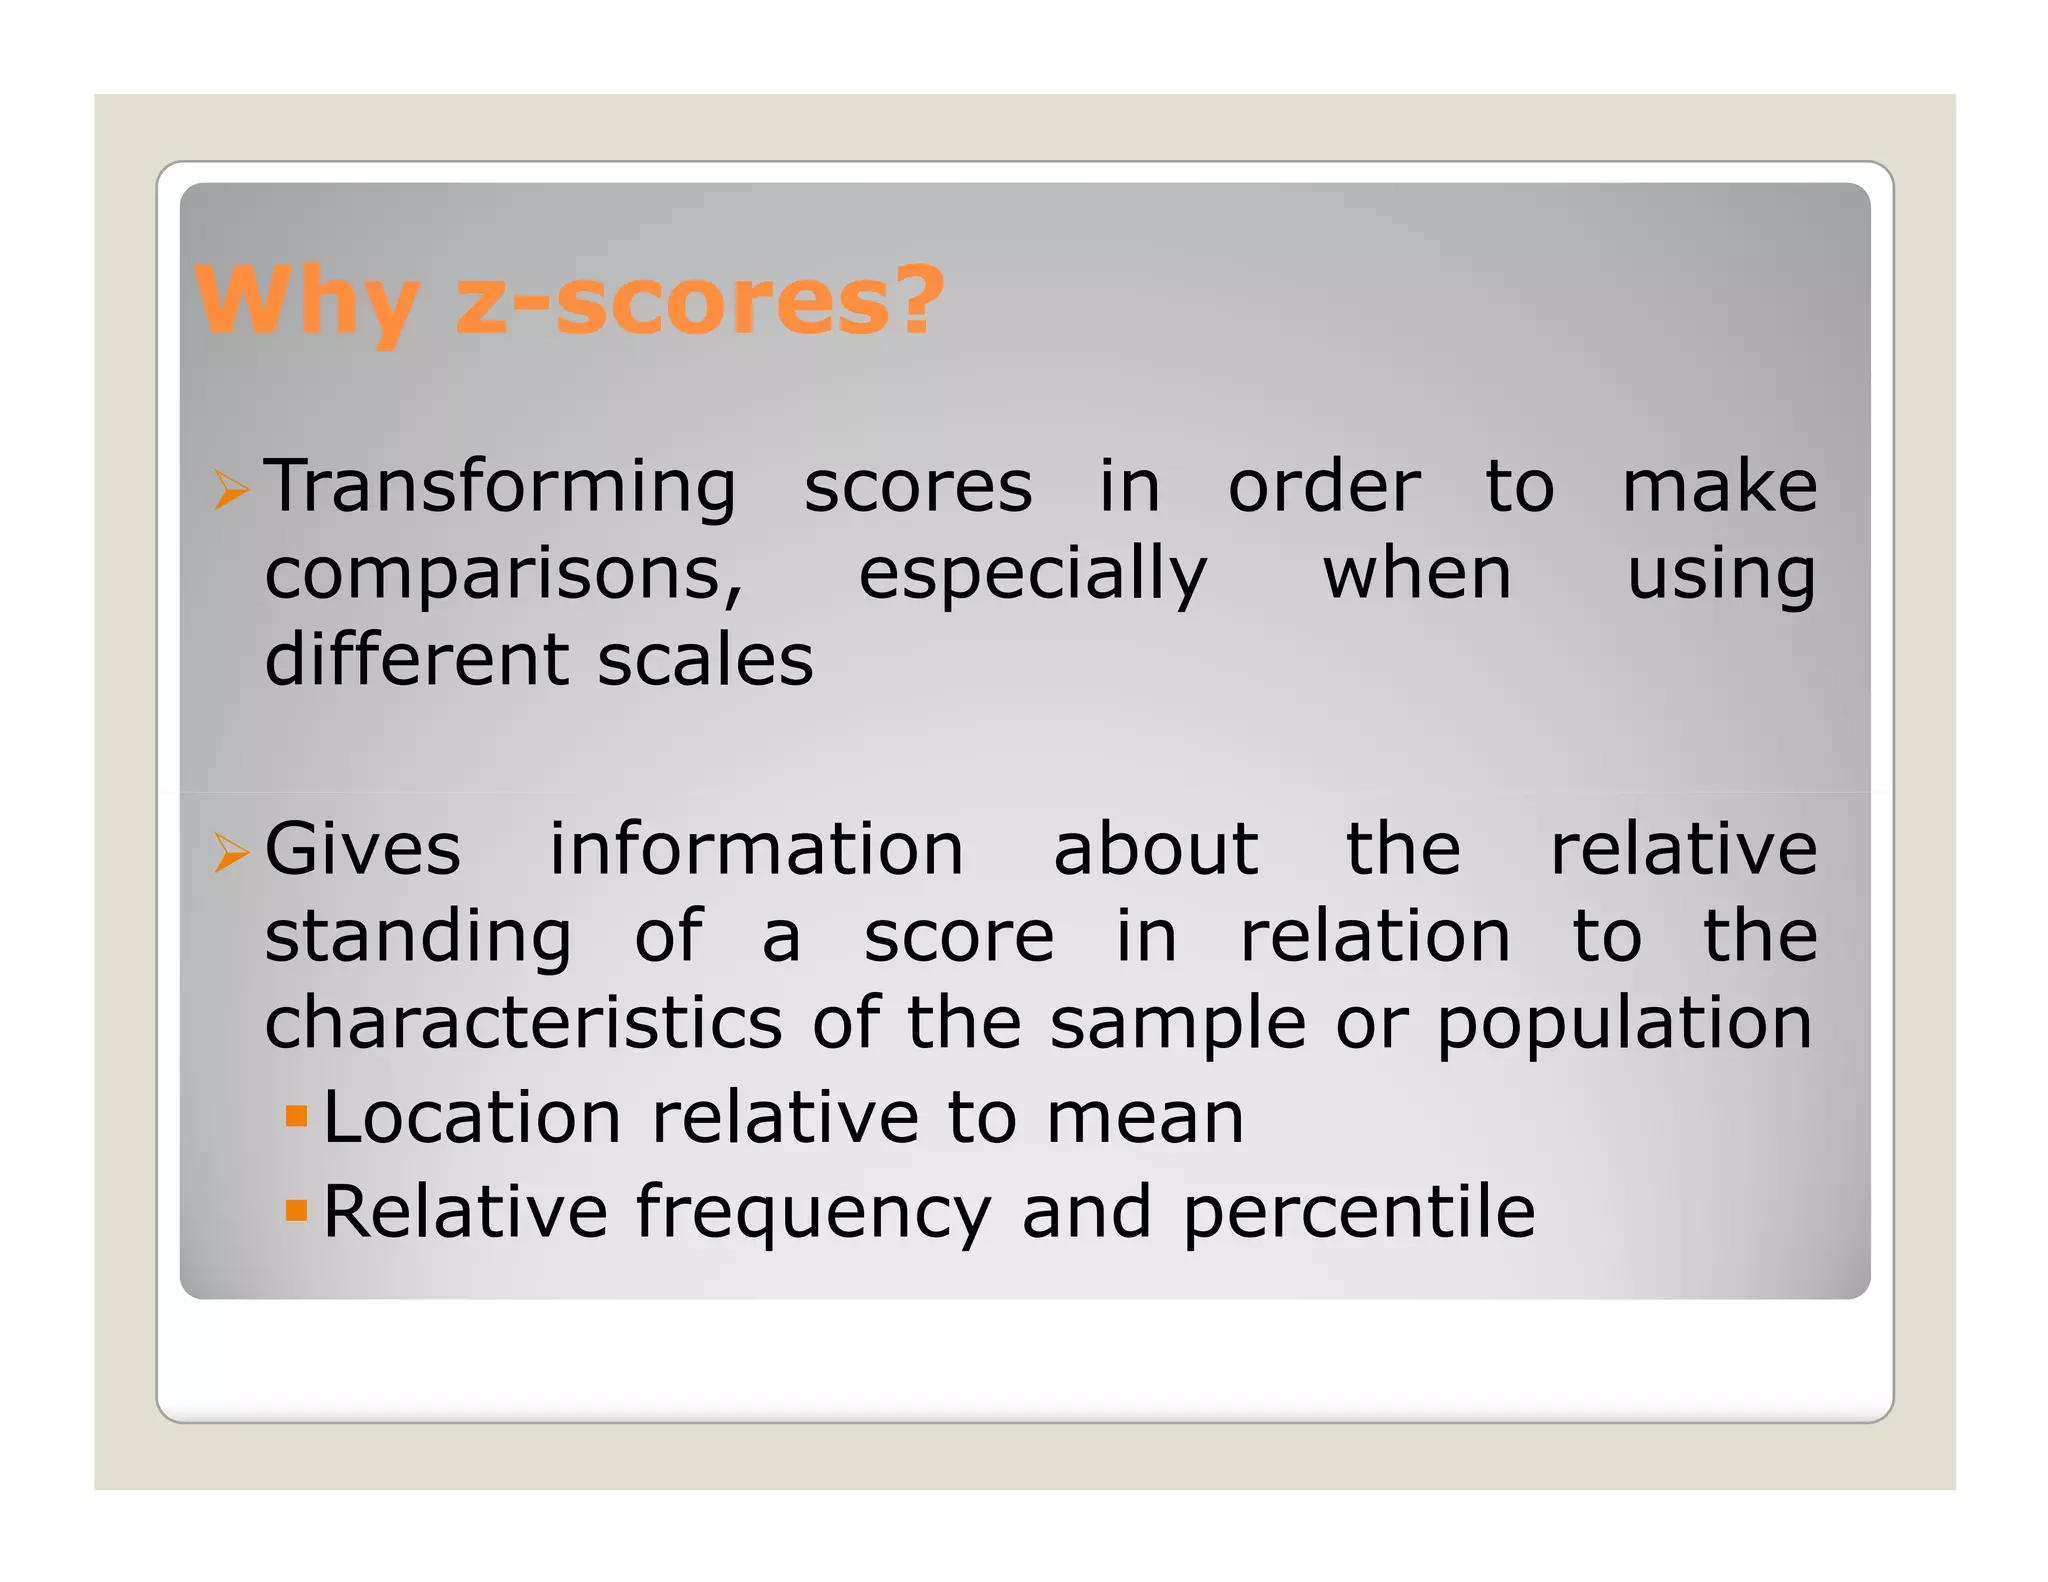
Why z-scores?
z-
Transforming scores in order to make
comparisons, especially when using
different scales
Gives information about the relative
standing of a score in relation to the
characteristics of the sample or population
Location relative to mean
Relative frequency and percentile
9.
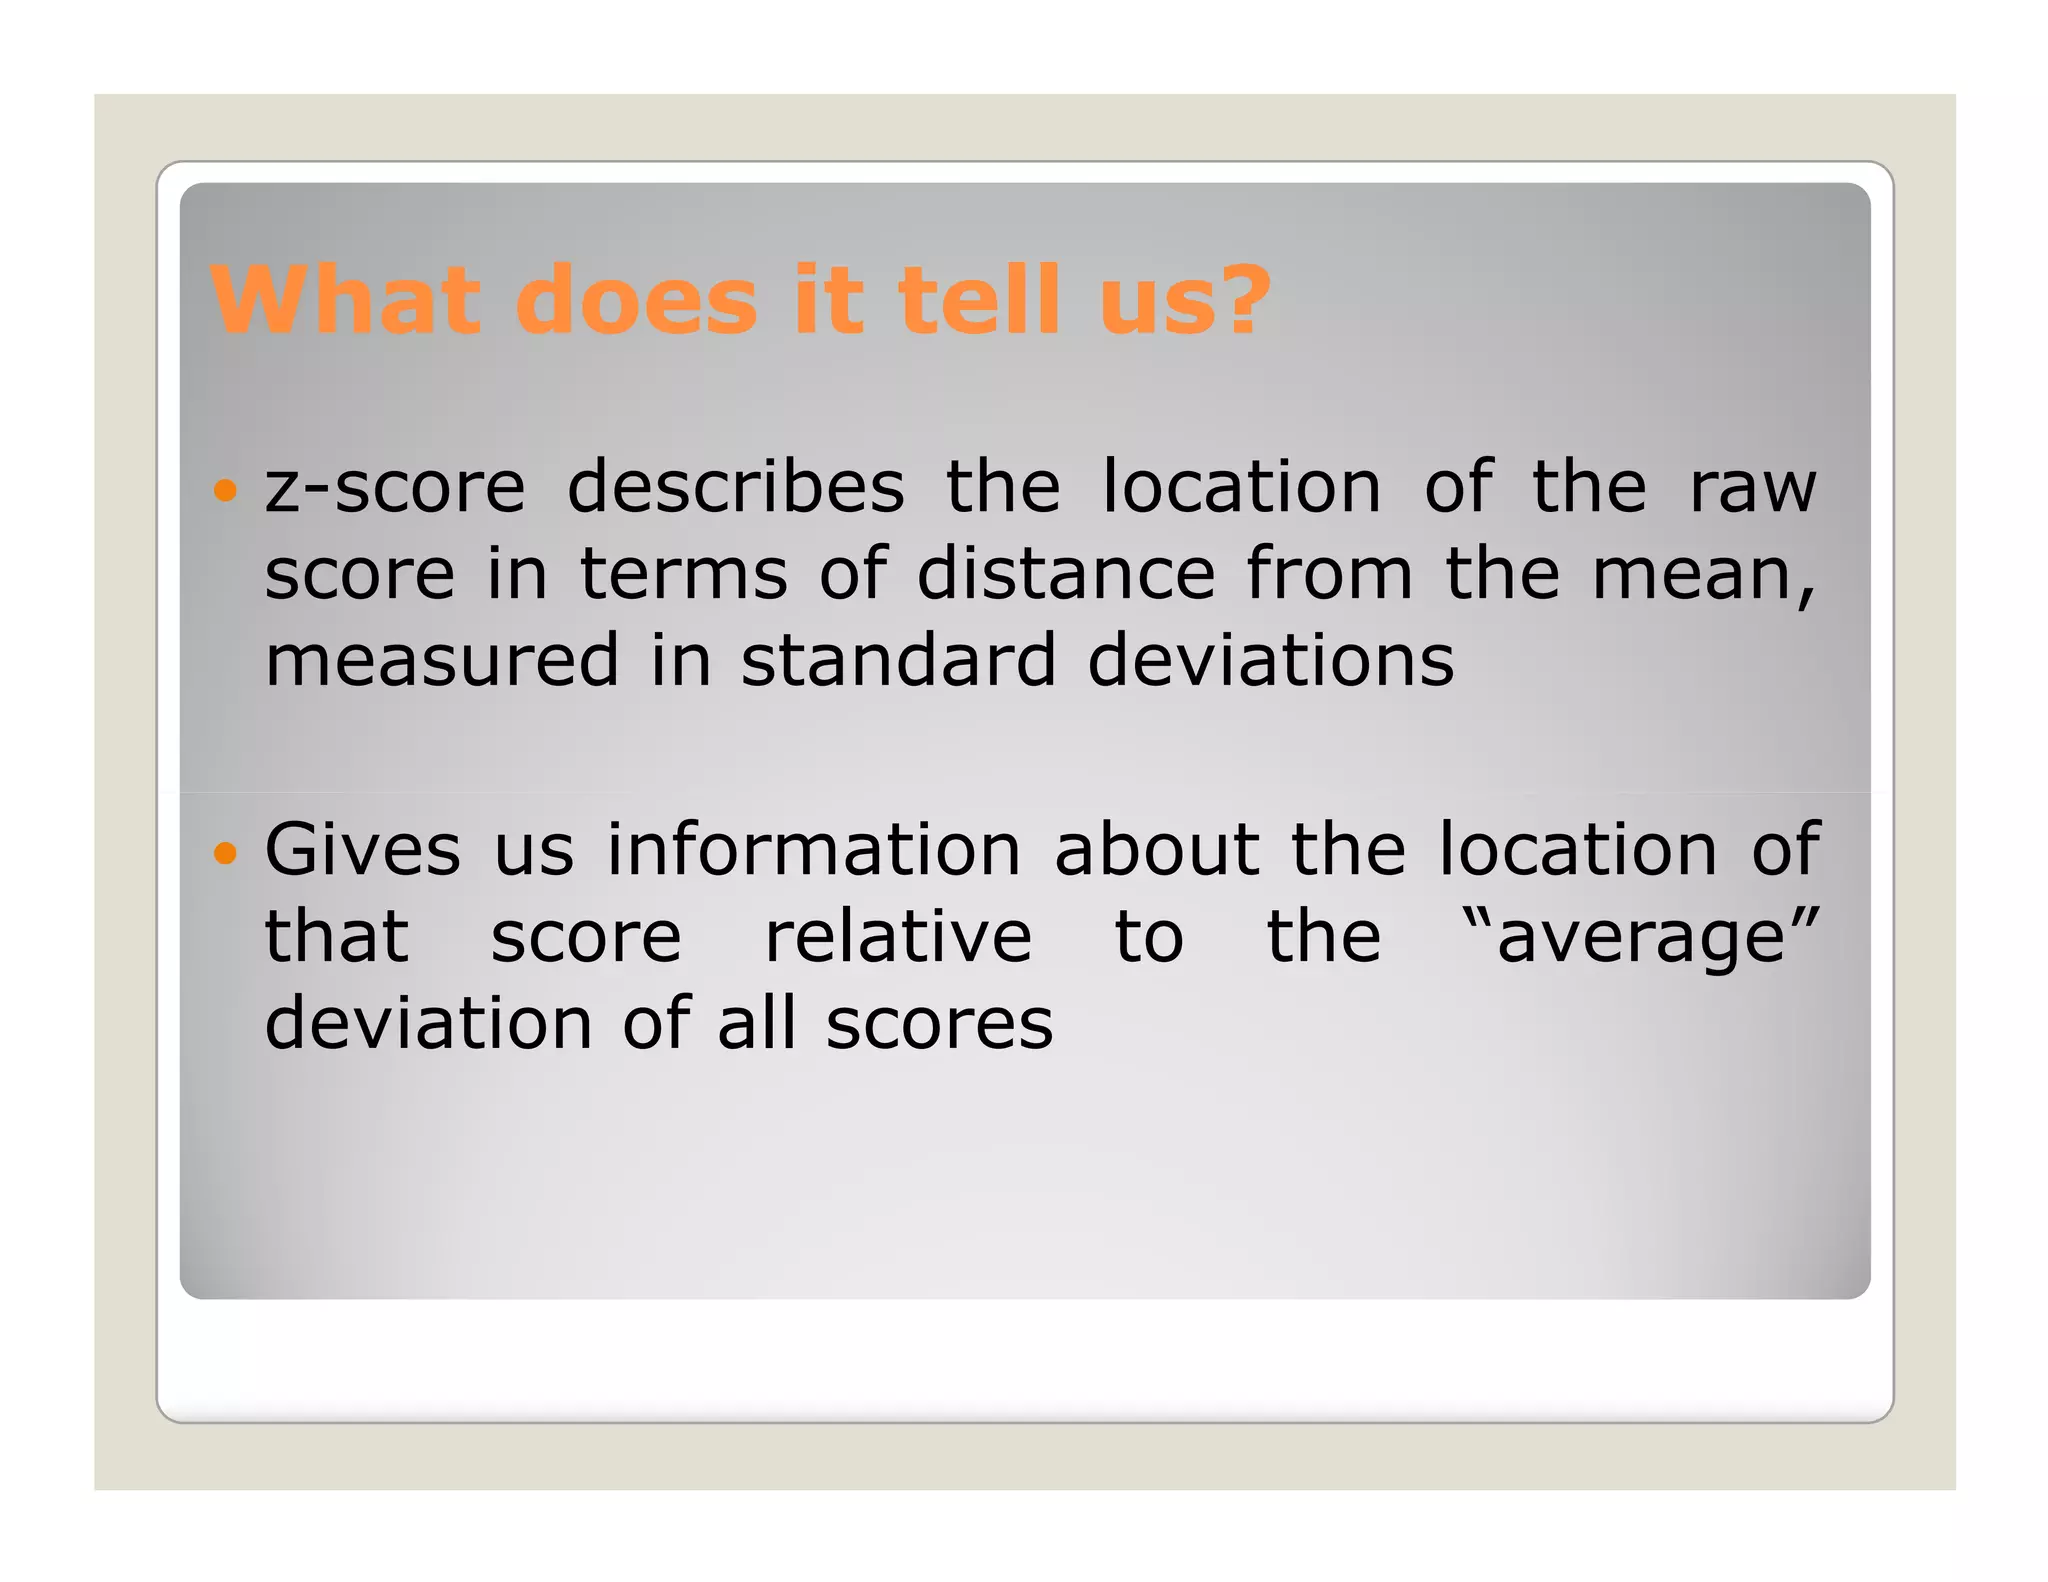
What does ittell us?
z-score describes the location of the raw
score in terms of distance from the mean,
measured in standard deviations
Gives us information about the location of
that score relative to the “average”
deviation of all scores
10.
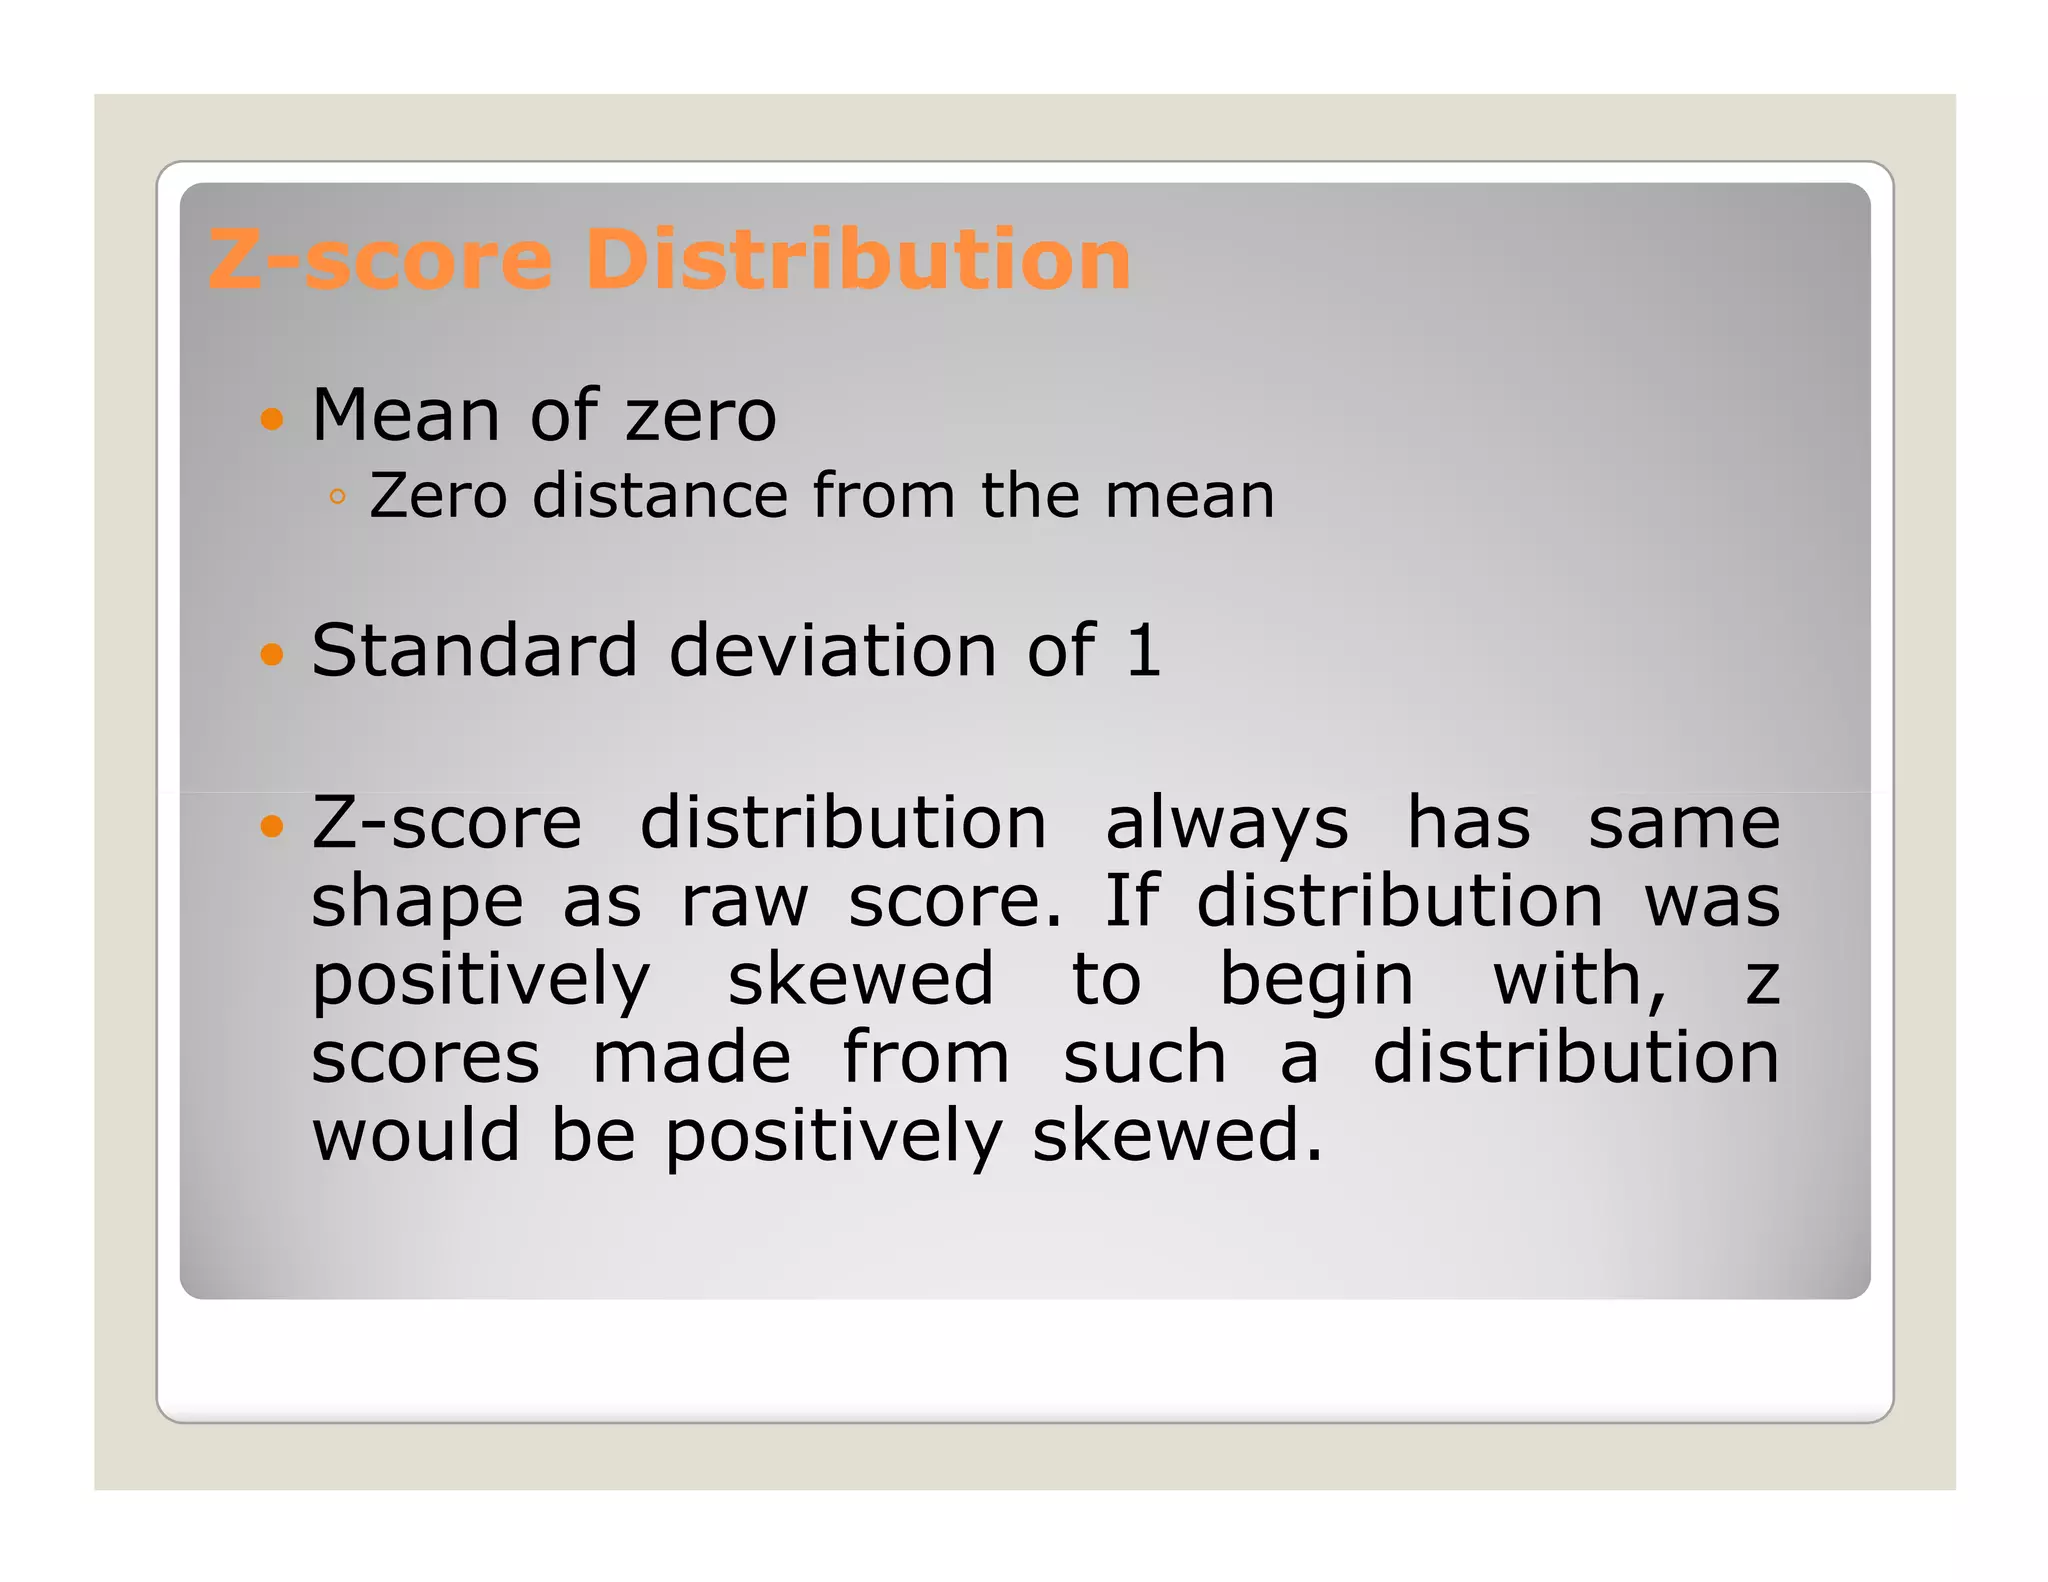
Z-score Distribution
Mean of zero
◦ Zero distance from the mean
Standard deviation of 1
Z-score distribution always has same
shape as raw score. If distribution was
positively skewed to begin with, z
scores made from such a distribution
would be positively skewed.
11.
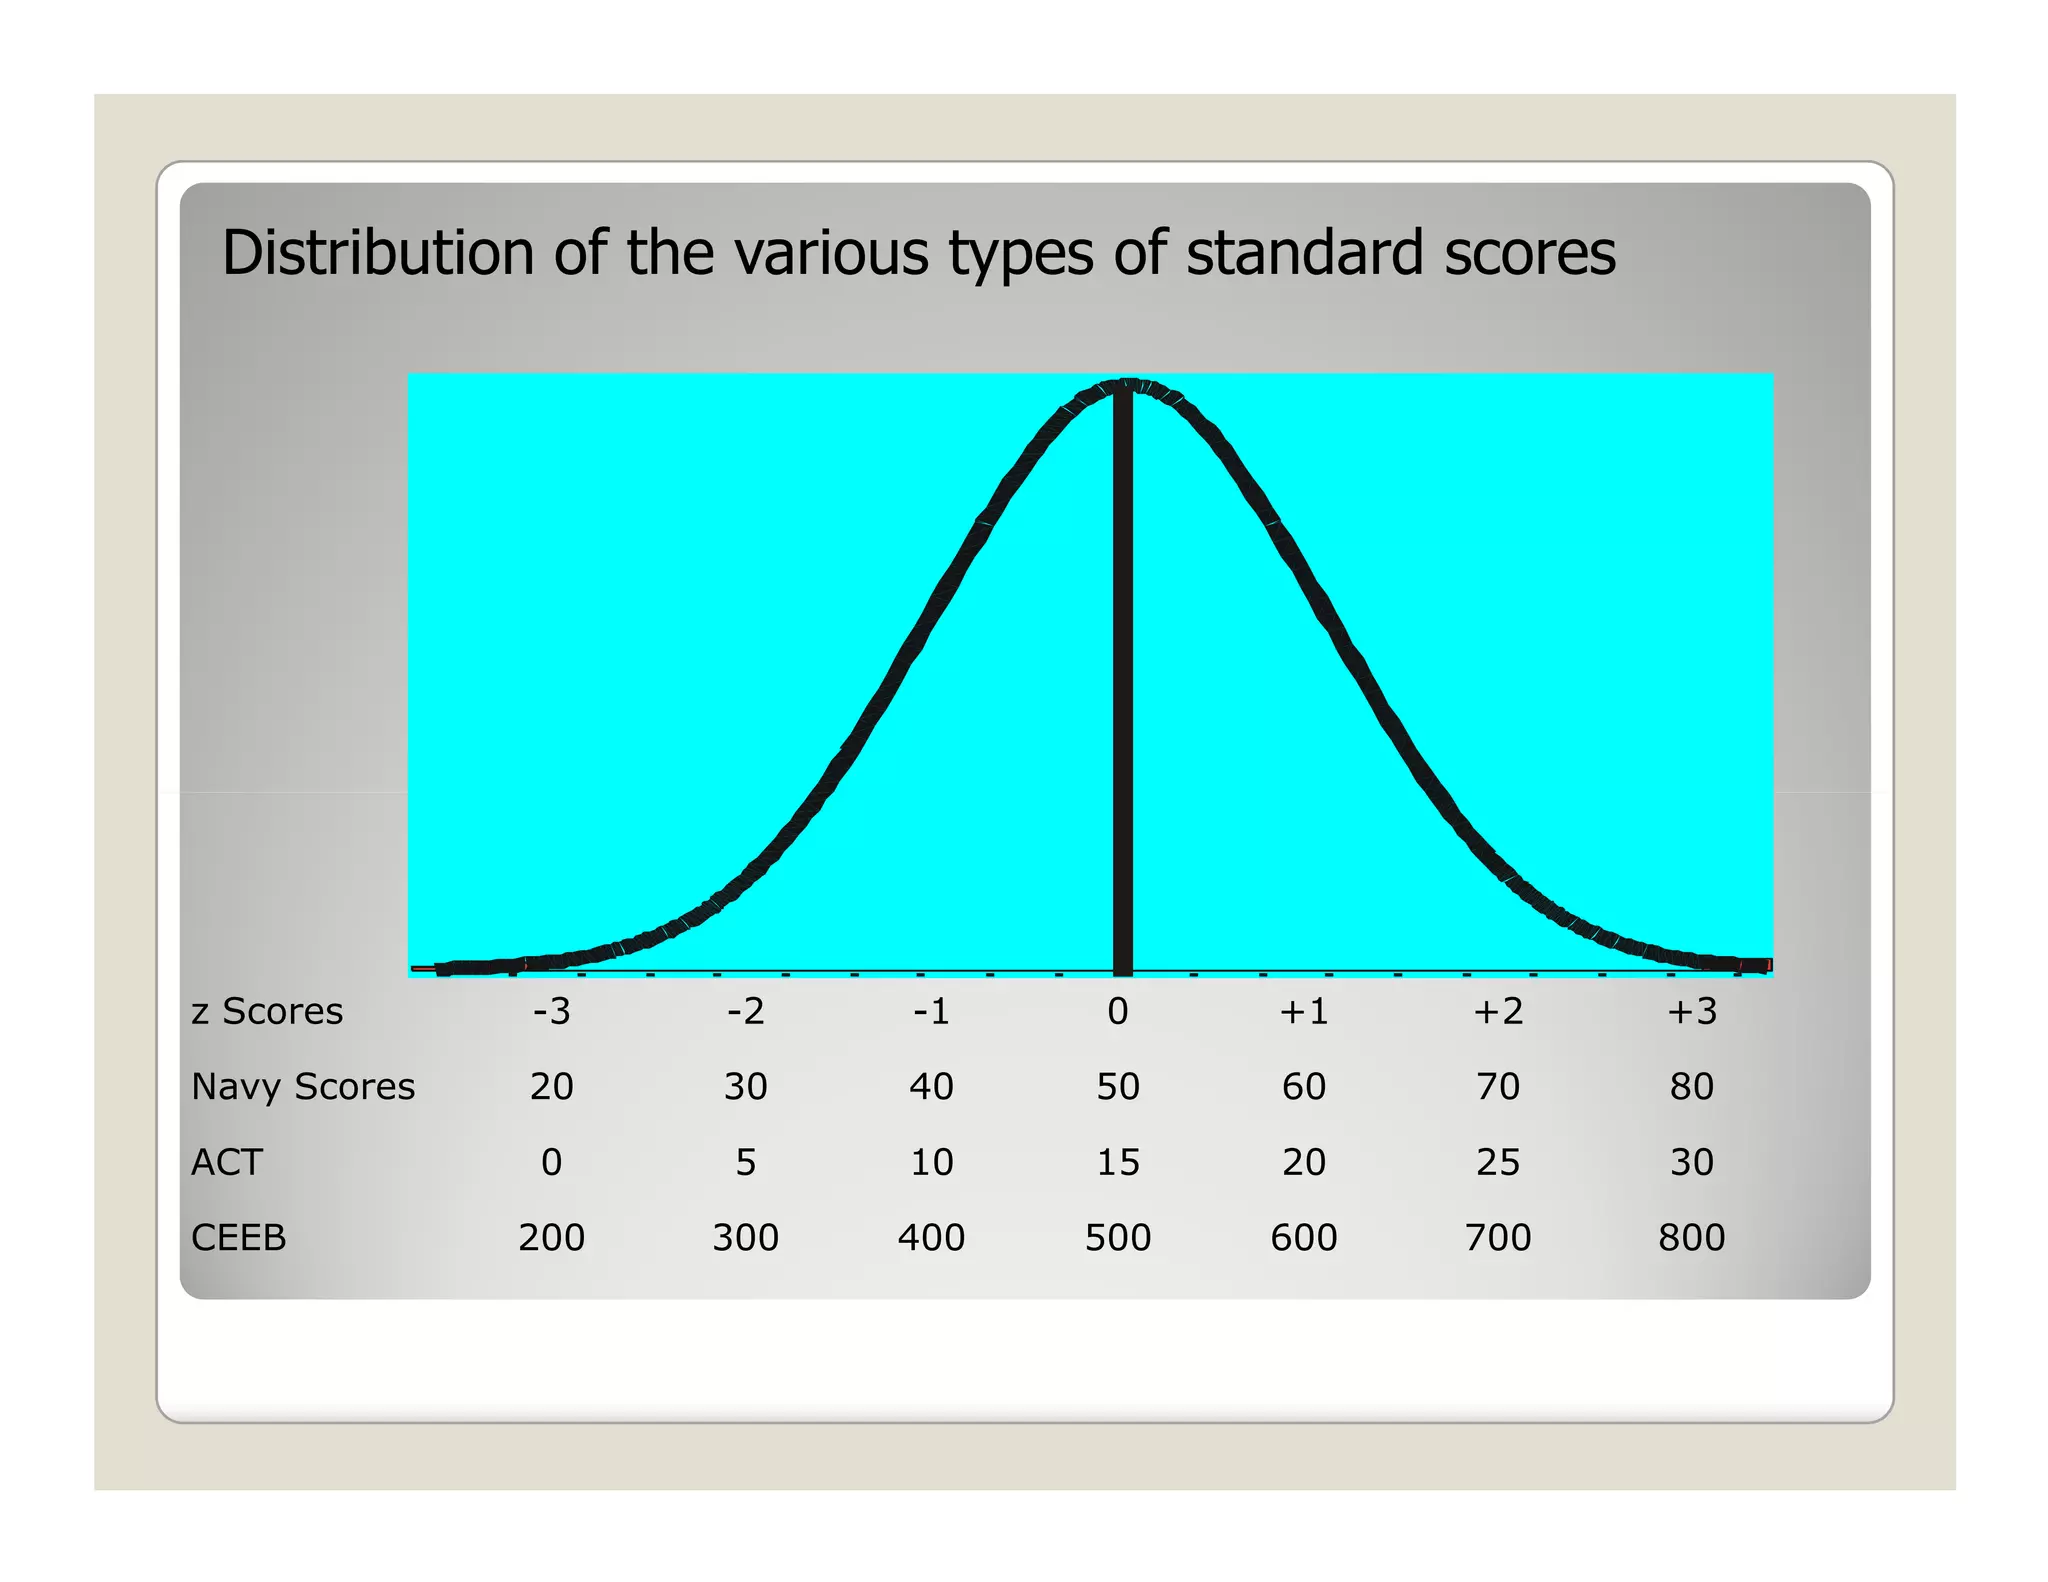
Distribution of thevarious types of standard scores
z Scores -3 -2 -1 0 +1 +2 +3
Navy Scores 20 30 40 50 60 70 80
ACT 0 5 10 15 20 25 30
CEEB 200 300 400 500 600 700 800
12.
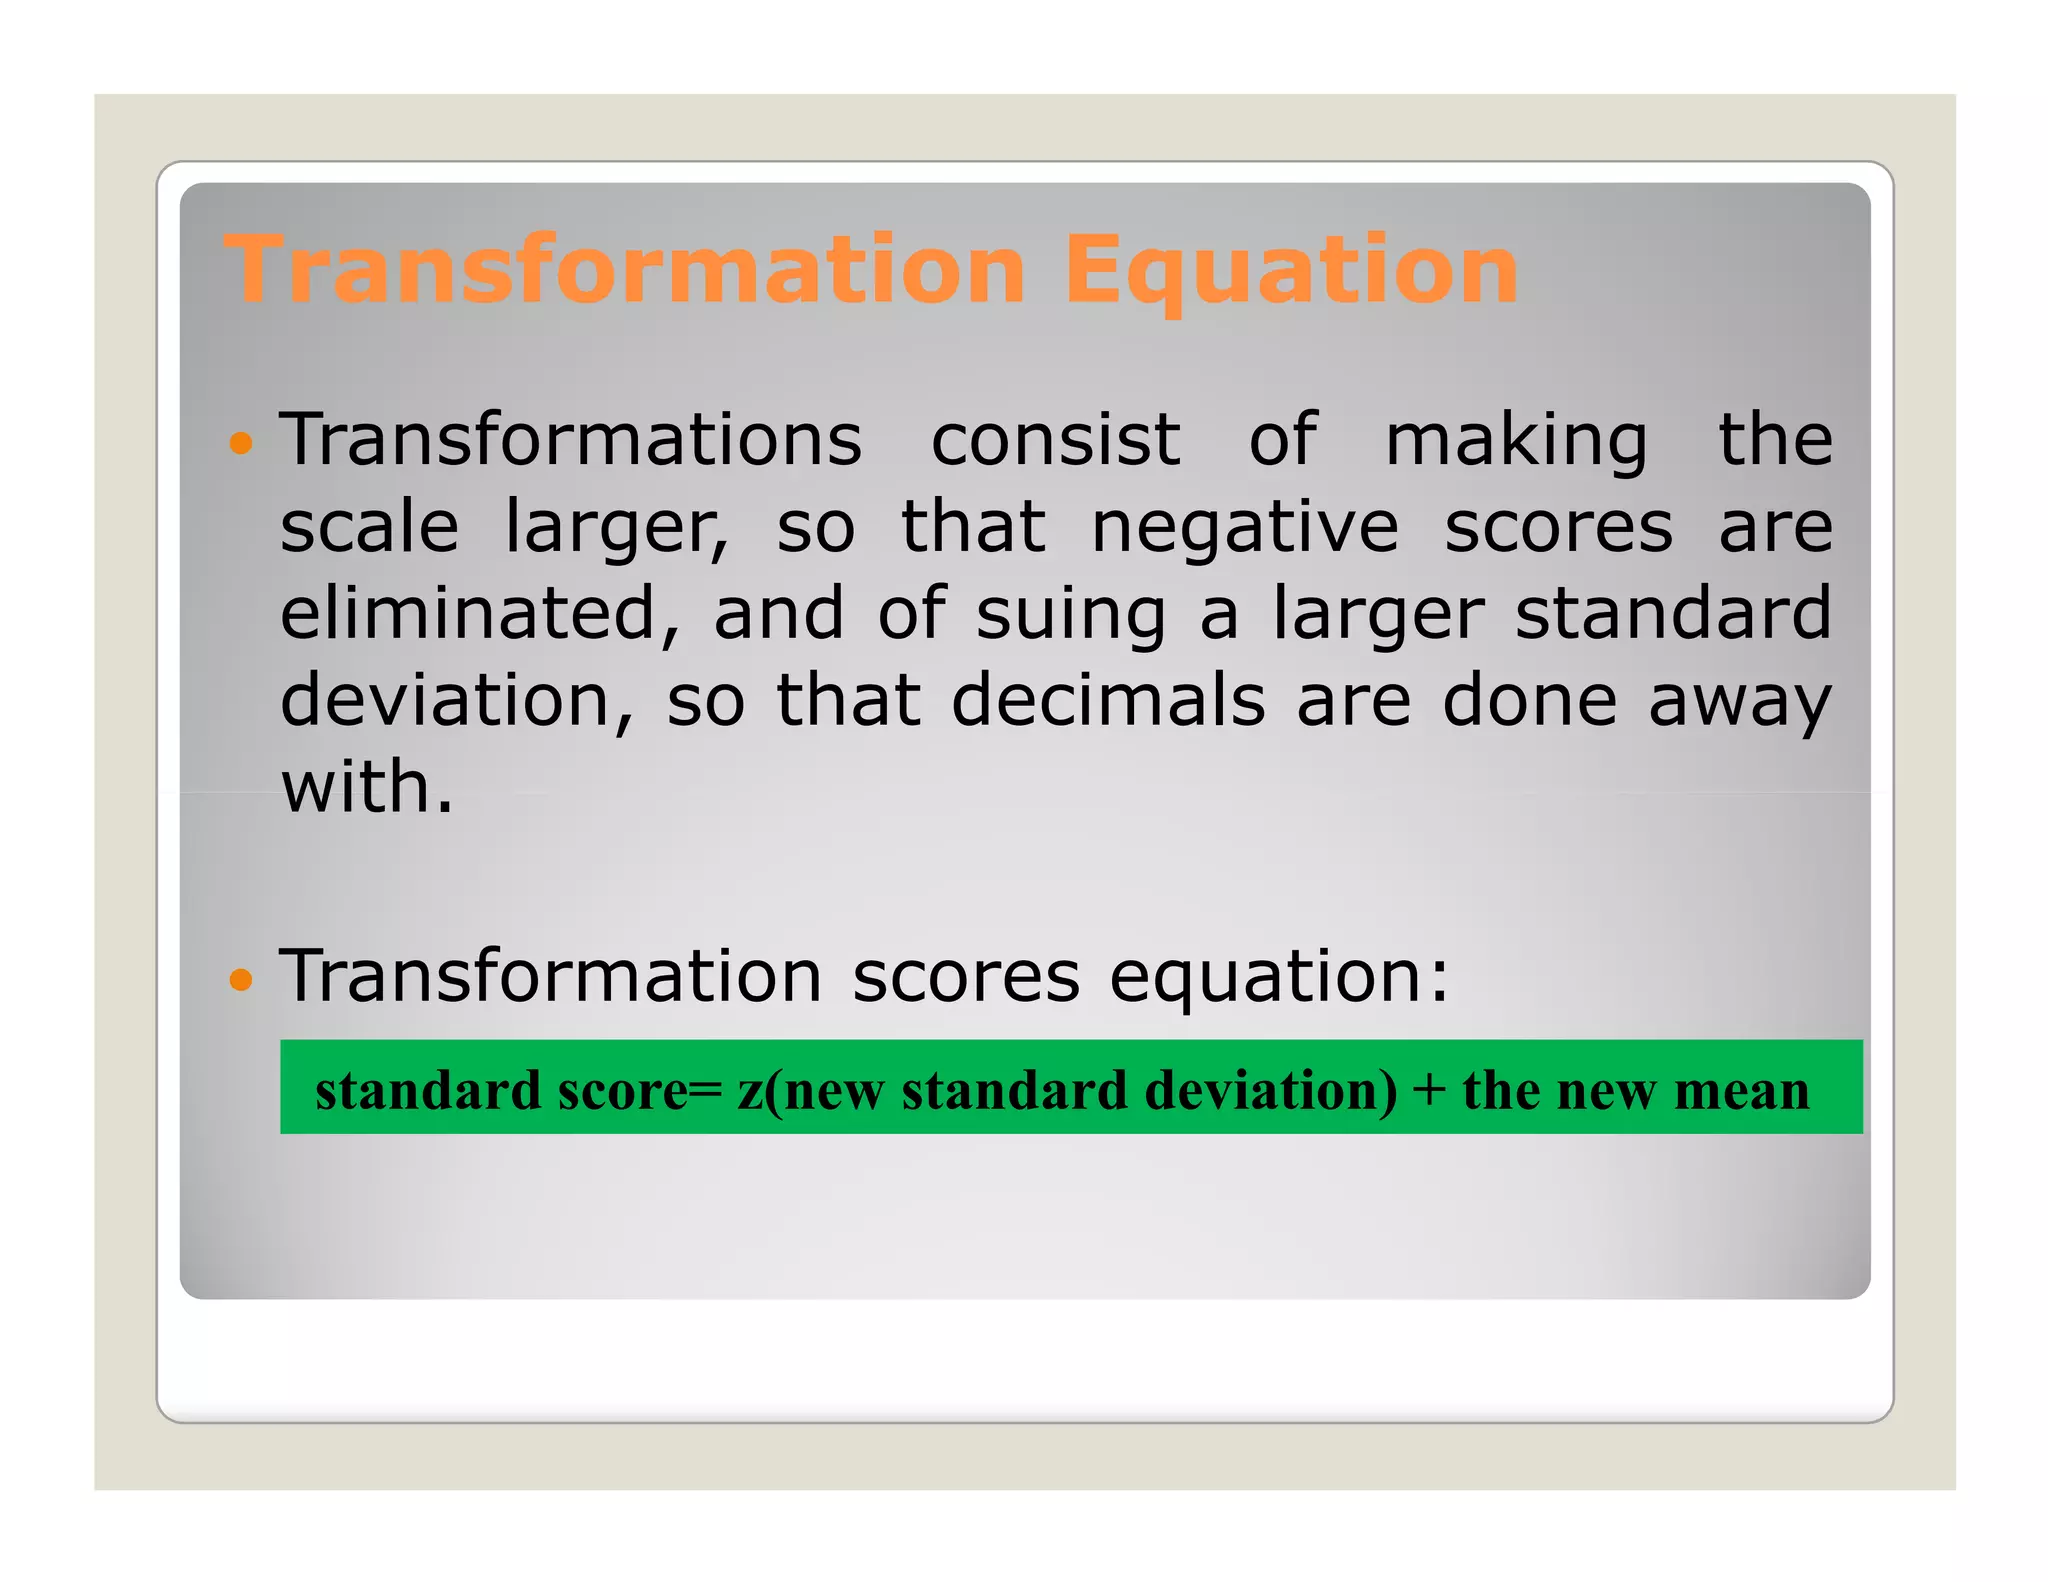
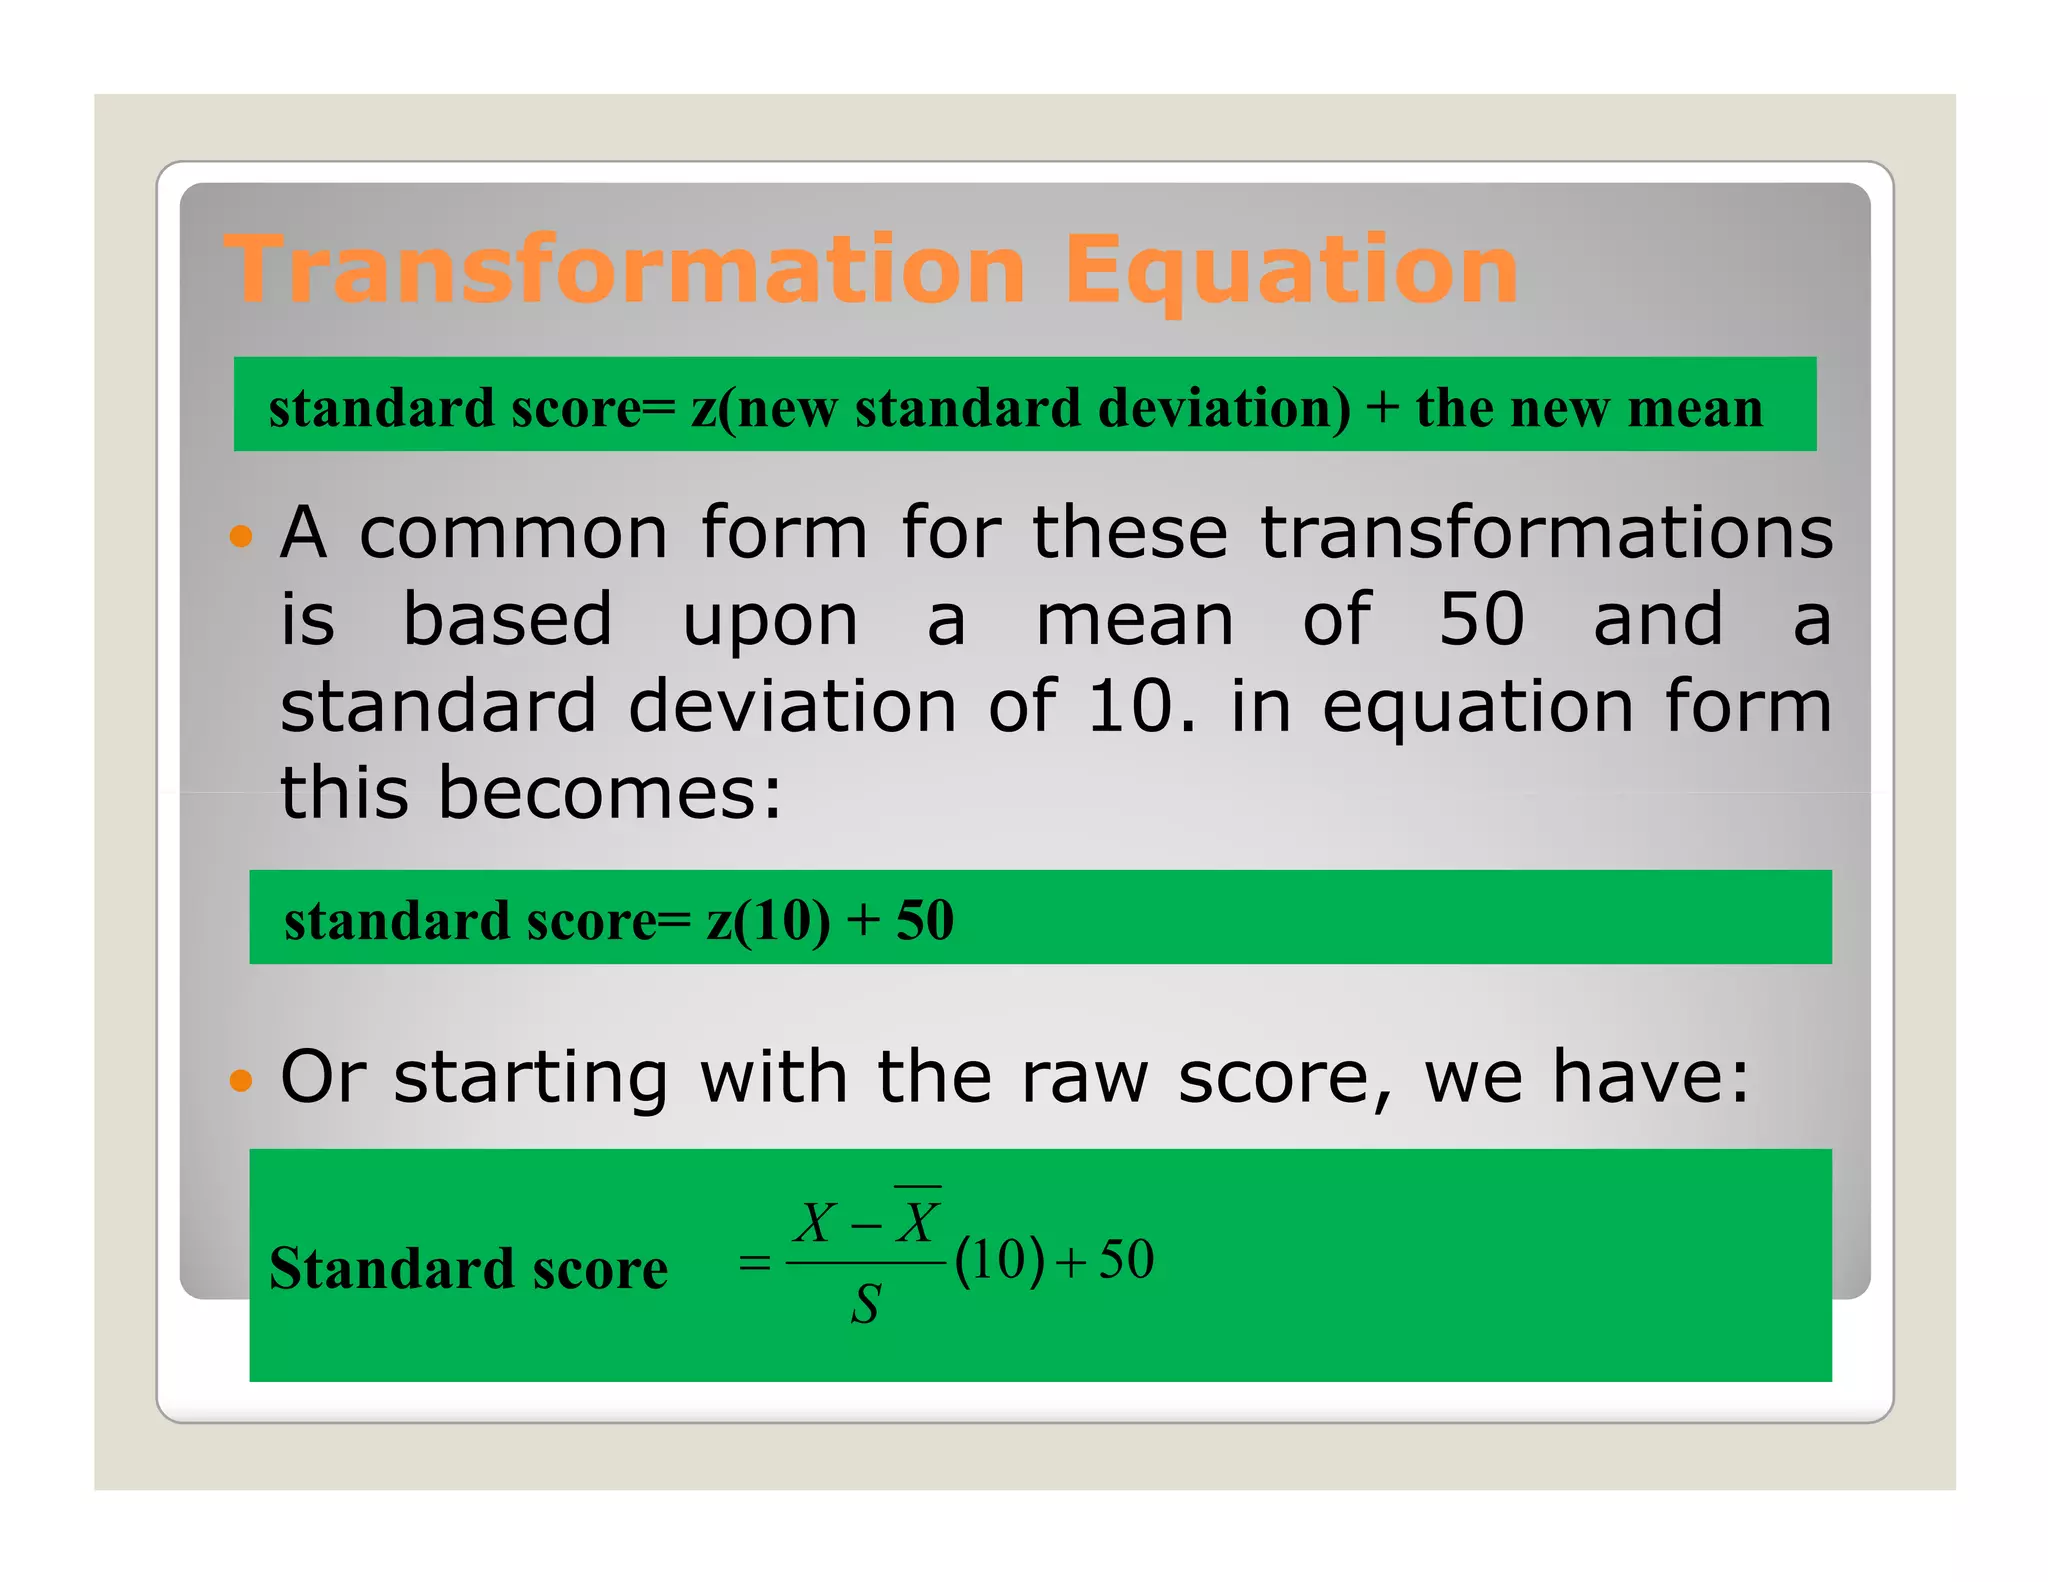
Transformation Equation
Transformationsconsist of making the
scale larger, so that negative scores are
eliminated, and of suing a larger standard
deviation, so that decimals are done away
with.
Transformation scores equation:
standard score= z(new standard deviation) + the new mean
13.
Transformation Equation
standard score=z(new standard deviation) + the new mean
A common form for these transformations
is based upon a mean of 50 and a
standard deviation of 10. in equation form
this becomes:
standard score= z(10) + 50
Or starting with the raw score, we have:
X−X
Standard score = (10) + 50
S
14.
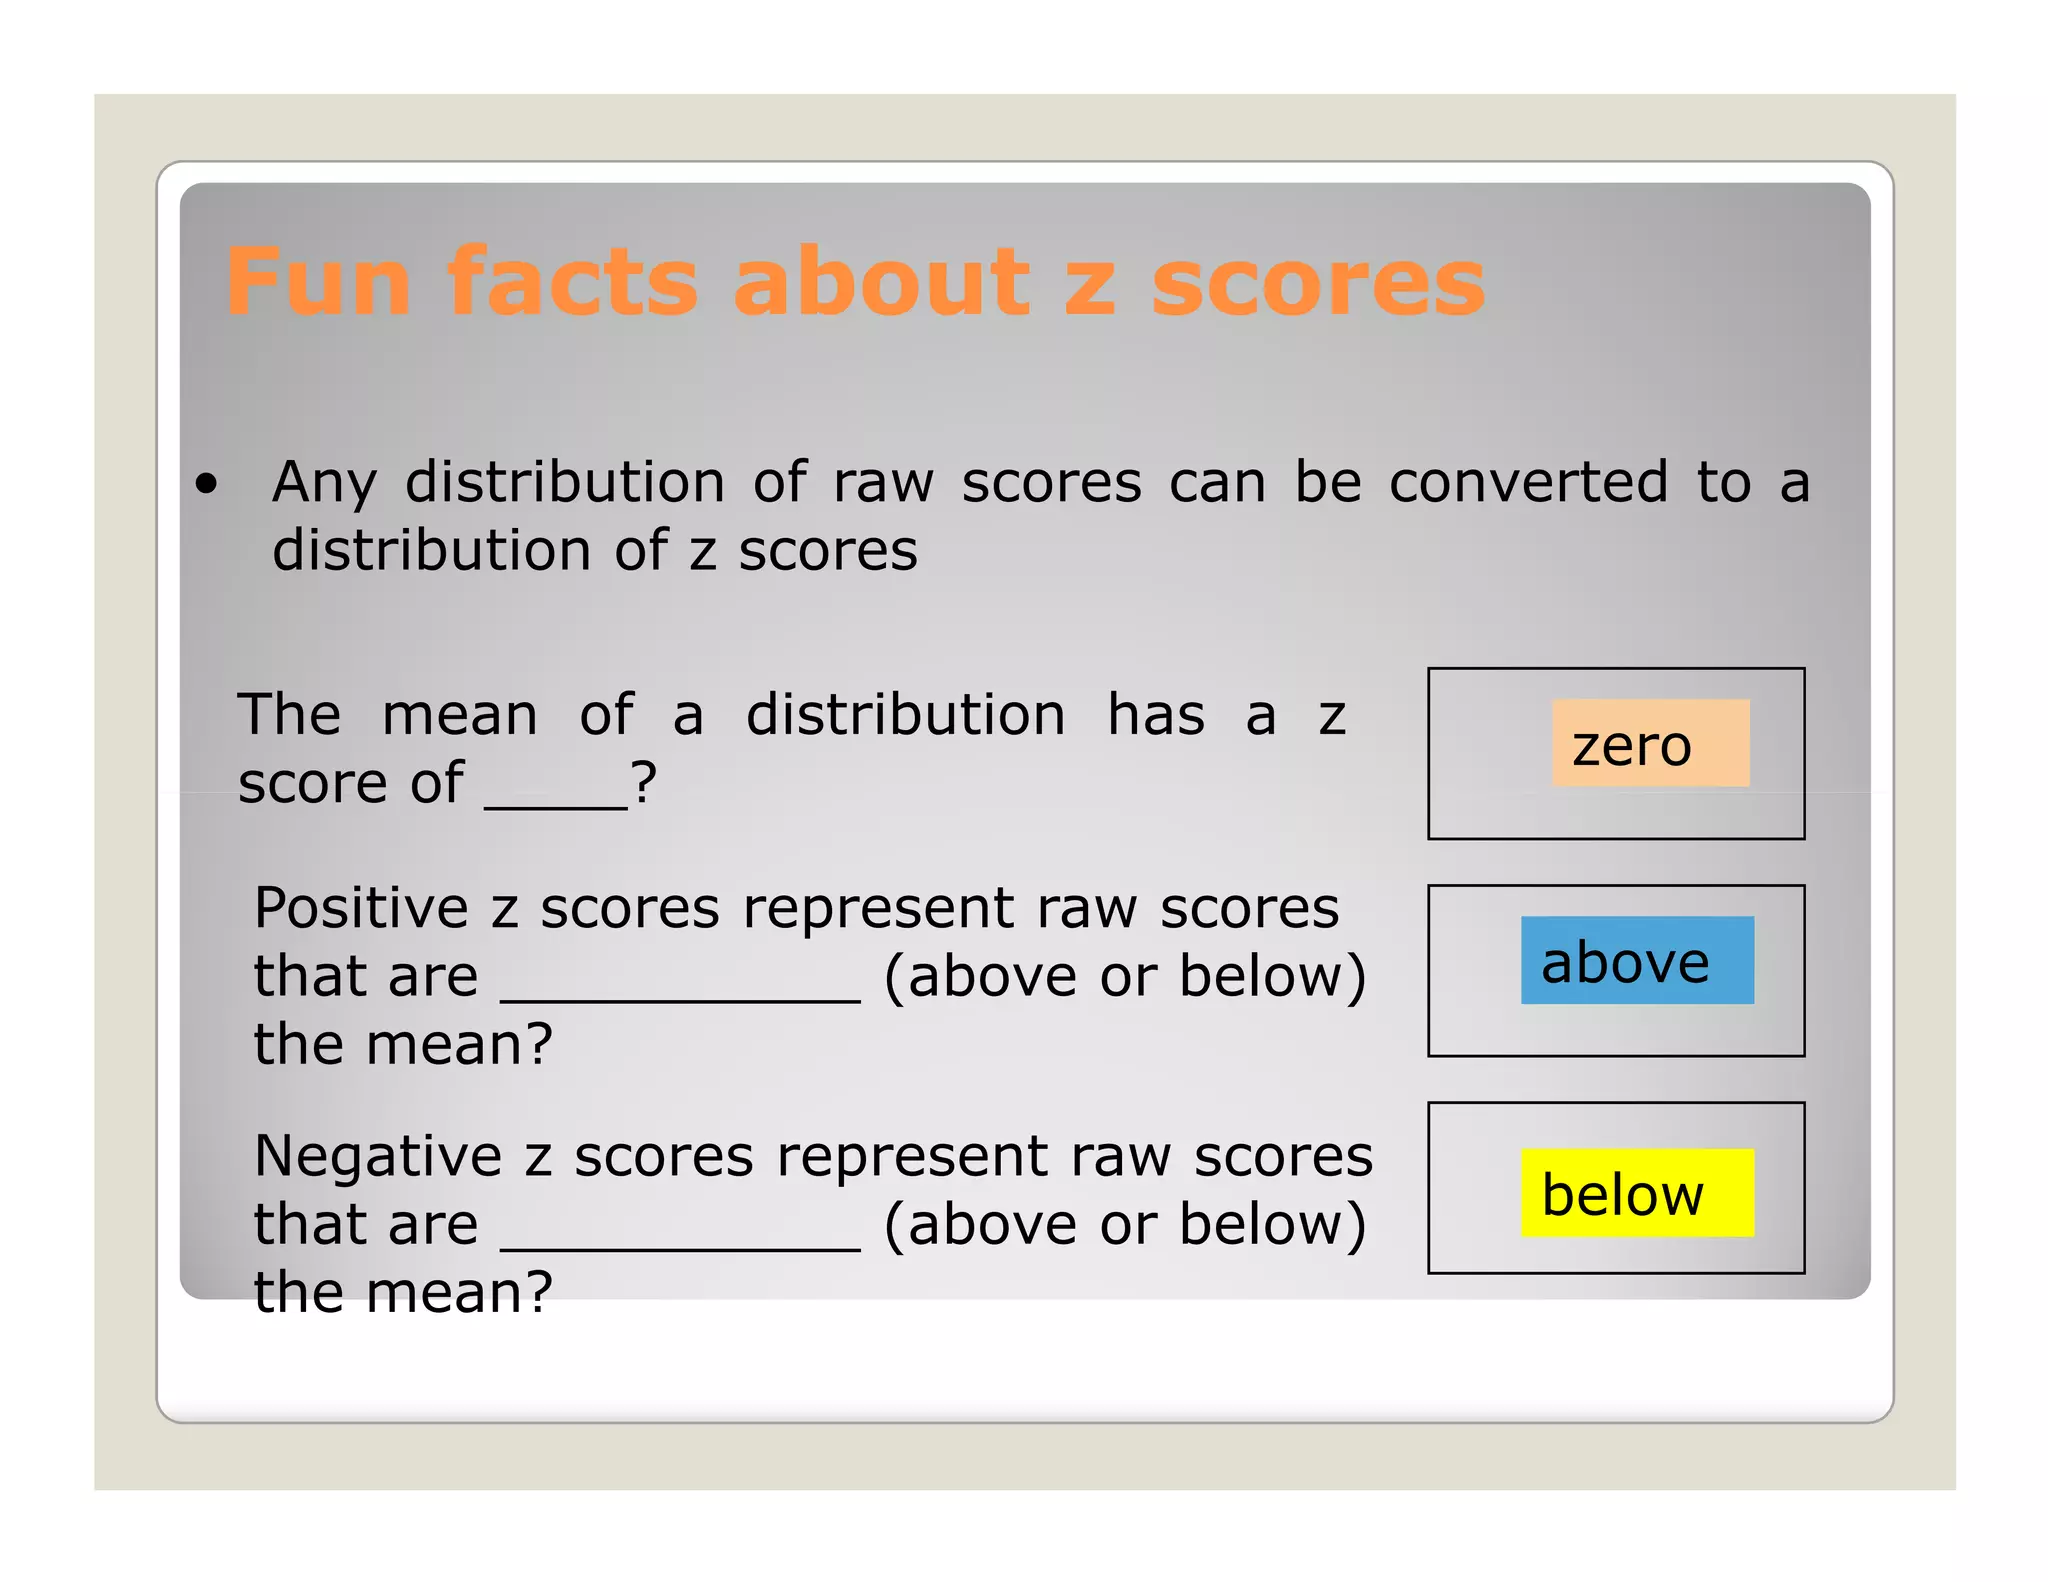
Fun facts aboutz scores
• Any distribution of raw scores can be converted to a
distribution of z scores
The mean of a distribution has a z
zero
score of ____?
Positive z scores represent raw scores
that are __________ (above or below) above
the mean?
Negative z scores represent raw scores
below
that are __________ (above or below)
the mean?
15.
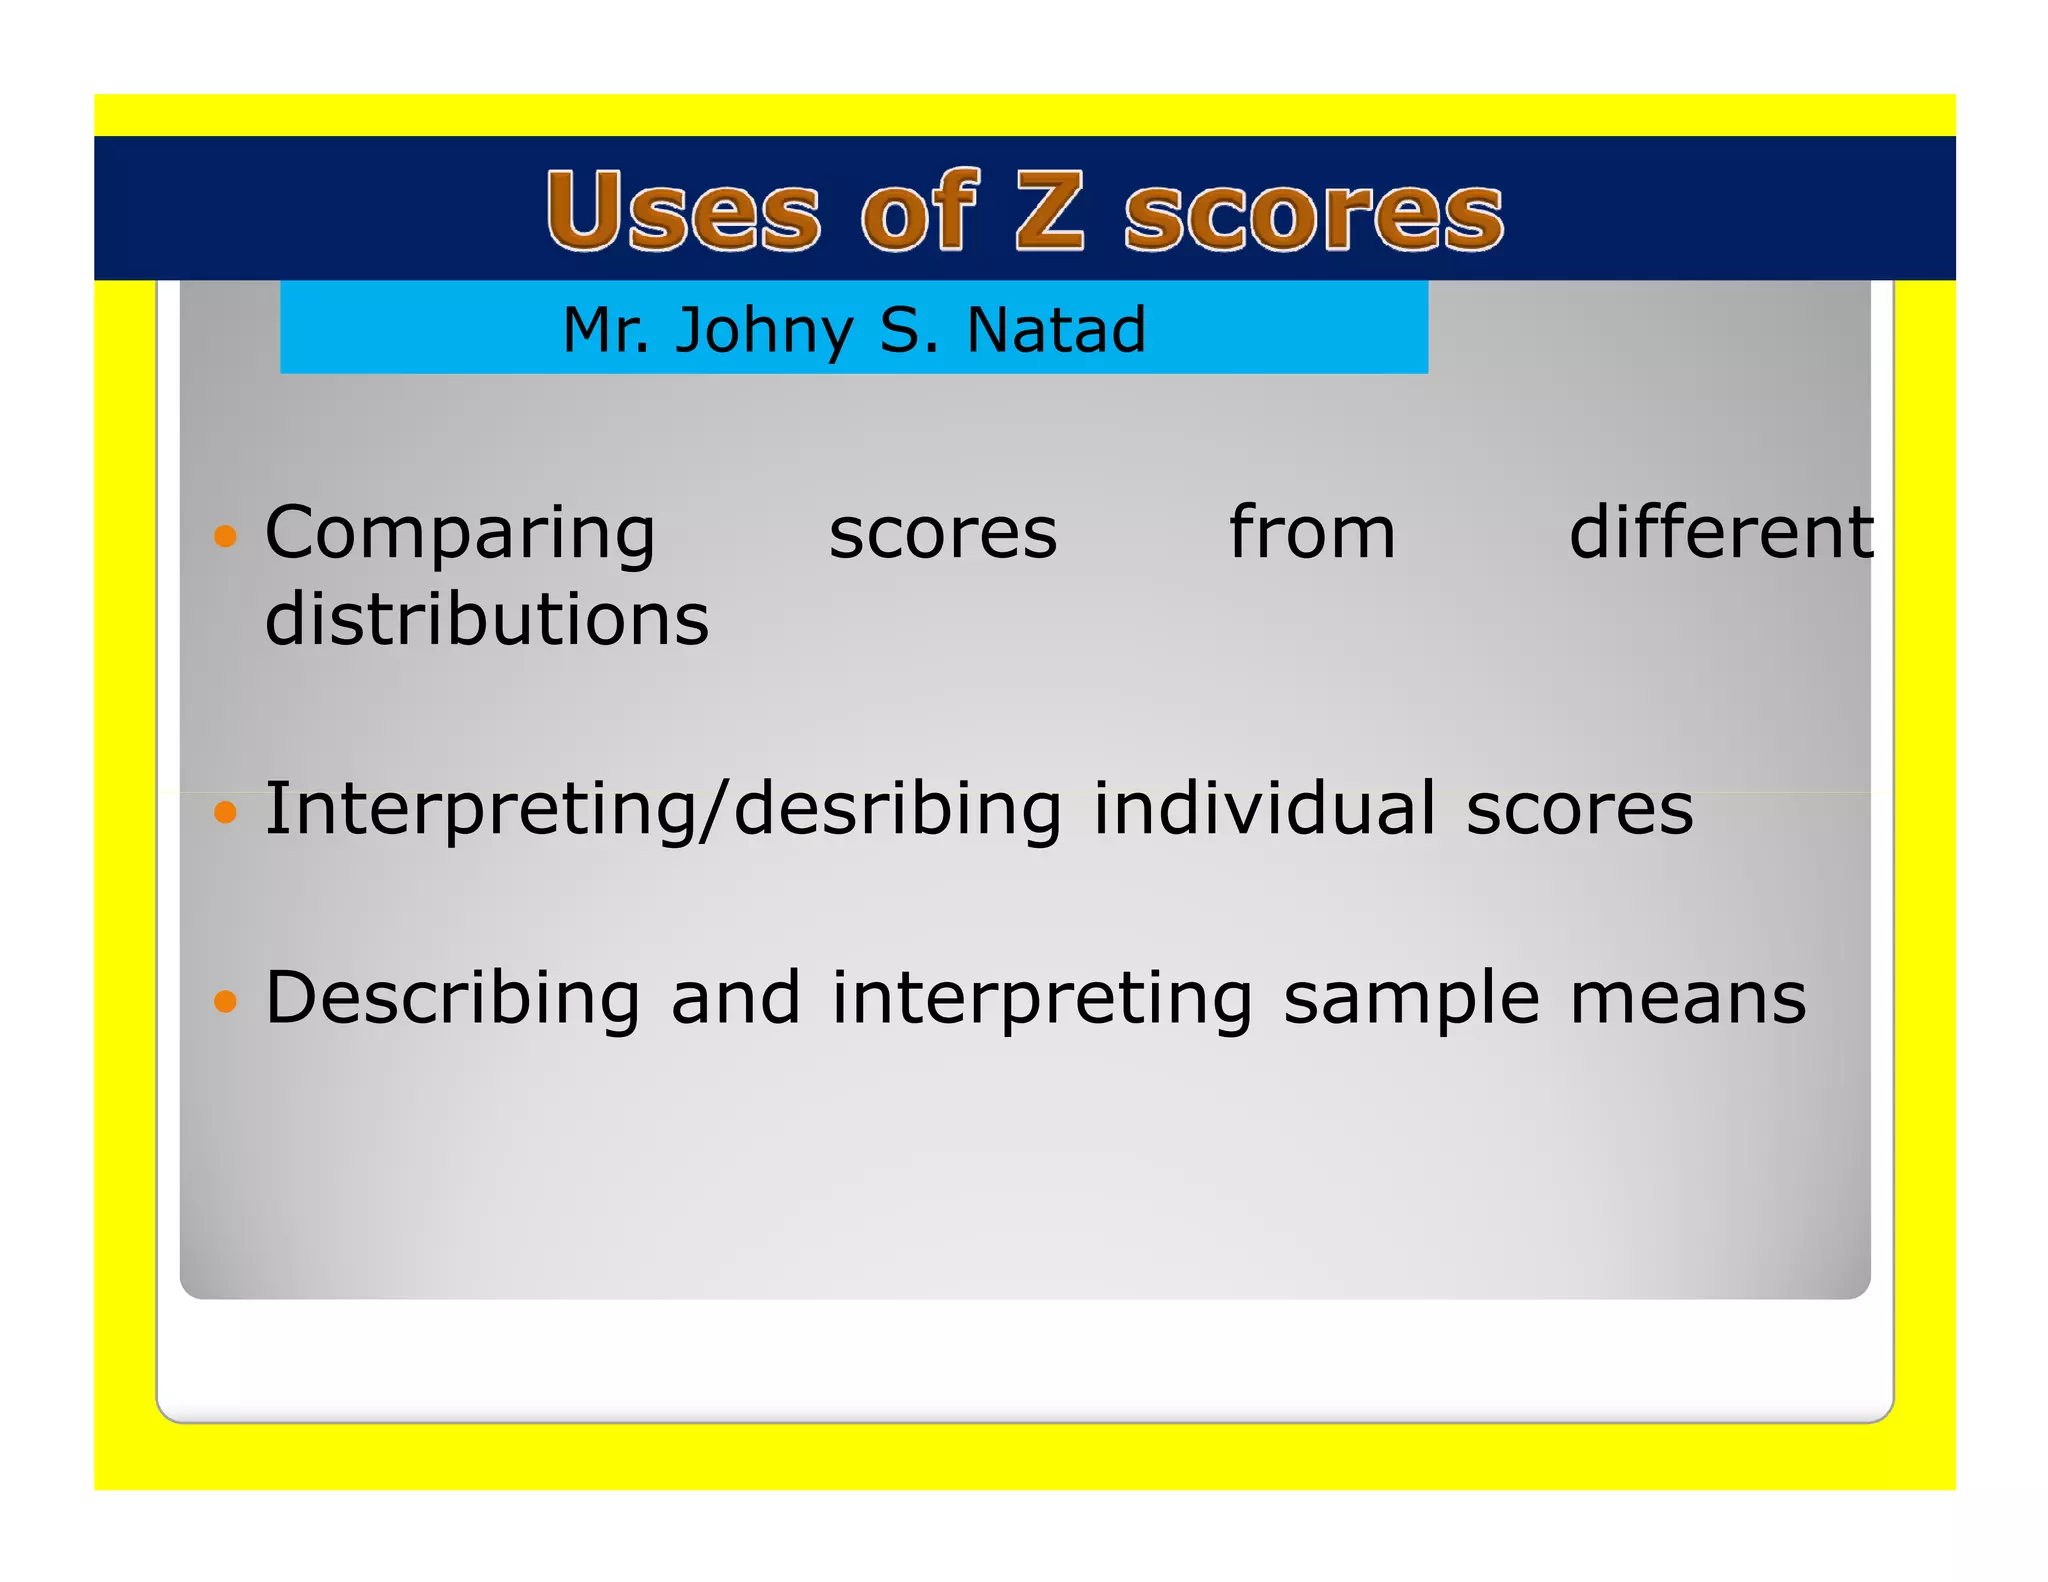
Mr. Johny S.Natad
Comparing scores from different
distributions
Interpreting/desribing individual scores
Describing and interpreting sample means
16.
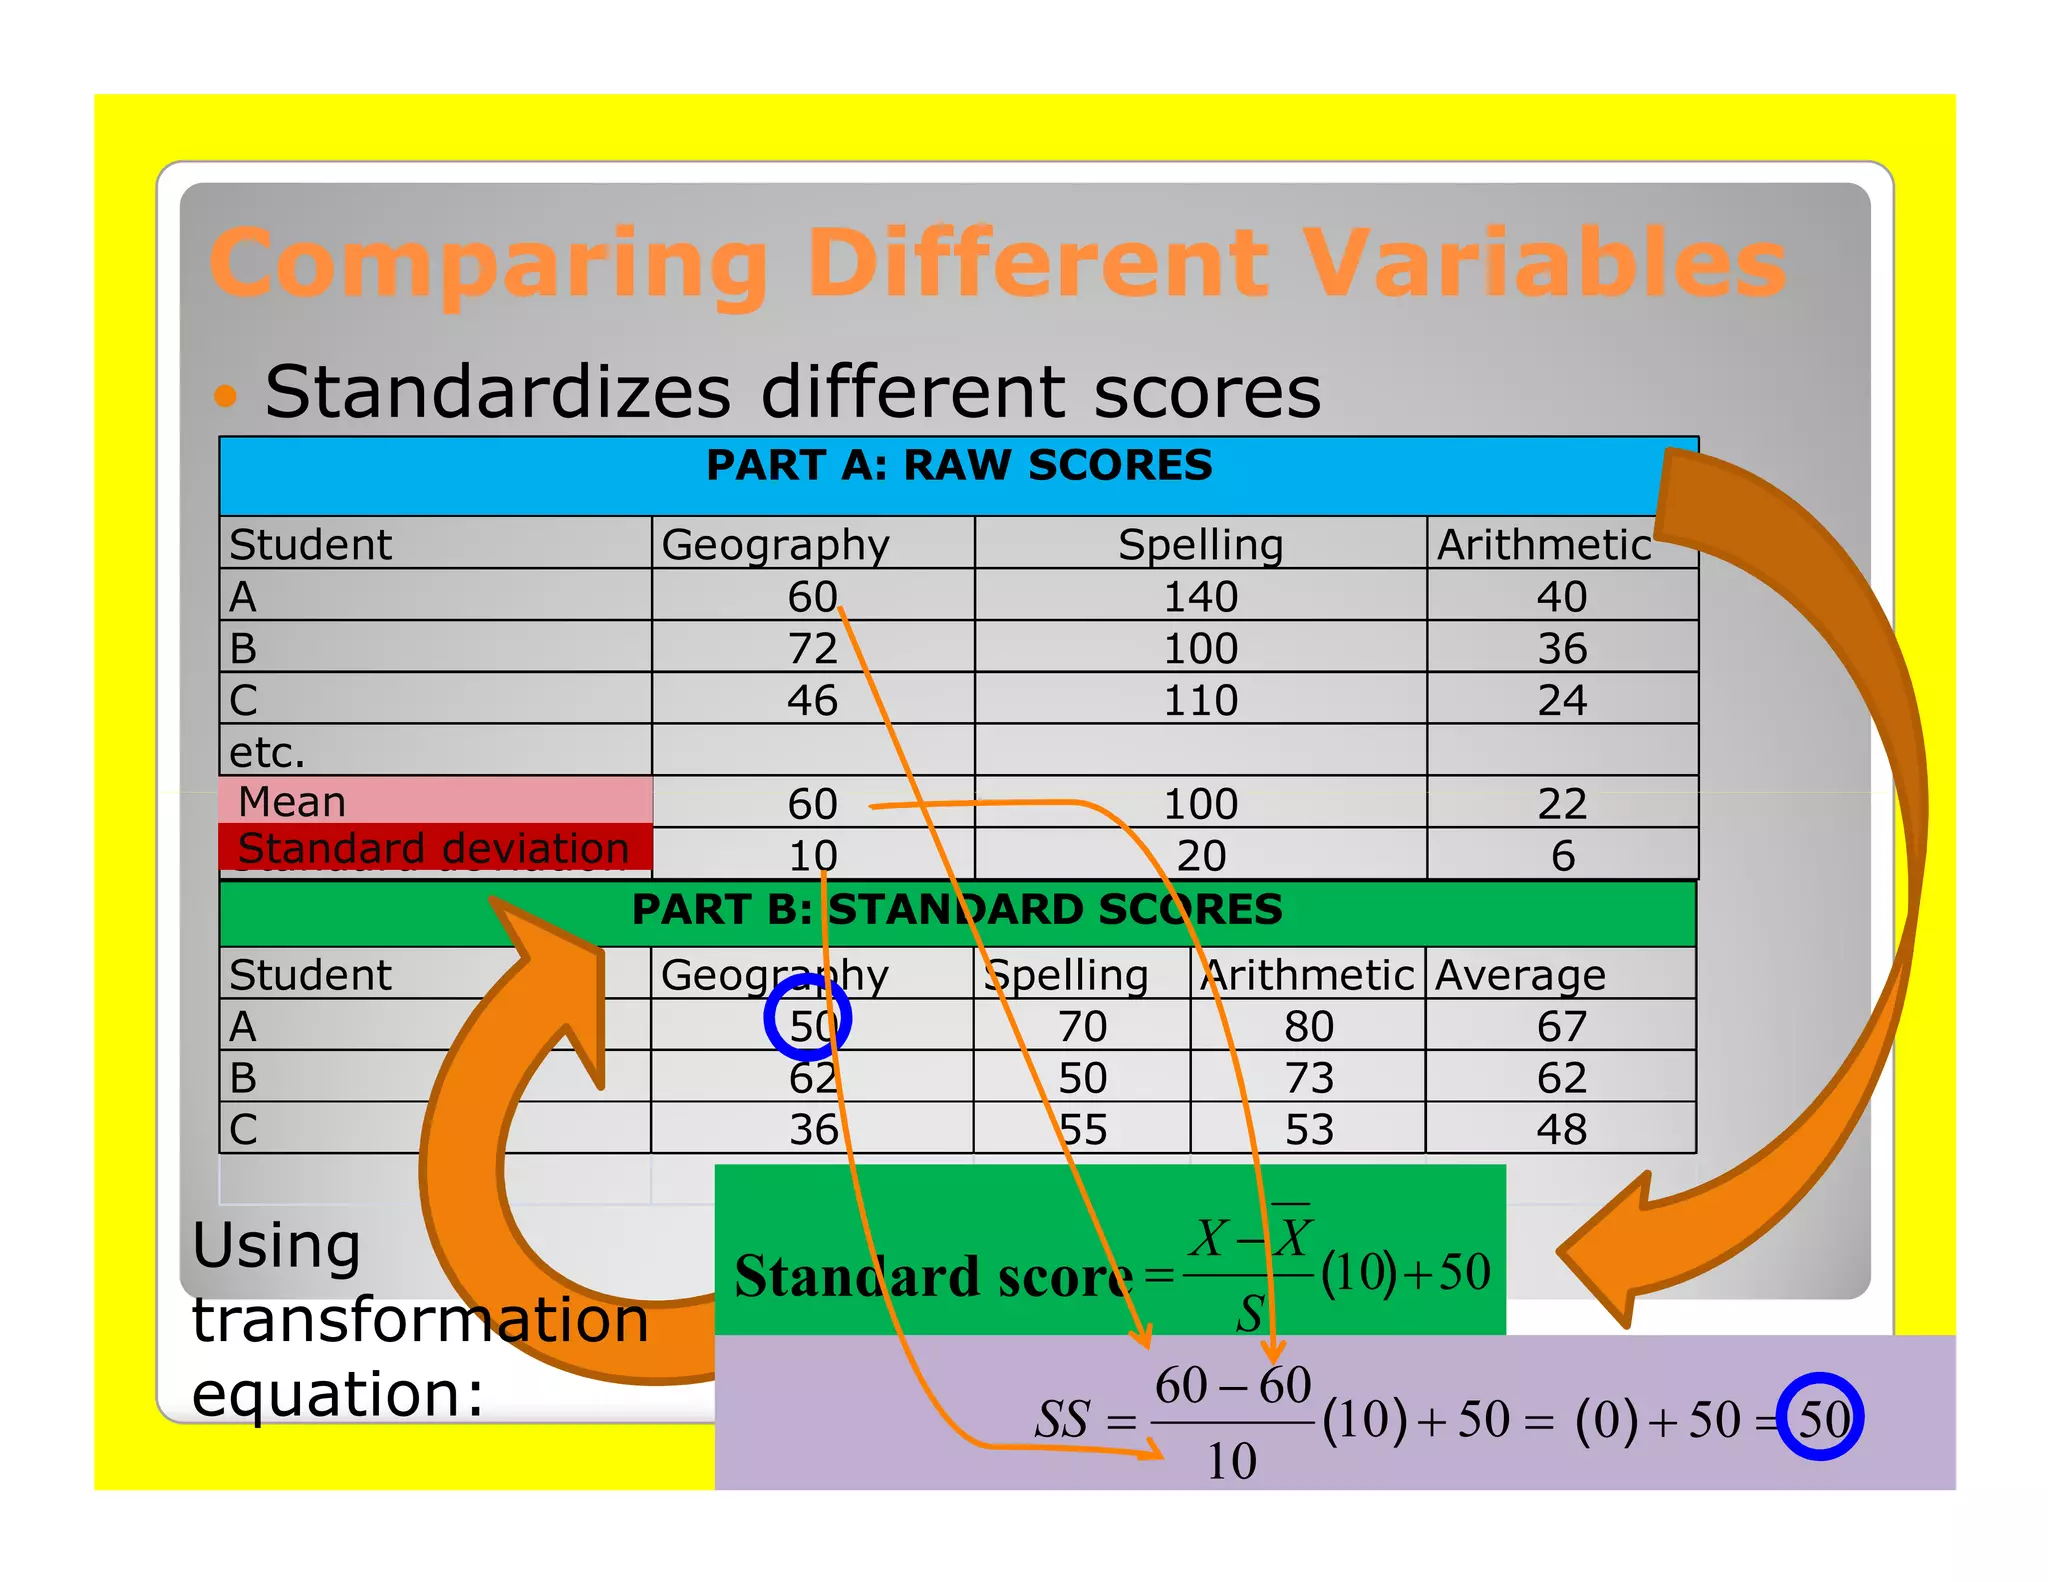
Comparing Different Variables
Standardizes different scores
PART A: RAW SCORES
Student Geography Spelling Arithmetic
A 60 140 40
B 72 100 36
C 46 110 24
etc.
Mean
Mean 60 100 22
Standard deviation
Standard deviation 10 20 6
PART B: STANDARD SCORES
Student Geography Spelling Arithmetic Average
A 50 70 80 67
B 62 50 73 62
C 36 55 53 48
Using X −X
Standard score = (10) + 50
transformation S
equation: 60 − 60
SS = (10) + 50 = (0) + 50 = 50
10
17.
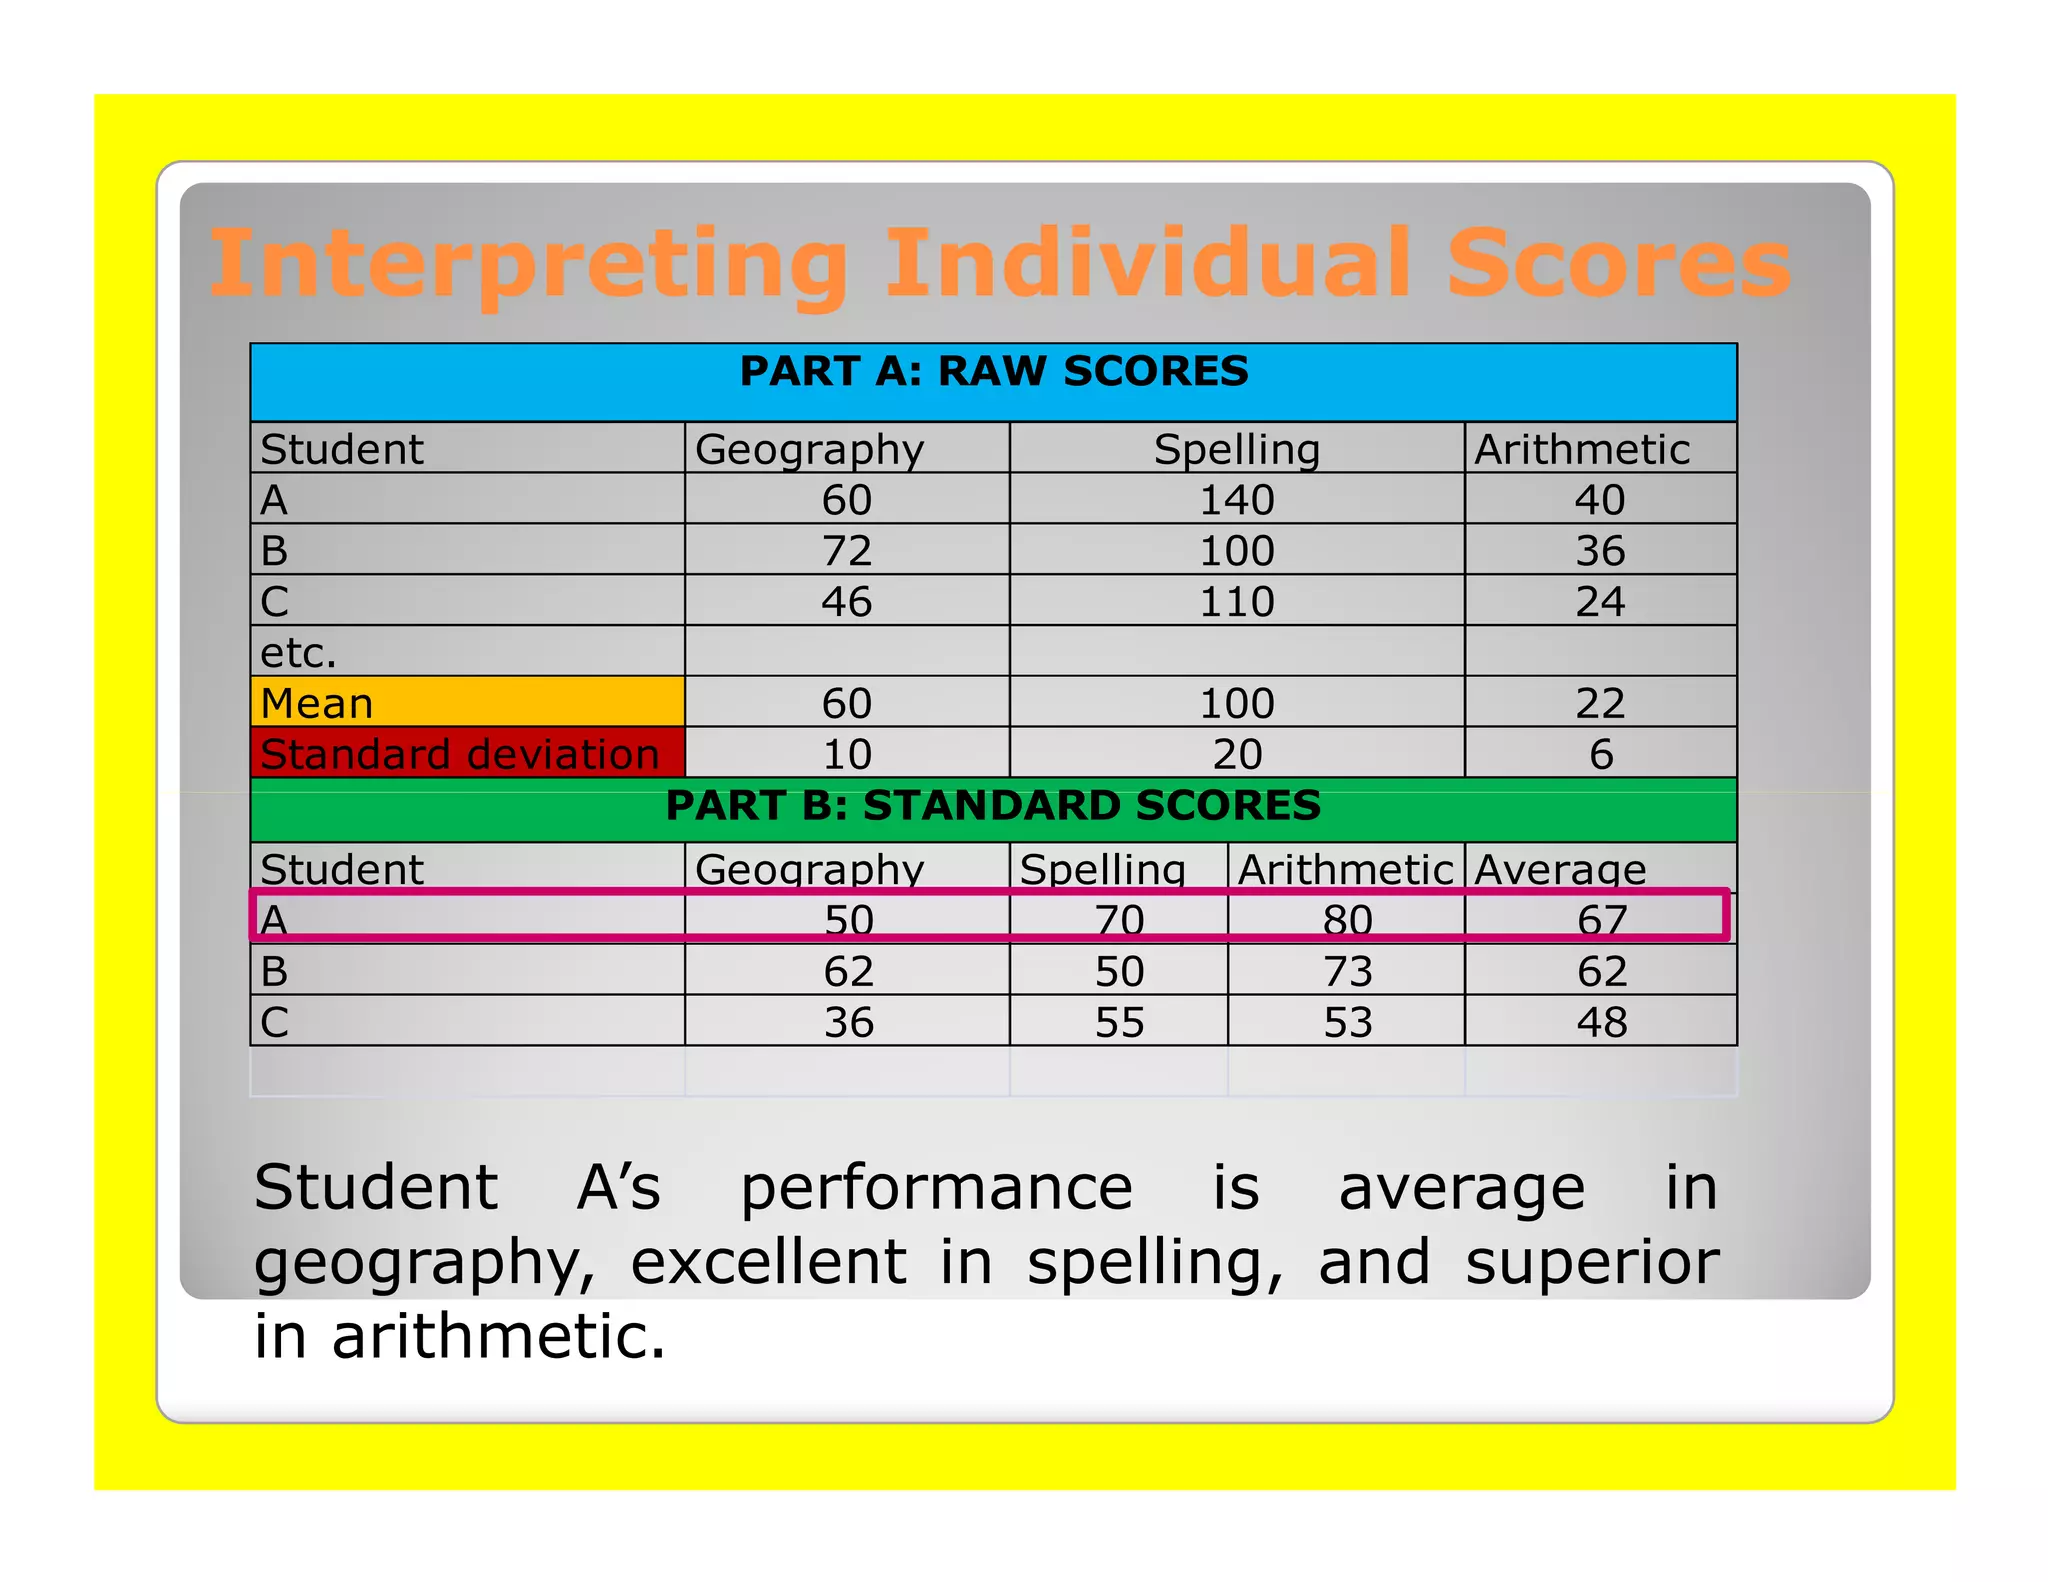
Interpreting Individual Scores
PART A: RAW SCORES
Student Geography Spelling Arithmetic
A 60 140 40
B 72 100 36
C 46 110 24
etc.
Mean 60 100 22
Standard deviation 10 20 6
PART B: STANDARD SCORES
Student Geography Spelling Arithmetic Average
A 50 70 80 67
B 62 50 73 62
C 36 55 53 48
Student A’s performance is average in
geography, excellent in spelling, and superior
in arithmetic.
18.
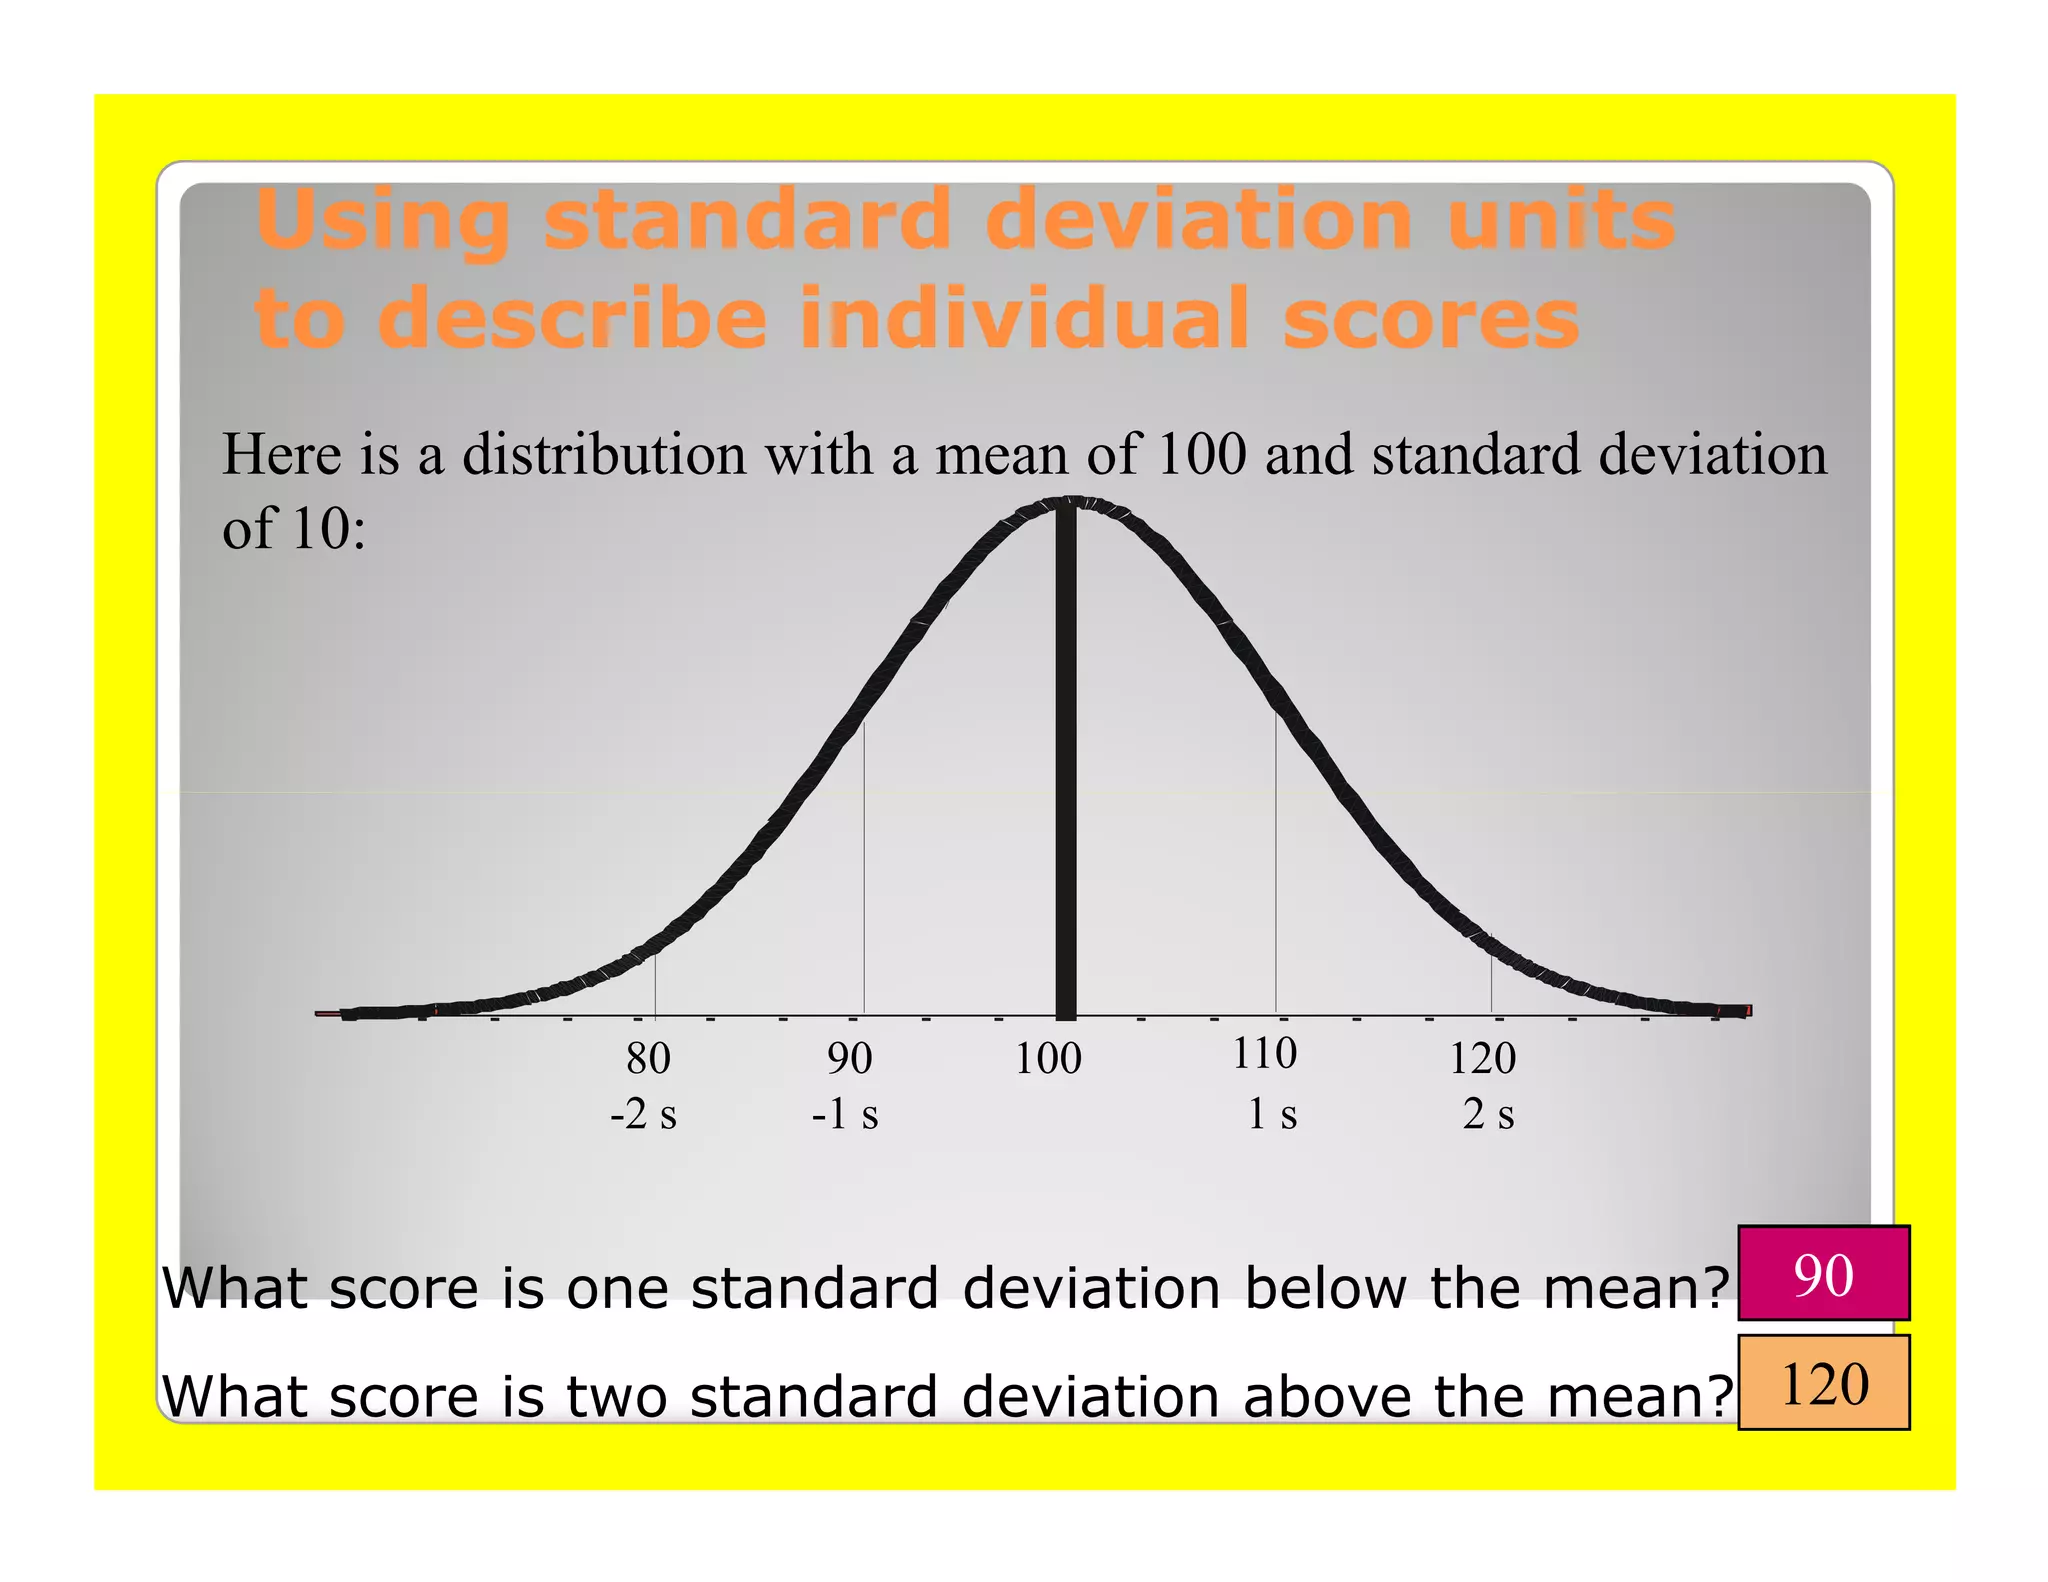
Using standard deviationunits
to describe individual scores
Here is a distribution with a mean of 100 and standard deviation
of 10:
80 90 100 110 120
-2 s -1 s 1s 2s
What score is one standard deviation below the mean? 90
What score is two standard deviation above the mean? 120
19.
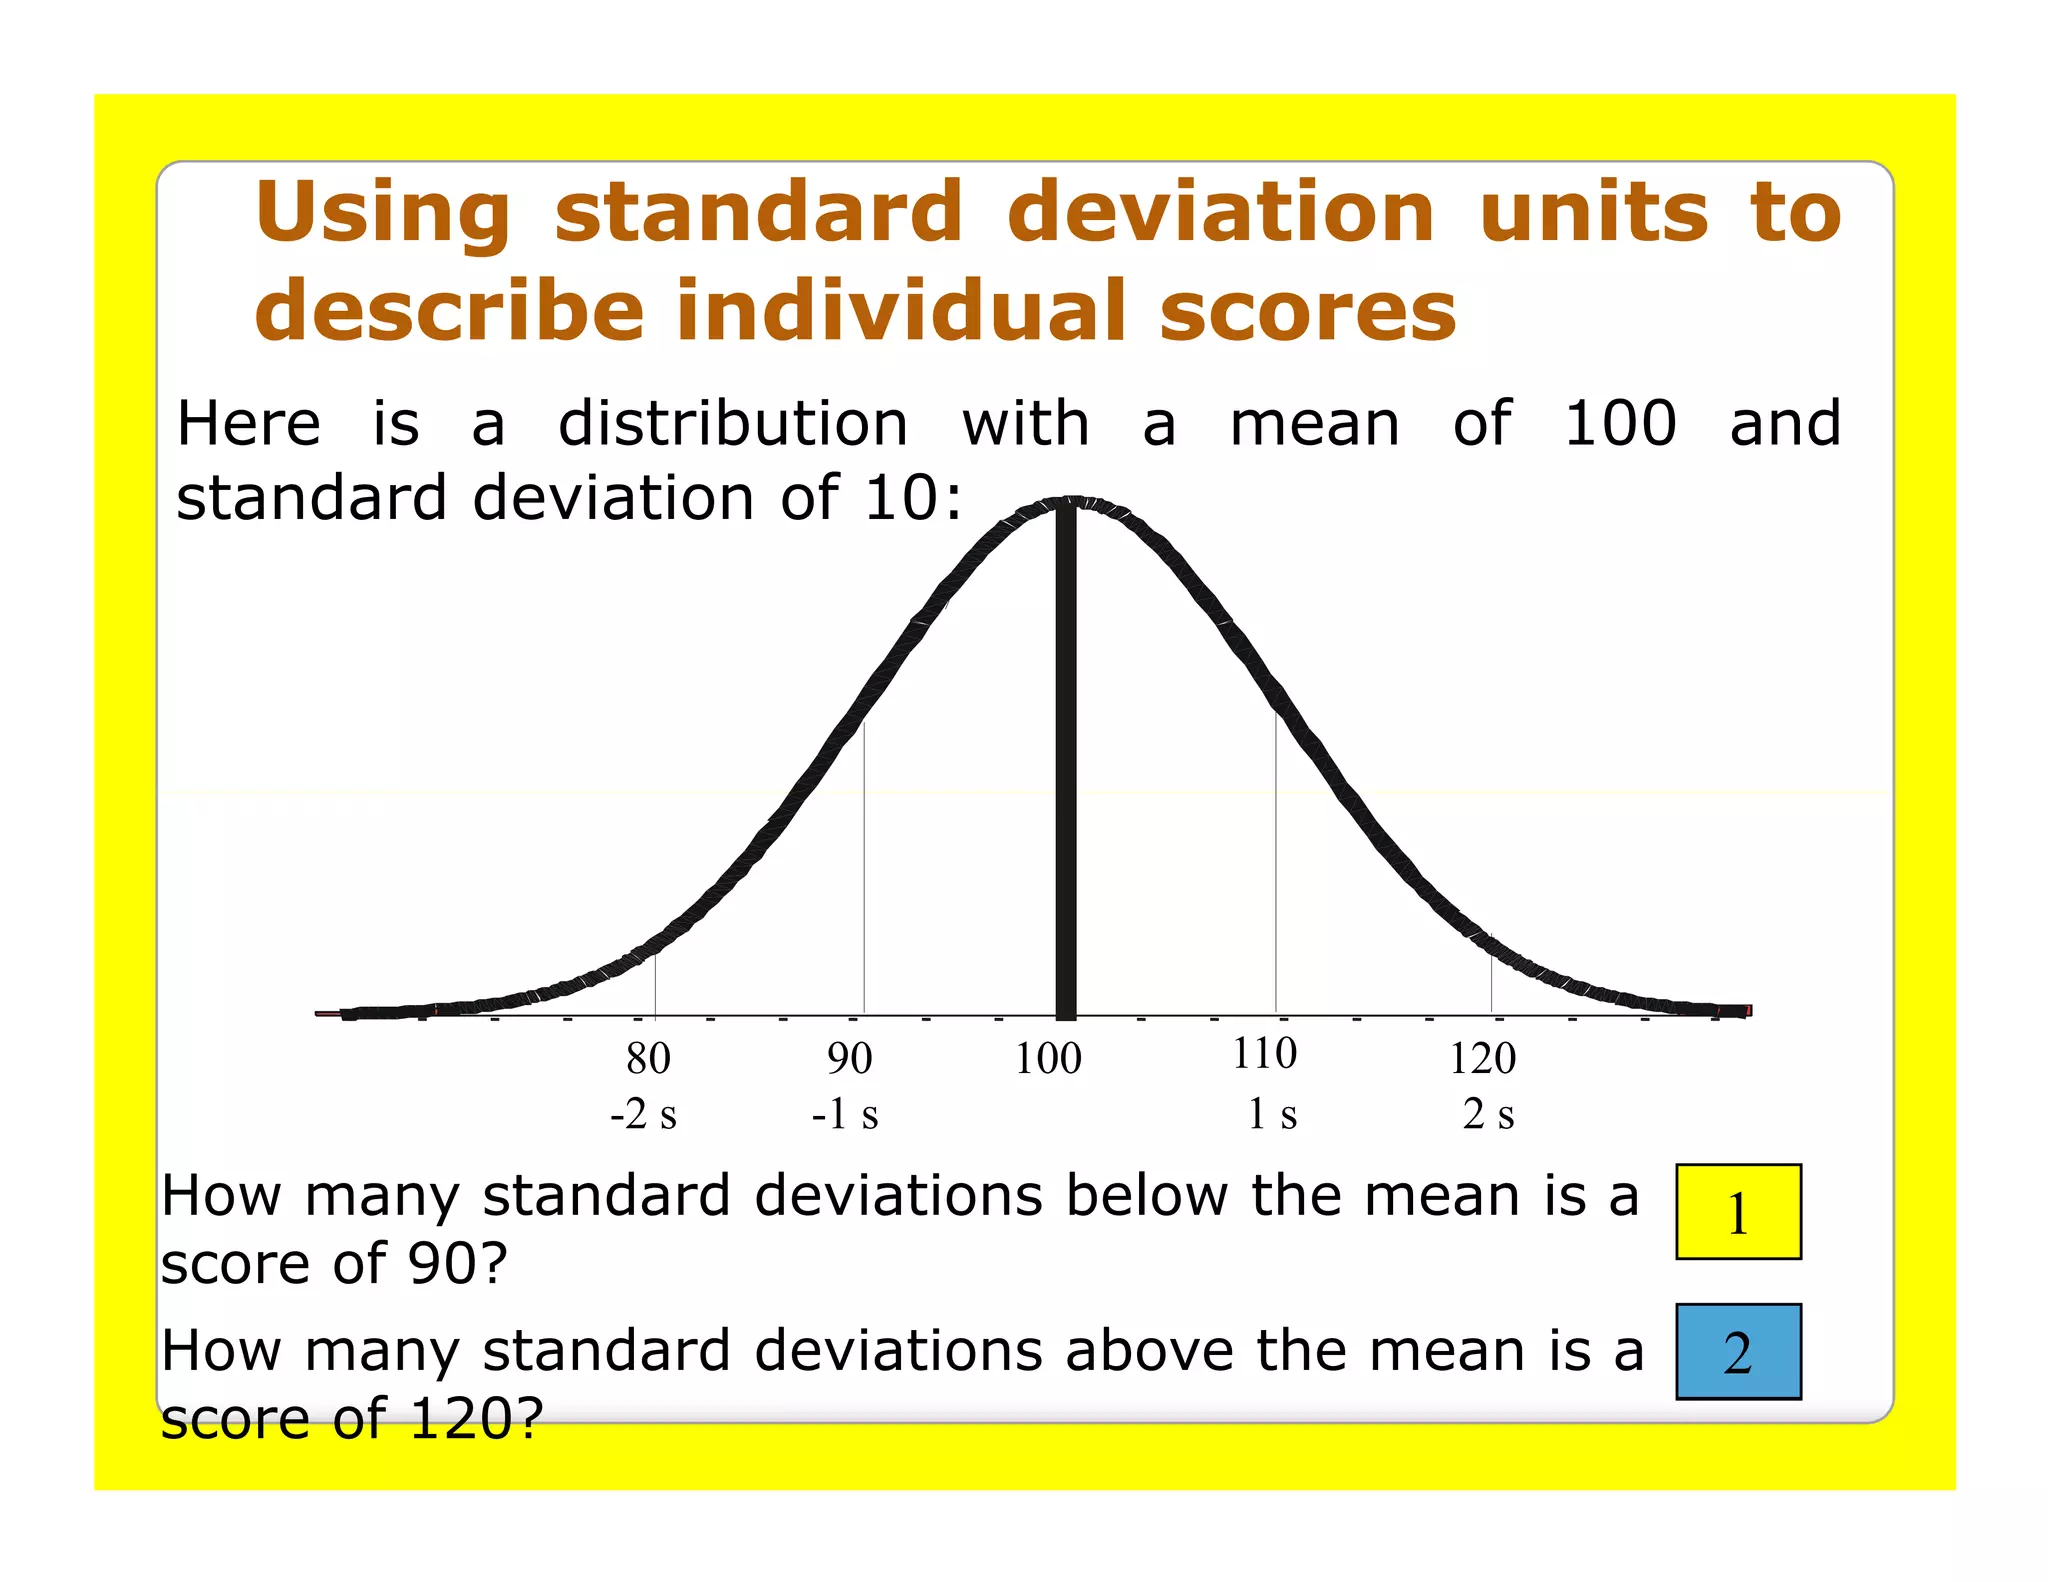
Using standard deviationunits to
describe individual scores
Here is a distribution with a mean of 100 and
standard deviation of 10:
80 90 100 110 120
-2 s -1 s 1s 2s
How many standard deviations below the mean is a 1
score of 90?
How many standard deviations above the mean is a 2
score of 120?
20.
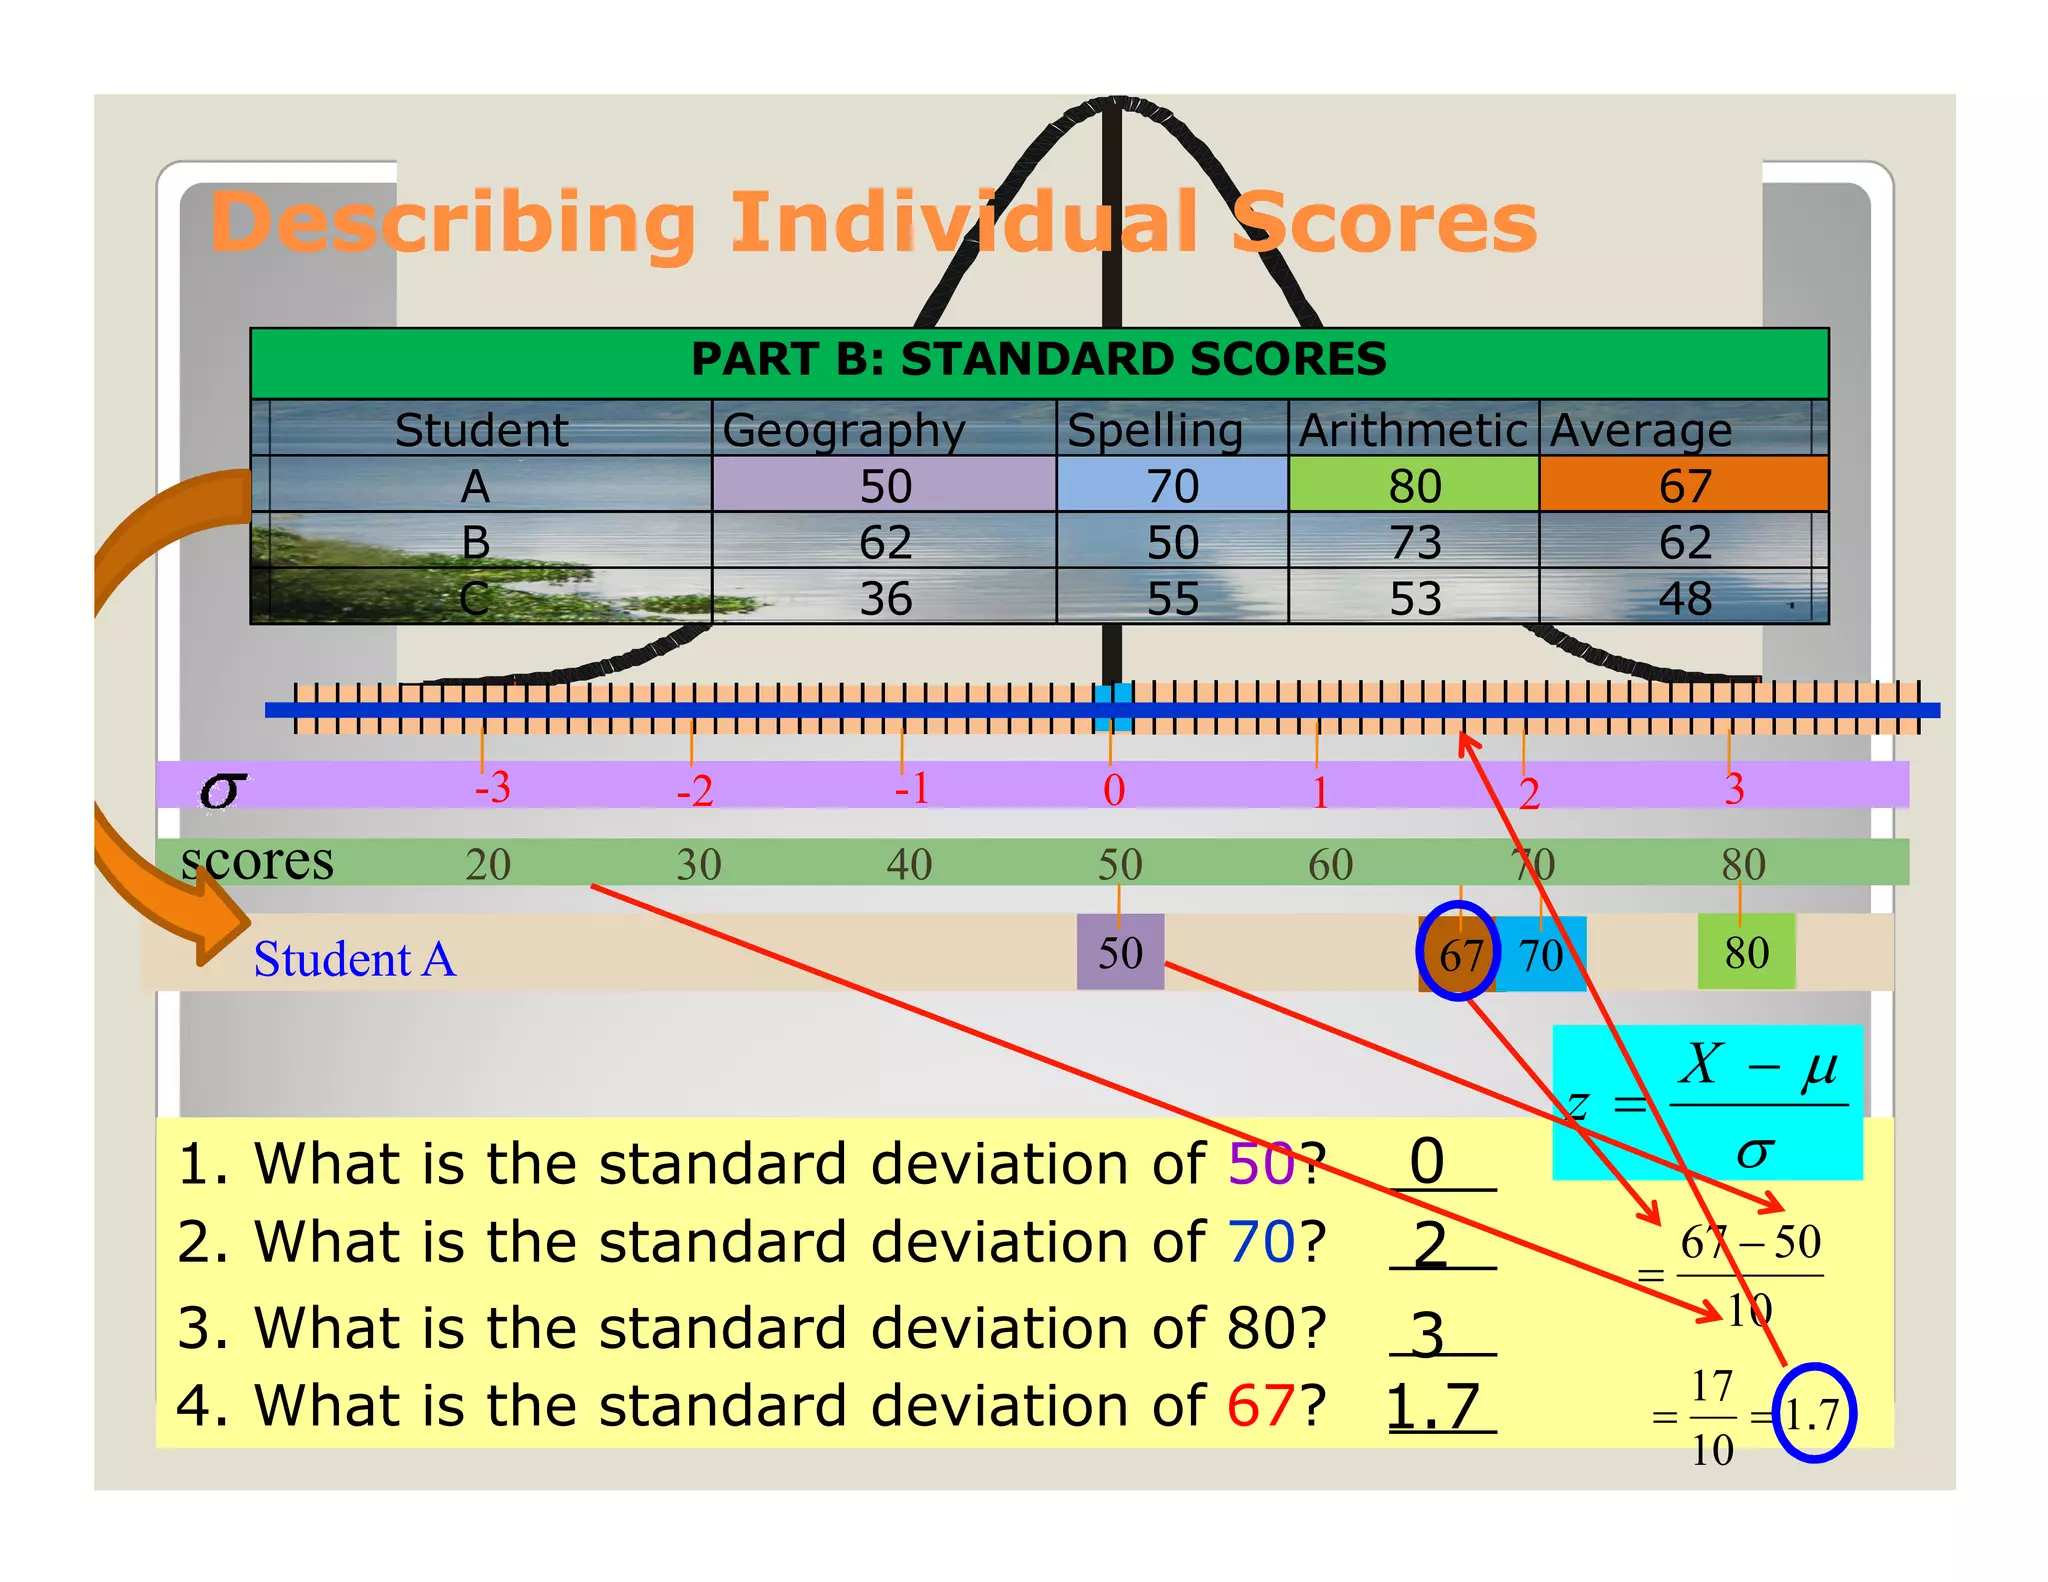
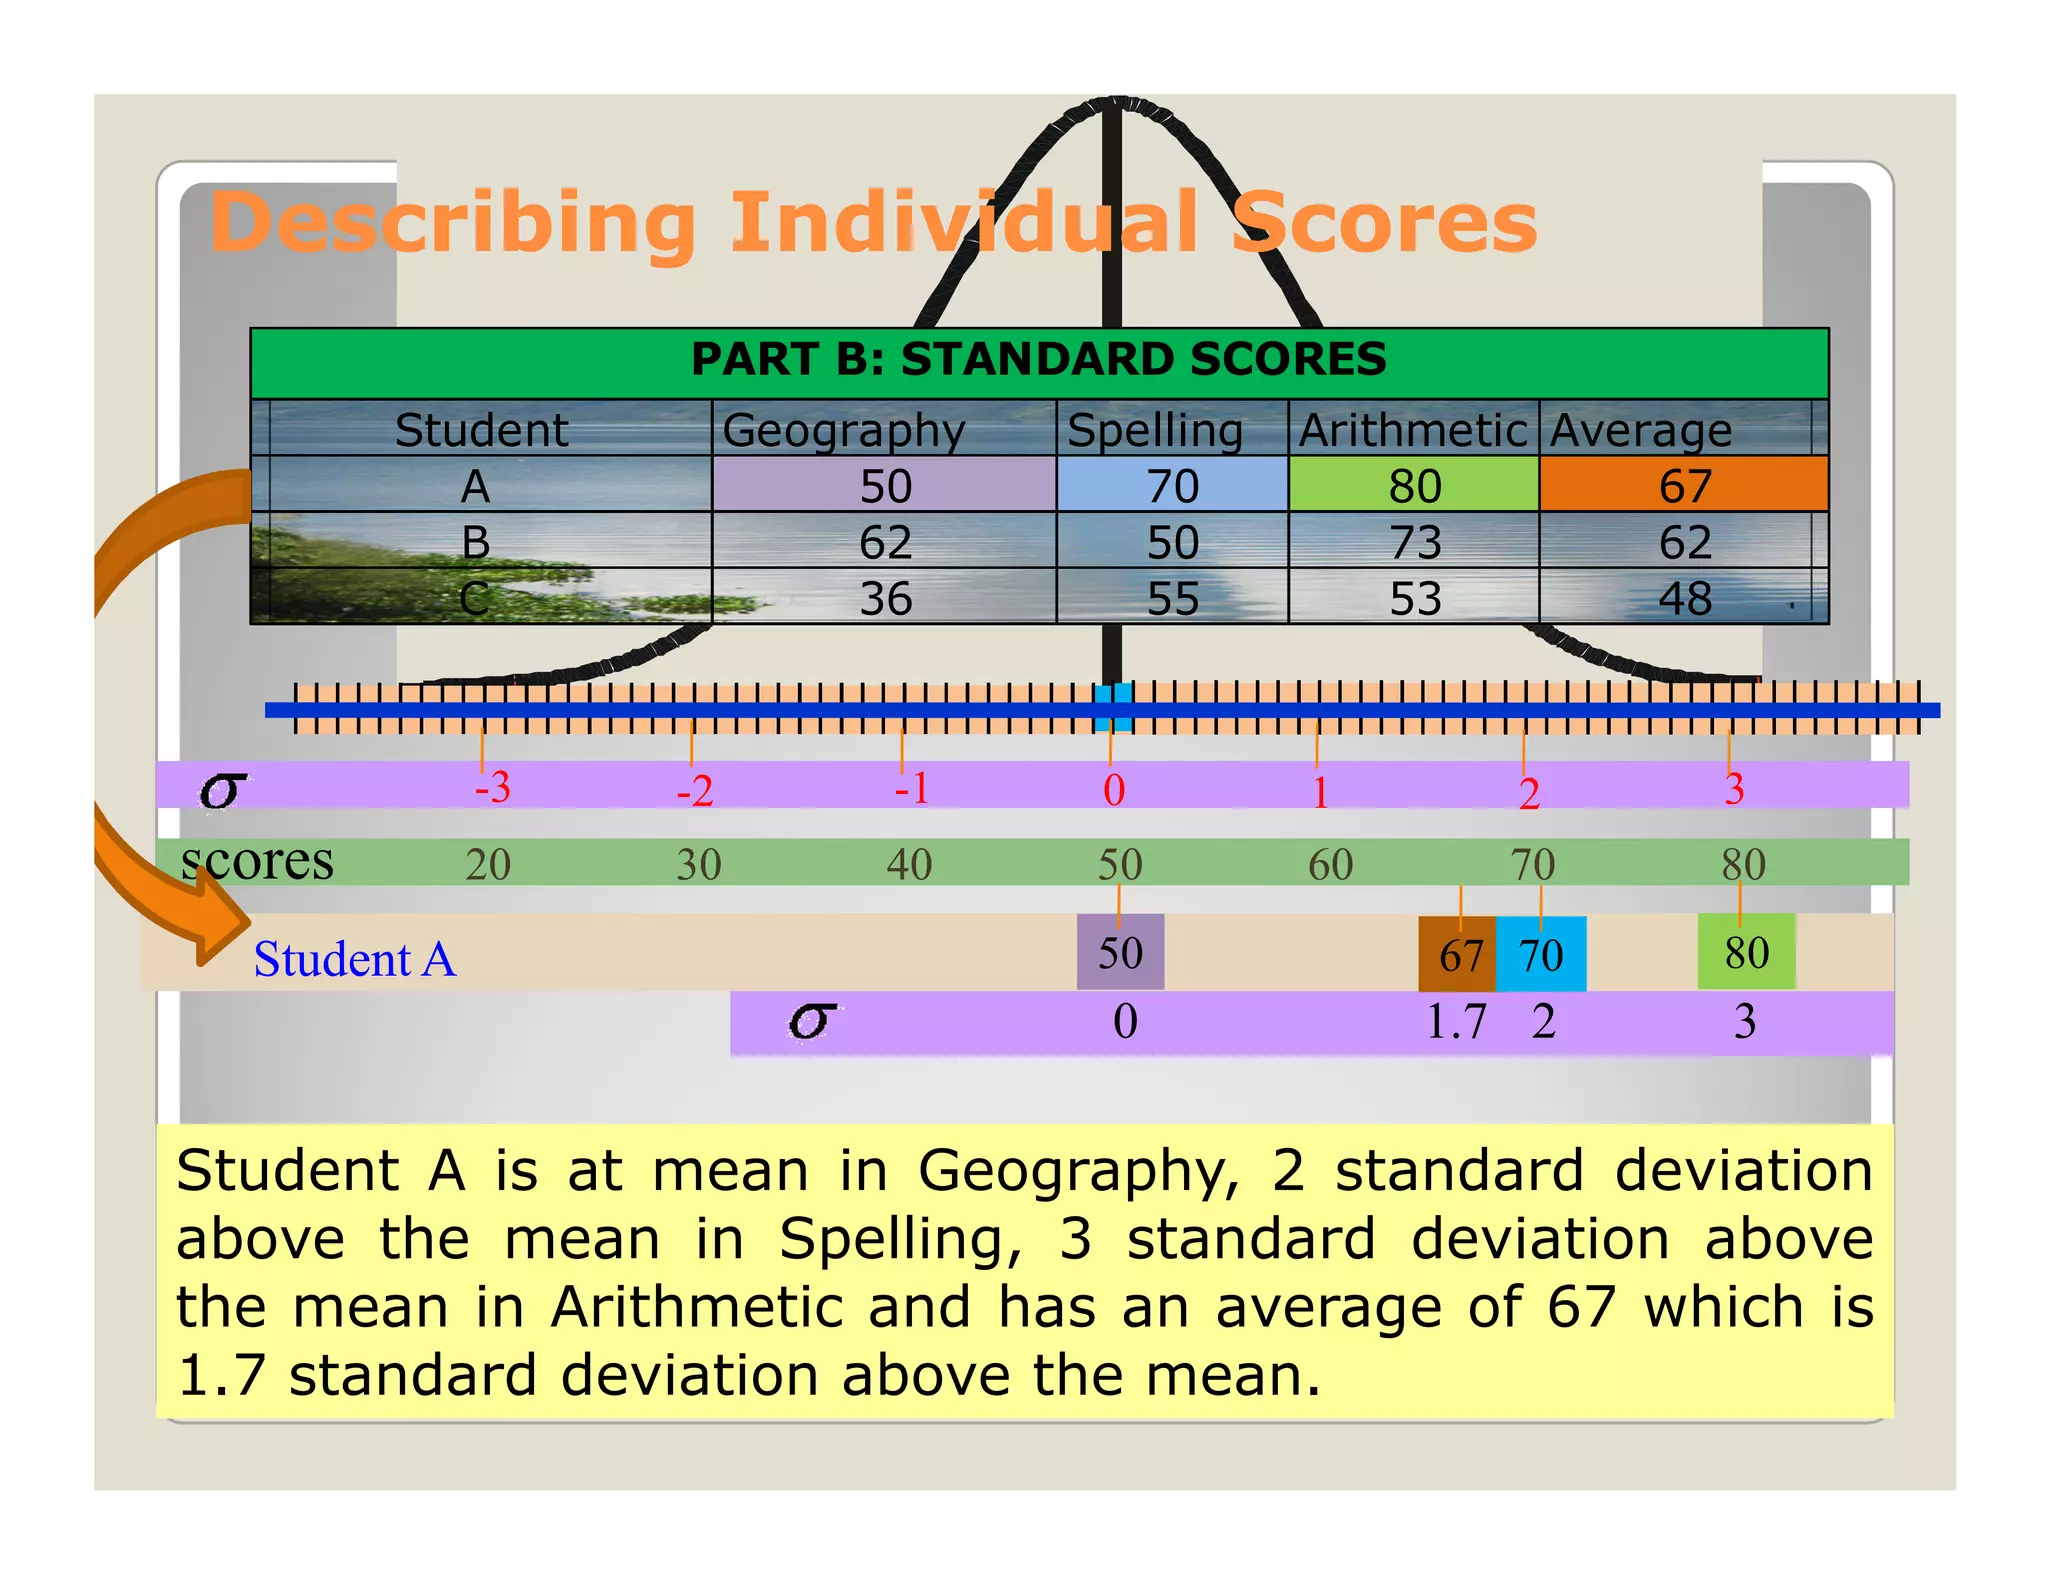
Describing Individual Scores
PART B: STANDARD SCORES
Student Geography Spelling Arithmetic Average
A 50 70 80 67
B 62 50 73 62
C 36 55 53 48
-3 -2 -1 0 1 2 3
scores 20 30 40 50 60 70 80
Student A 50 67 70 80
X −µ
z =
1. What is the standard deviation of 50? 0
___ σ
2. What is the standard deviation of 70? ___
2 =
67 − 50
3. What is the standard deviation of 80? ___ 10
3
17
4. What is the standard deviation of 67? 1.7
___ = = 1 .7
10
21.
Describing Individual Scores
PART B: STANDARD SCORES
Student Geography Spelling Arithmetic Average
A 50 70 80 67
B 62 50 73 62
C 36 55 53 48
-3 -2 -1 0 1 2 3
scores 20 30 40 50 60 70 80
Student A 50 67 70 80
0 1.7 2 3
Student A is at mean in Geography, 2 standard deviation
above the mean in Spelling, 3 standard deviation above
the mean in Arithmetic and has an average of 67 which is
1.7 standard deviation above the mean.
22.
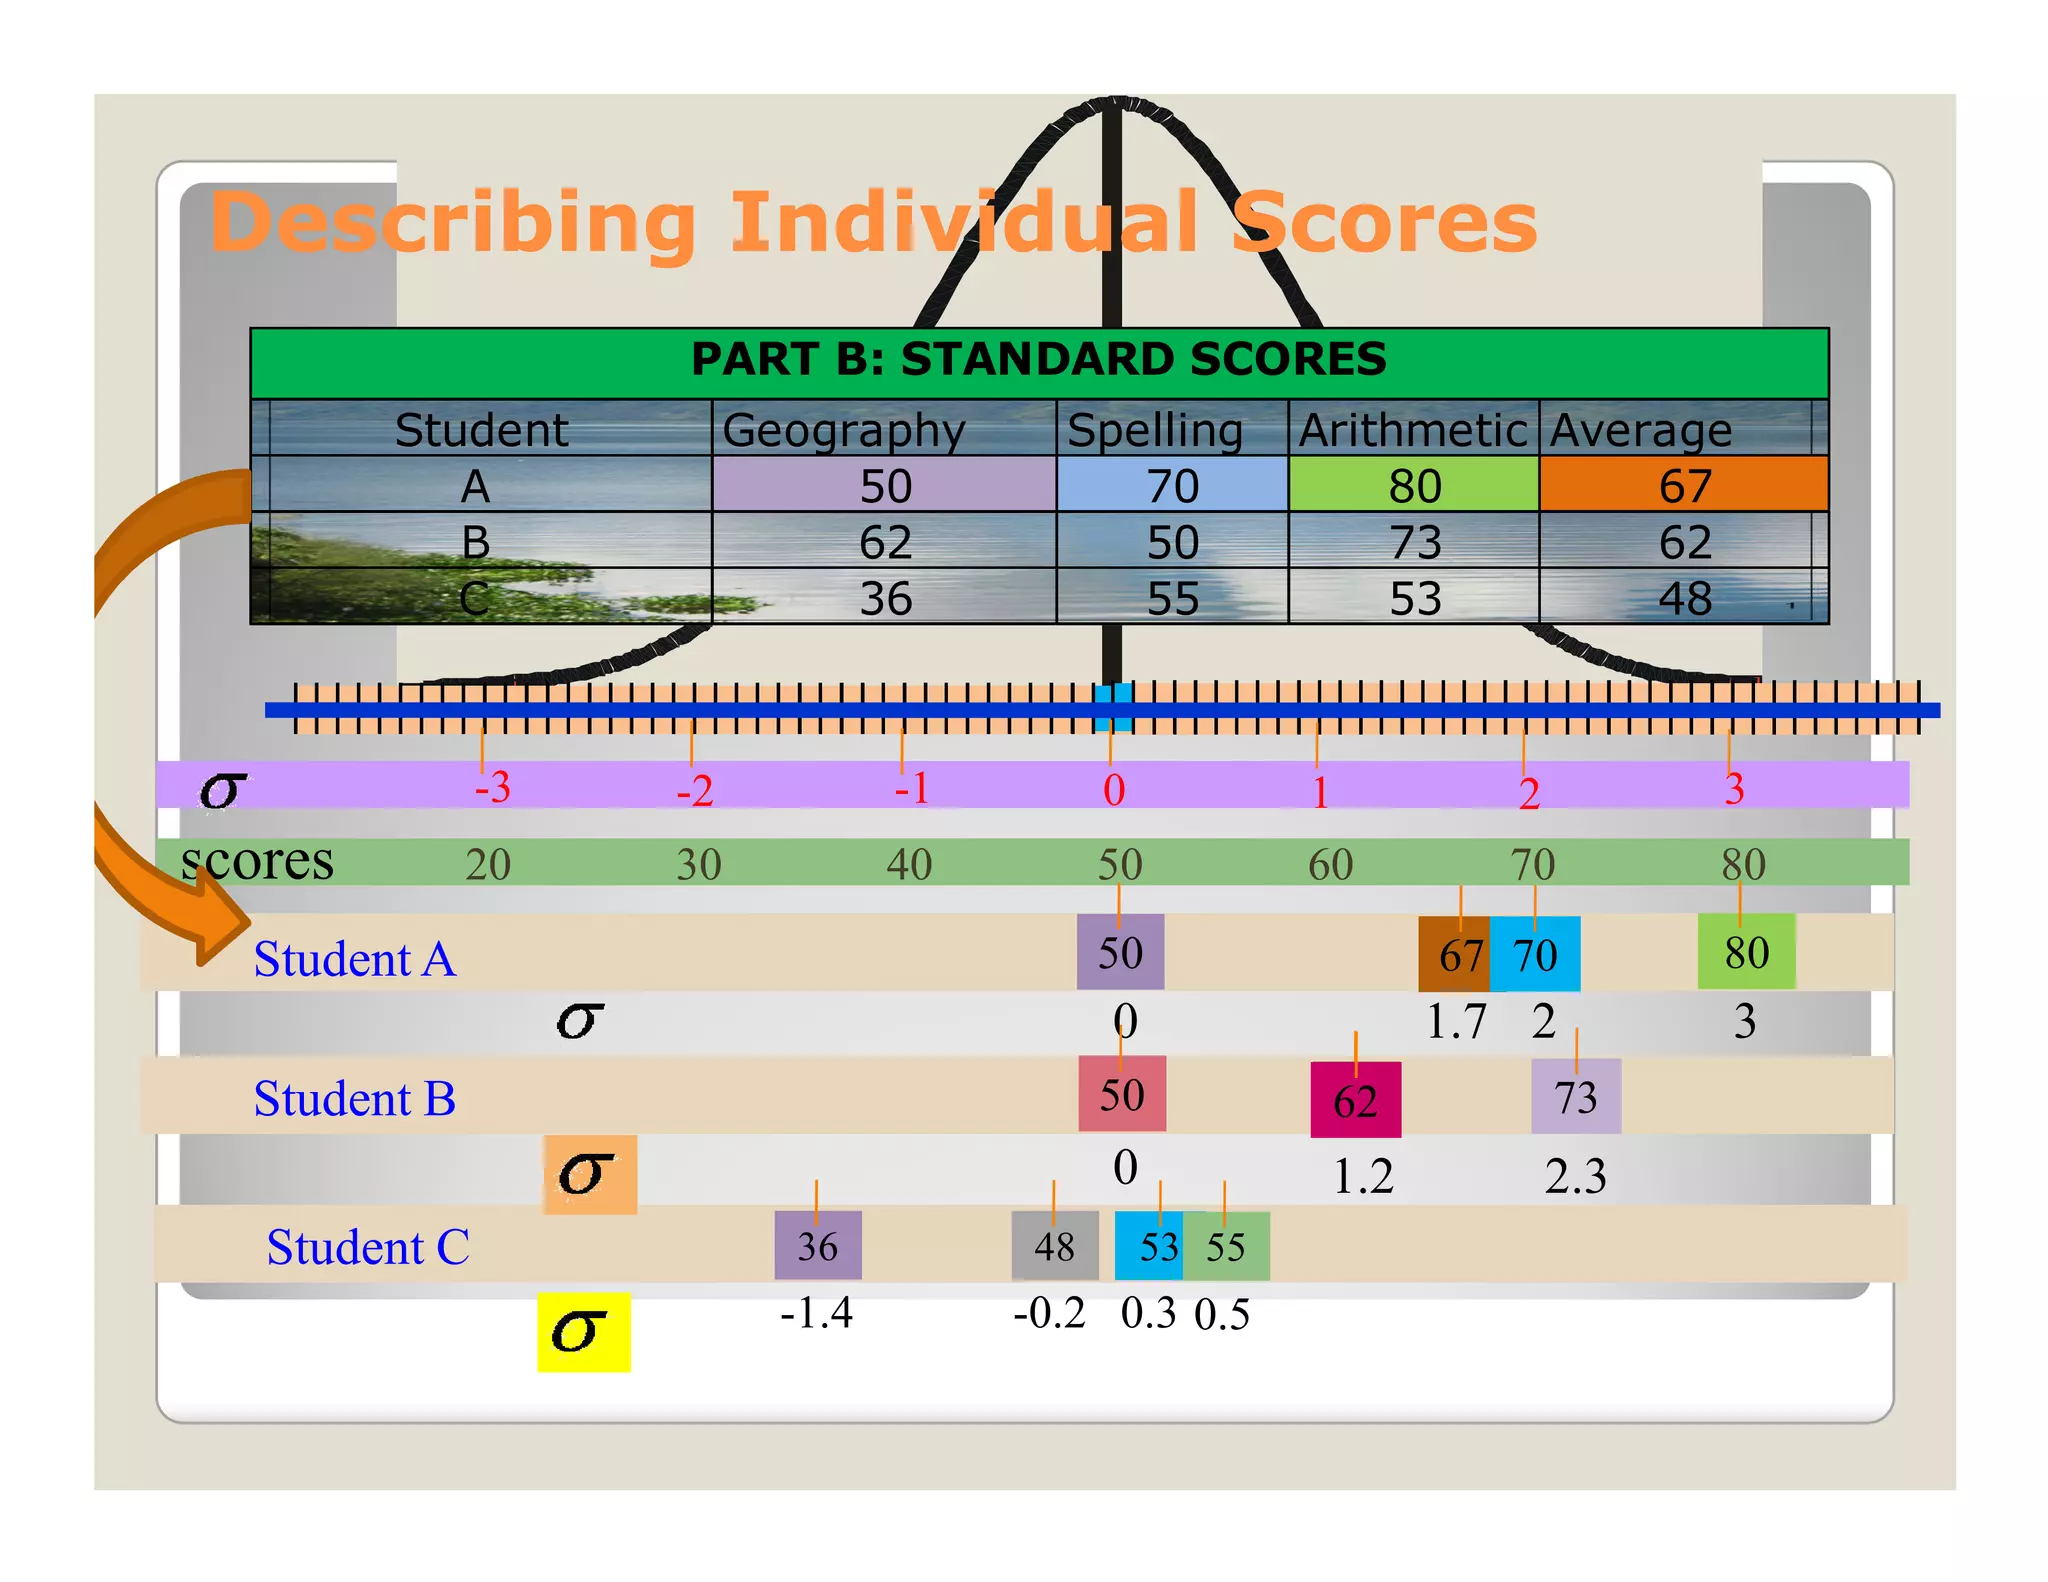
Describing Individual Scores
PART B: STANDARD SCORES
Student Geography Spelling Arithmetic Average
A 50 70 80 67
B 62 50 73 62
C 36 55 53 48
-3 -2 -1 0 1 2 3
scores 20 30 40 50 60 70 80
Student A 50 67 70 80
0 1.7 2 3
Student B 50 62 73
0 1.2 2.3
Student C 36 48 53 55
-1.4 -0.2 0.3 0.5
23.
Using the z-Table
z-
Important when dealing with decimal z-
scores
Gives information about the area between
the mean and the z and the area beyond z
in the tail
Use z-scores to define psychological
attributes
24.
Using z-scores toDescribe Sample
z-
Means
Useful for evaluating the sample and for inferential
statistical procedures
Evaluate the sample mean’s relative standing
Sampling distribution of means could be created
by plotting all possible means with that sample
size and is always approximately a normal
distribution
Sometimes the mean will be higher, sometimes
lower
The mean of the sampling distribution always
equals the mean of the underlying raw scores of
the population
25.
Ms. Araya I.Mejorada
Random variation conforms to a
particular probability distribution known
as the normal distribution, which is
the most commonly observed
probability distribution.
Mathematicians de Moivre
and Laplace used this
distribution in the 1700's
de Moivre
26.
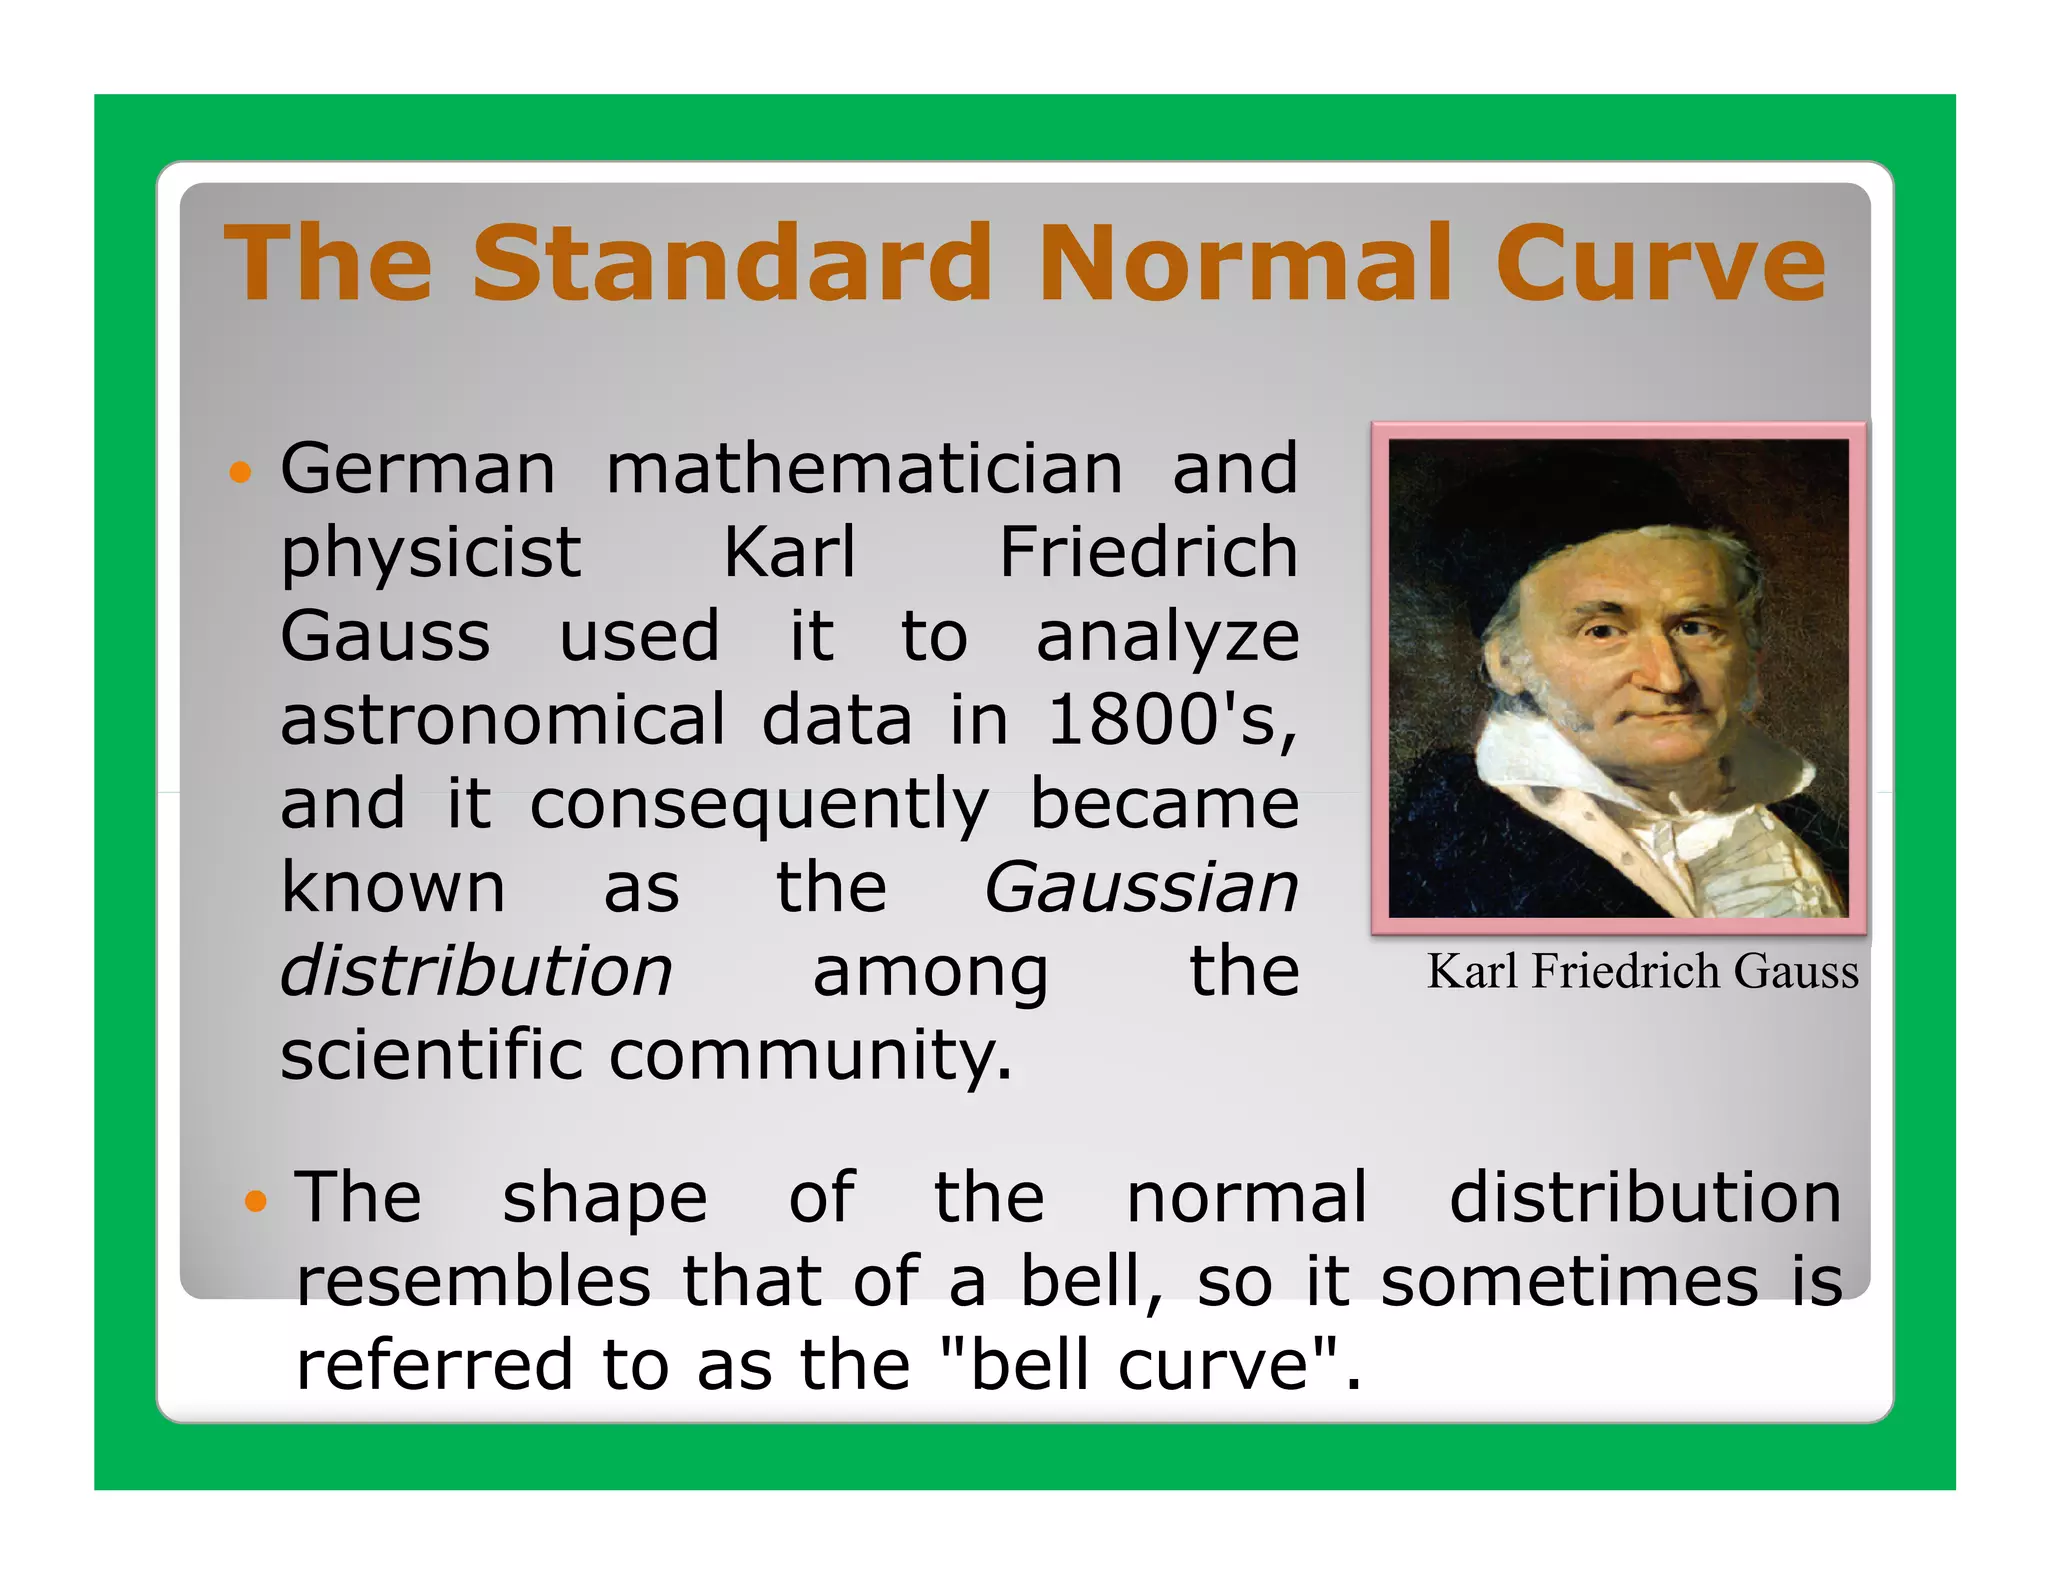
The Standard NormalCurve
German mathematician and
physicist Karl Friedrich
Gauss used it to analyze
astronomical data in 1800's,
and it consequently became
known as the Gaussian
distribution among the Karl Friedrich Gauss
scientific community.
The shape of the normal distribution
resembles that of a bell, so it sometimes is
referred to as the "bell curve".
27.
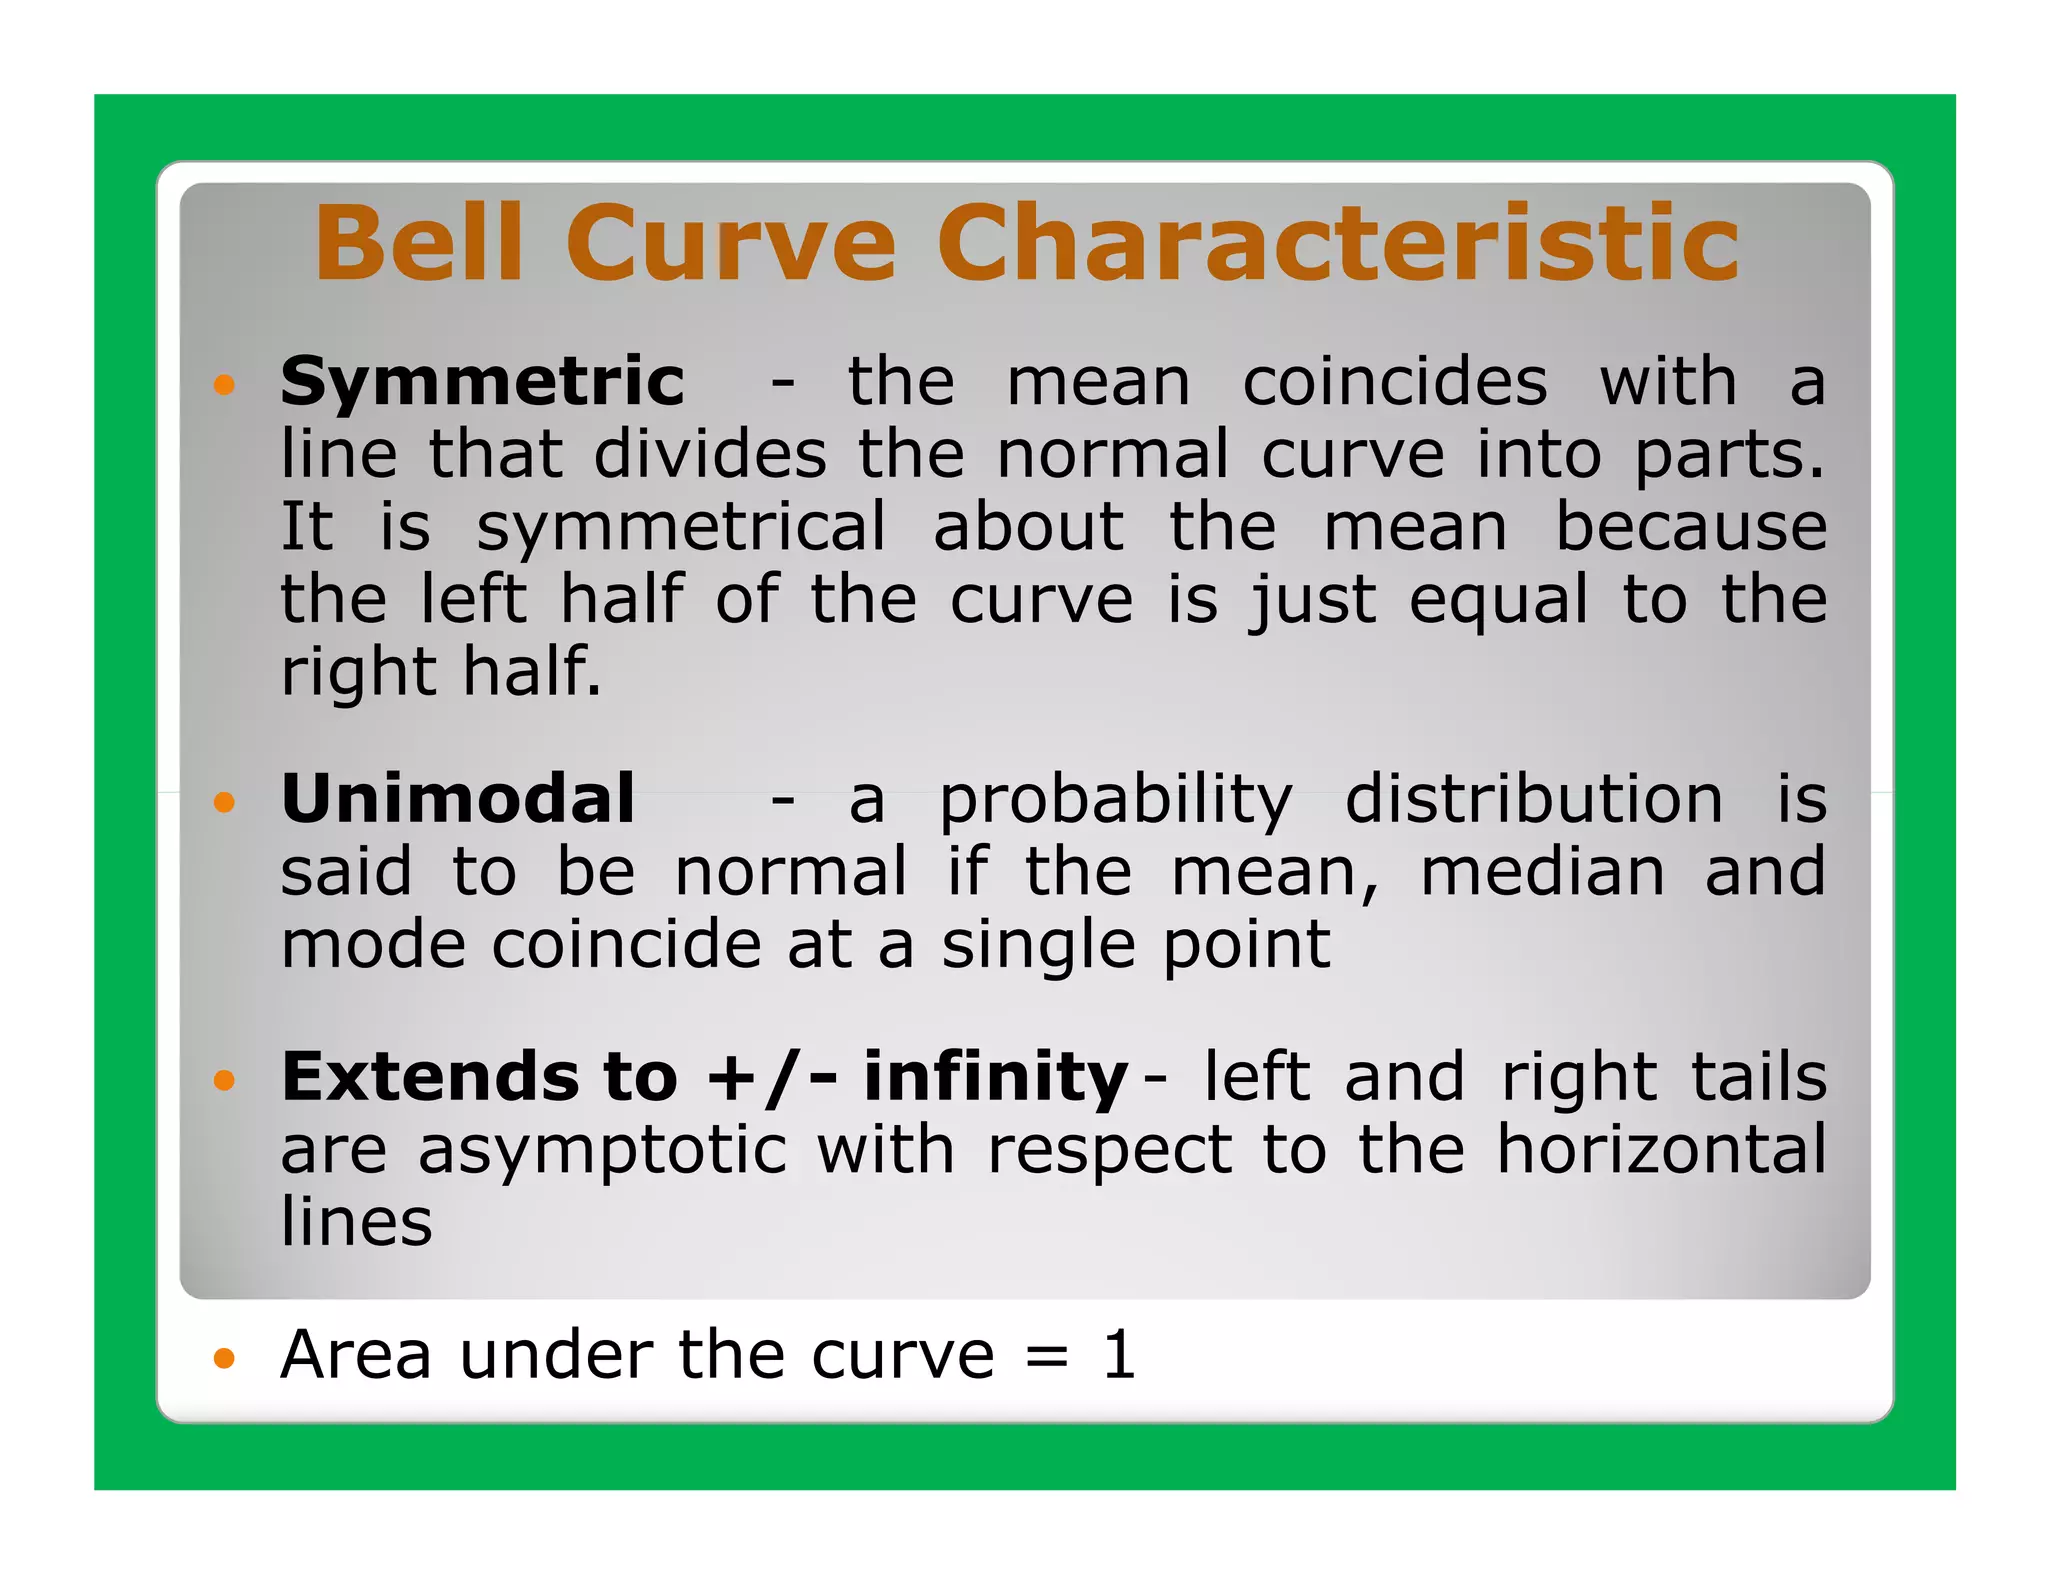
Bell Curve Characteristic
Symmetric- the mean coincides with a
line that divides the normal curve into parts.
It is symmetrical about the mean because
the left half of the curve is just equal to the
right half.
Unimodal - a probability distribution is
said to be normal if the mean, median and
mode coincide at a single point
Extends to +/- infinity - left and right tails
are asymptotic with respect to the horizontal
lines
Area under the curve = 1
28.
Completely Described by Two
Parameters
The normal distribution can be completely
specified by two parameters:
1.mean
2.standard deviation
If the mean and standard deviation are
known, then one essentially knows as
much as if one had access to every point
in the data set.
29.
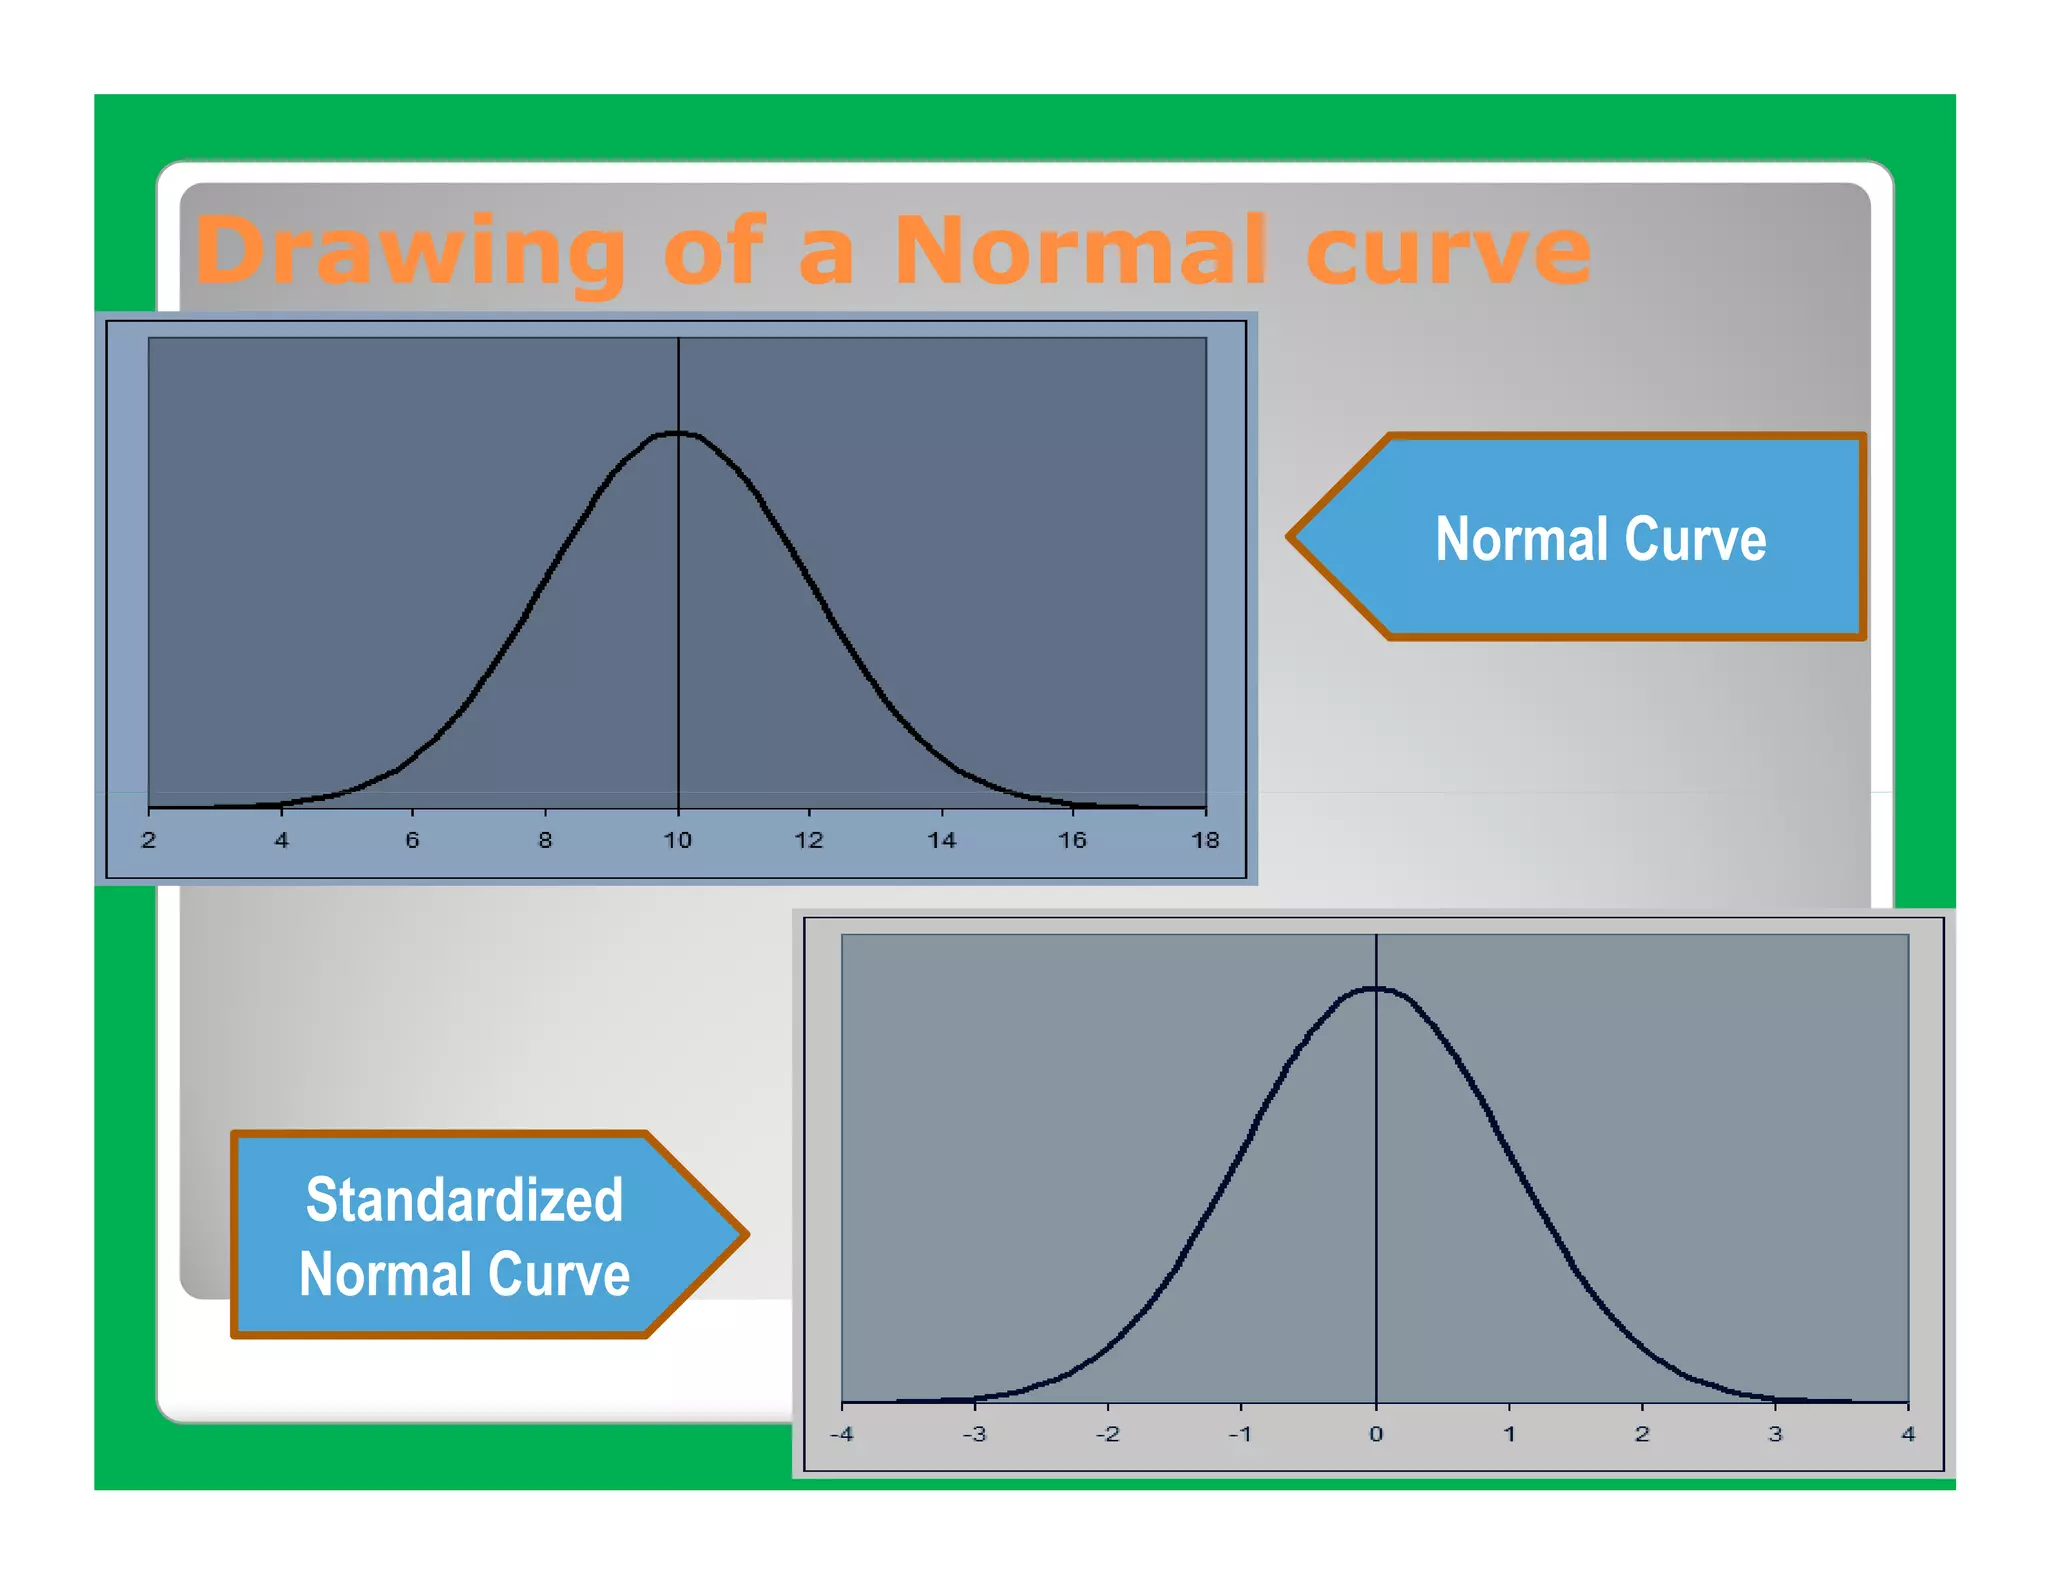
Drawing of aNormal curve
Normal Curve
Standardized
Normal Curve
30.
Areas Under theNormal Curve
.3413 of the curve falls between the mean and one
standard deviation above the mean, which means
that about 34 percent of all the values of a normally
distributed variable are between the mean and one
standard deviation above it
31.
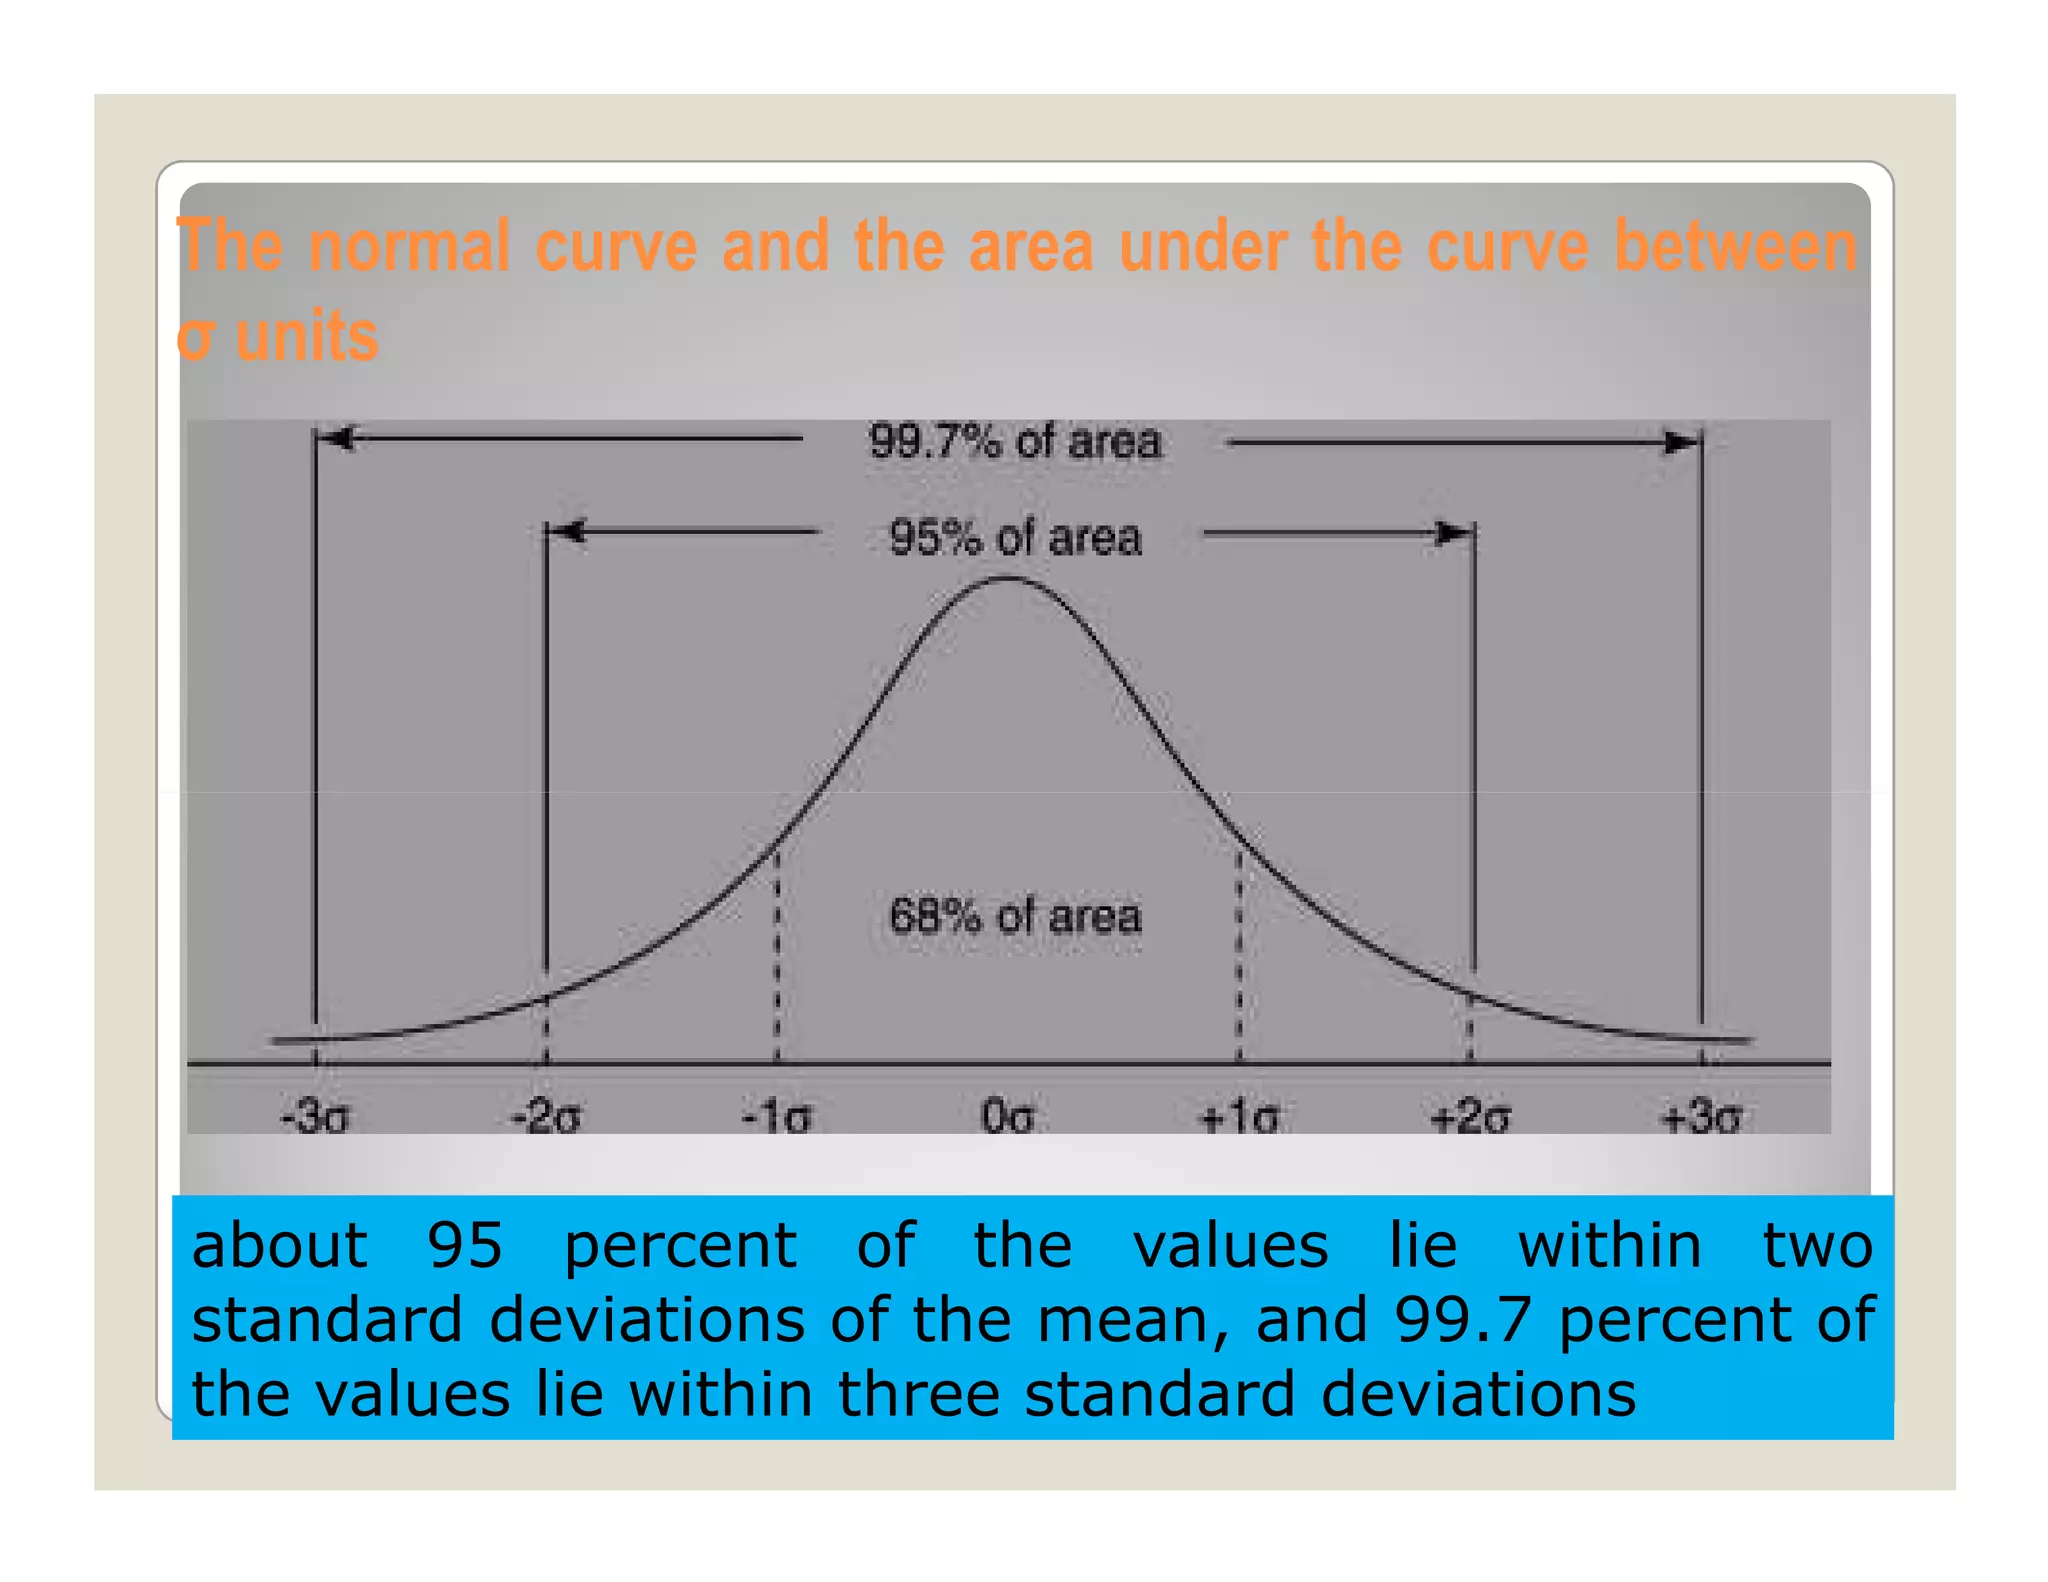
The normal curveand the area under the curve between
σ units
about 95 percent of the values lie within two
standard deviations of the mean, and 99.7 percent of
the values lie within three standard deviations
32.
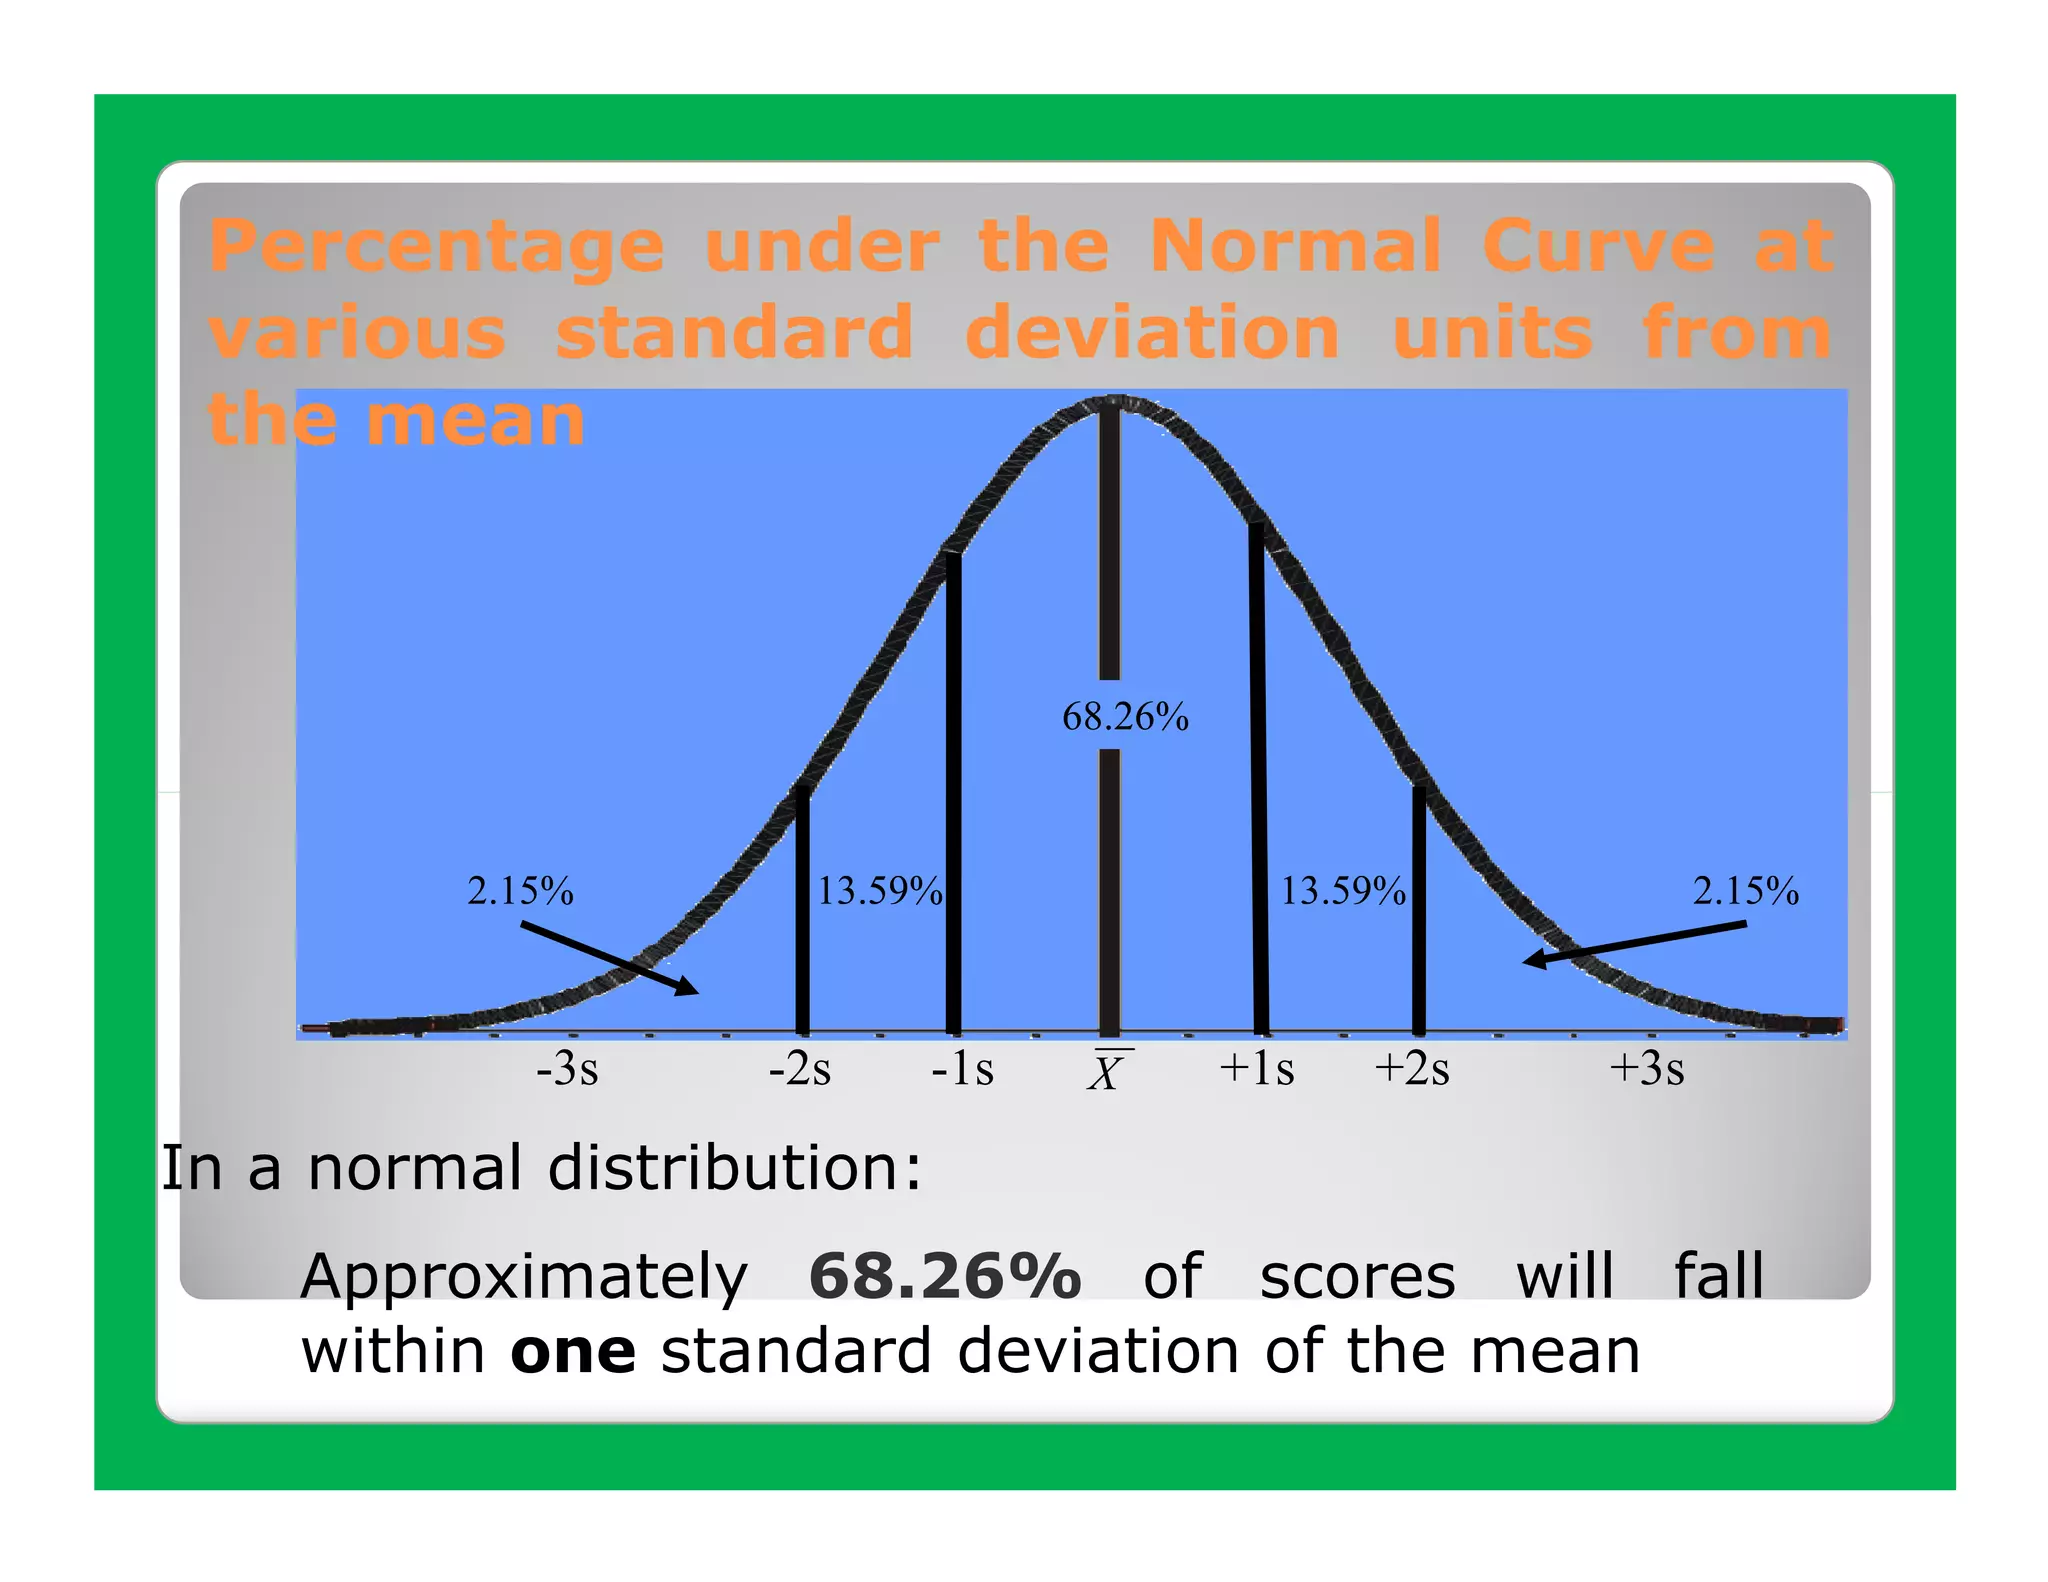
Percentage under theNormal Curve at
various standard deviation units from
the mean
68.26%
2.15% 13.59% 13.59% 2.15%
-3s -2s -1s X +1s +2s +3s
In a normal distribution:
Approximately 68.26% of scores will fall
within one standard deviation of the mean
33.
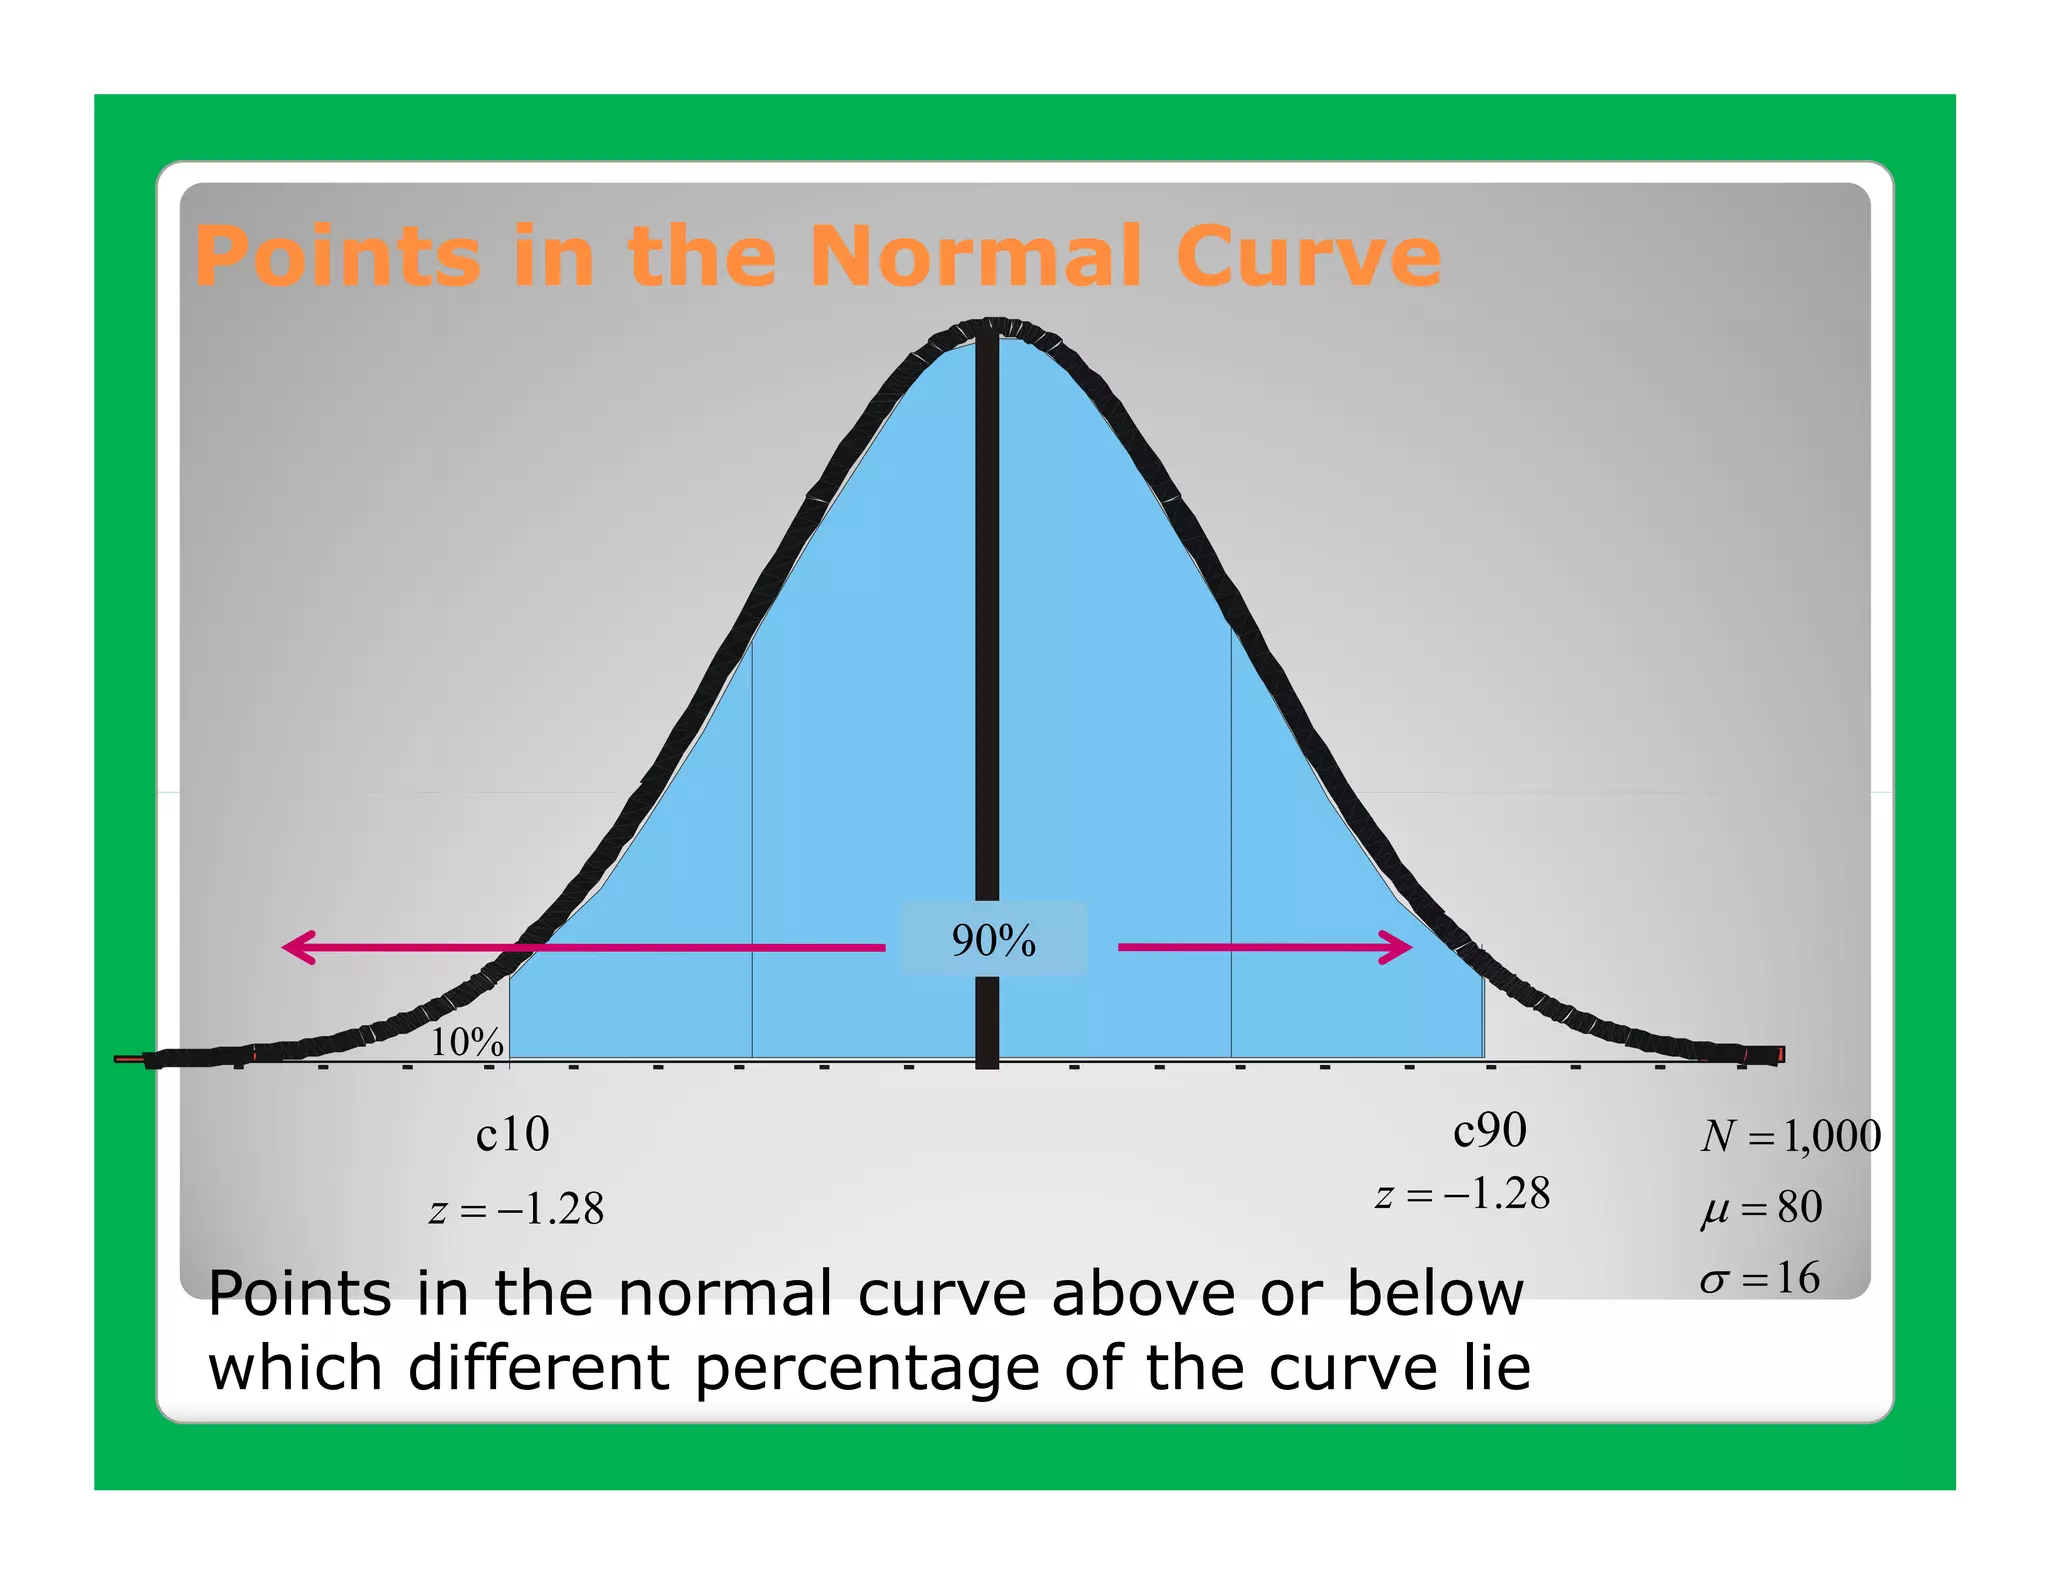
Points in theNormal Curve
90%
10%
c10 c90 N = 1,000
z = −1.28 z = −1.28 µ = 80
Points in the normal curve above or below σ = 16
which different percentage of the curve lie
34.
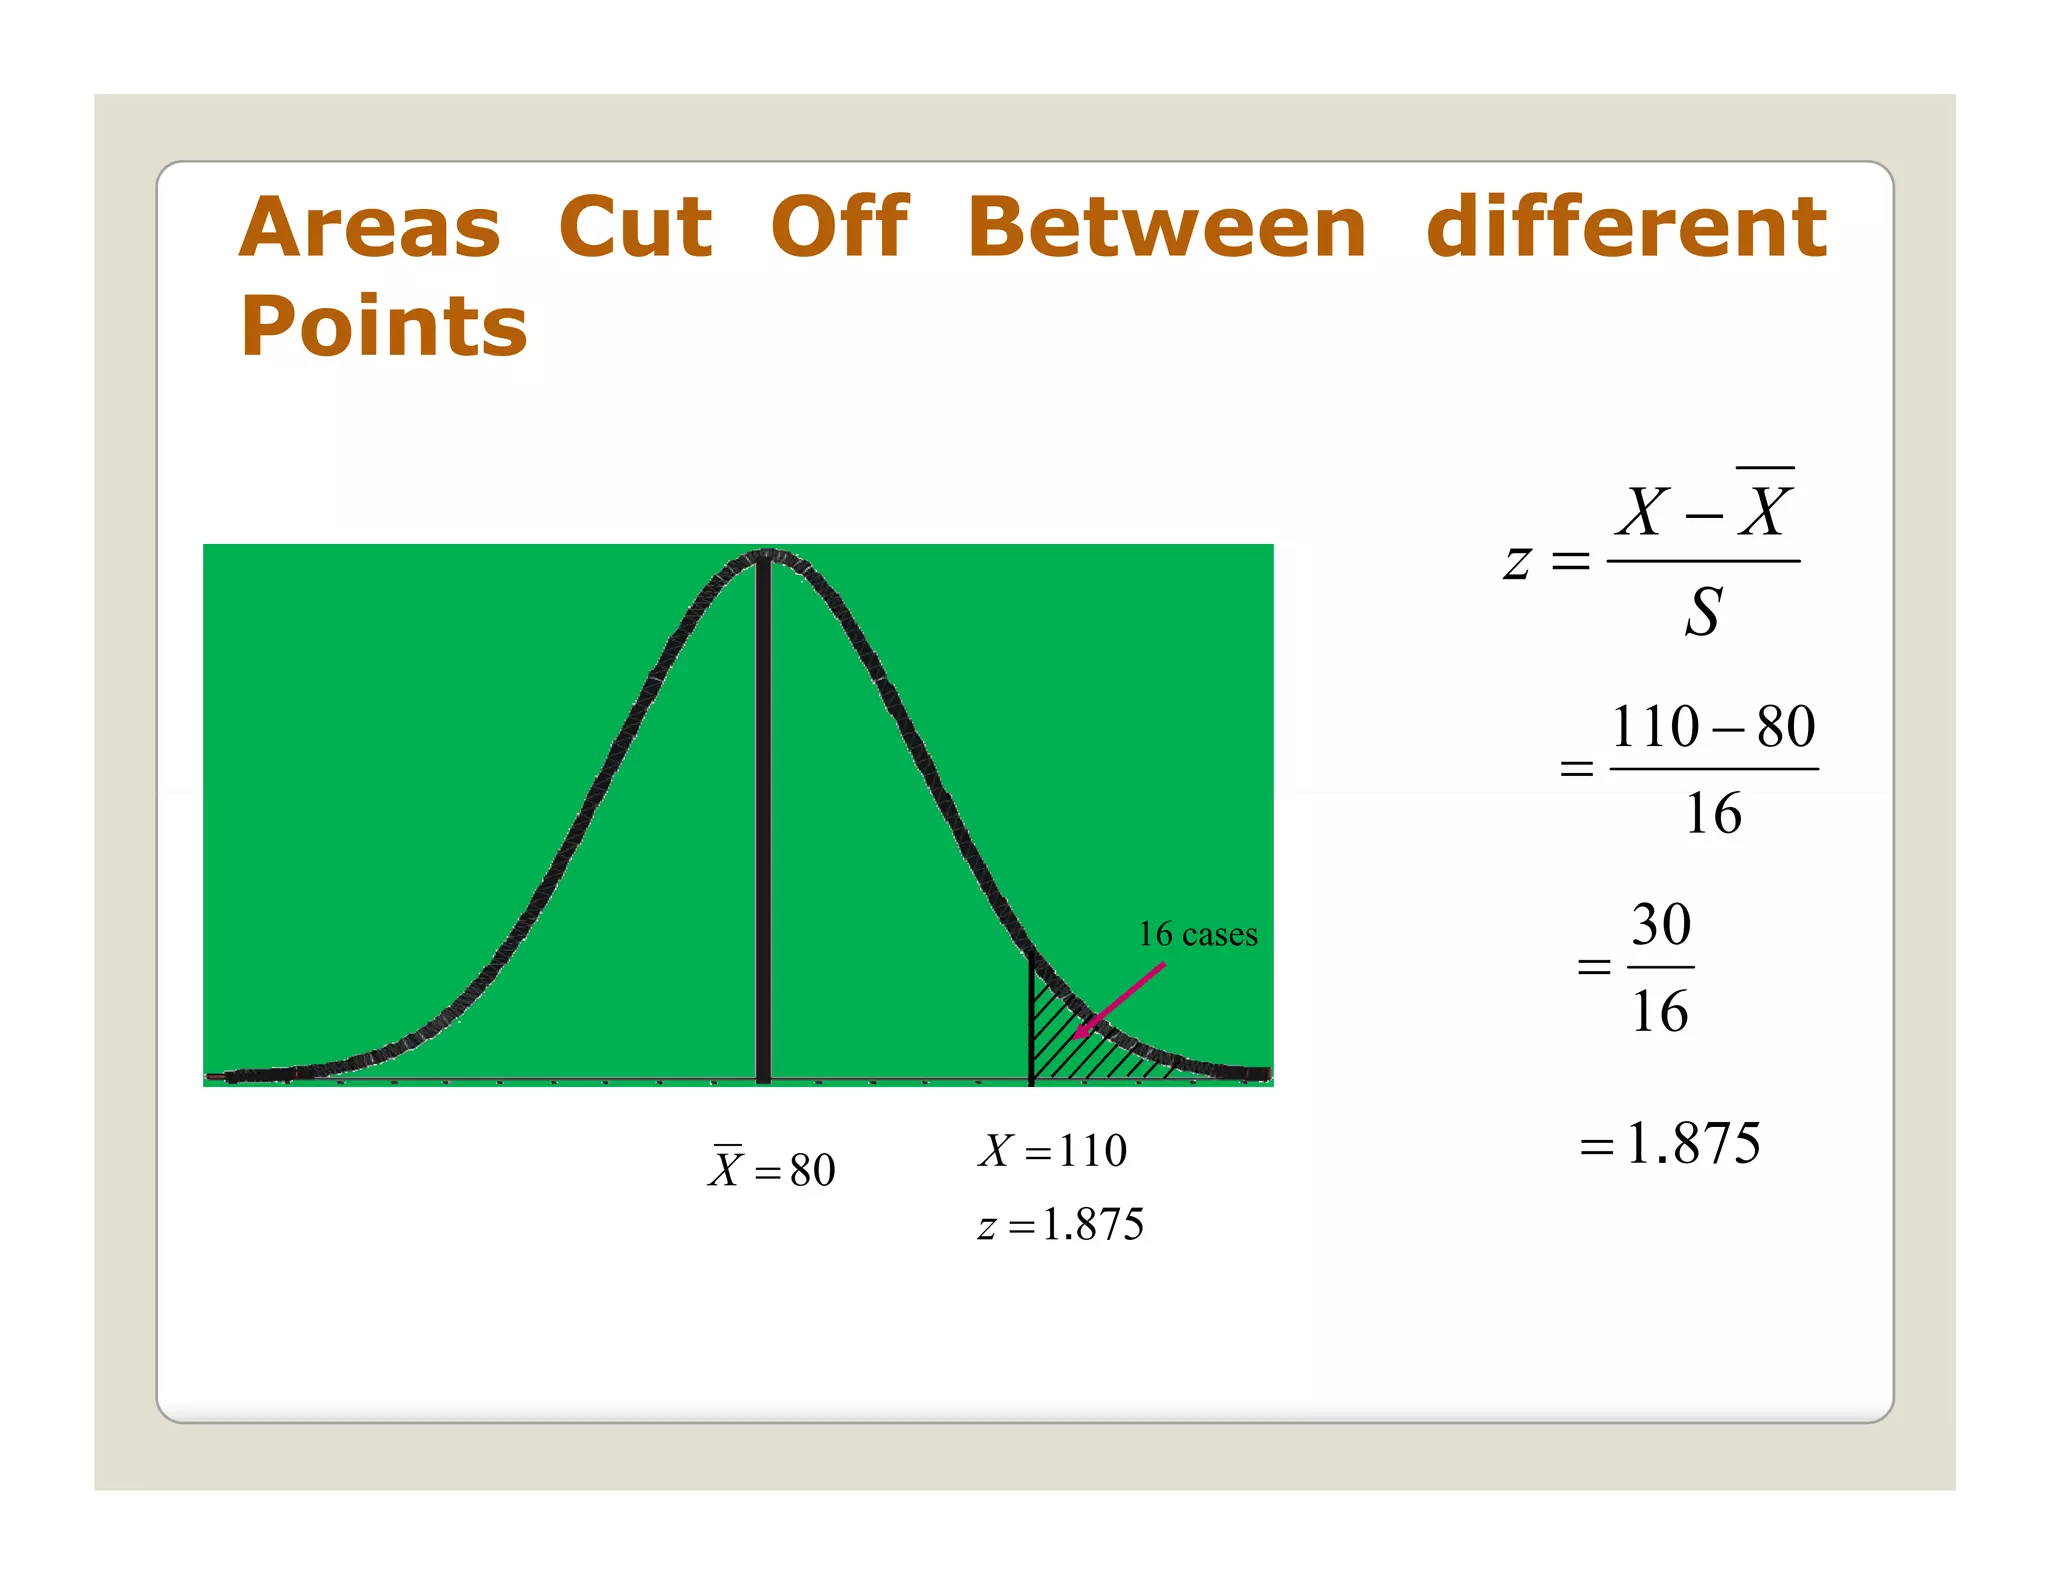
Areas Cut OffBetween different
Points
X−X
z=
S
110 − 80
=
16
16 cases 30
=
16
X = 80 X = 110 = 1.875
z = 1.875
35.
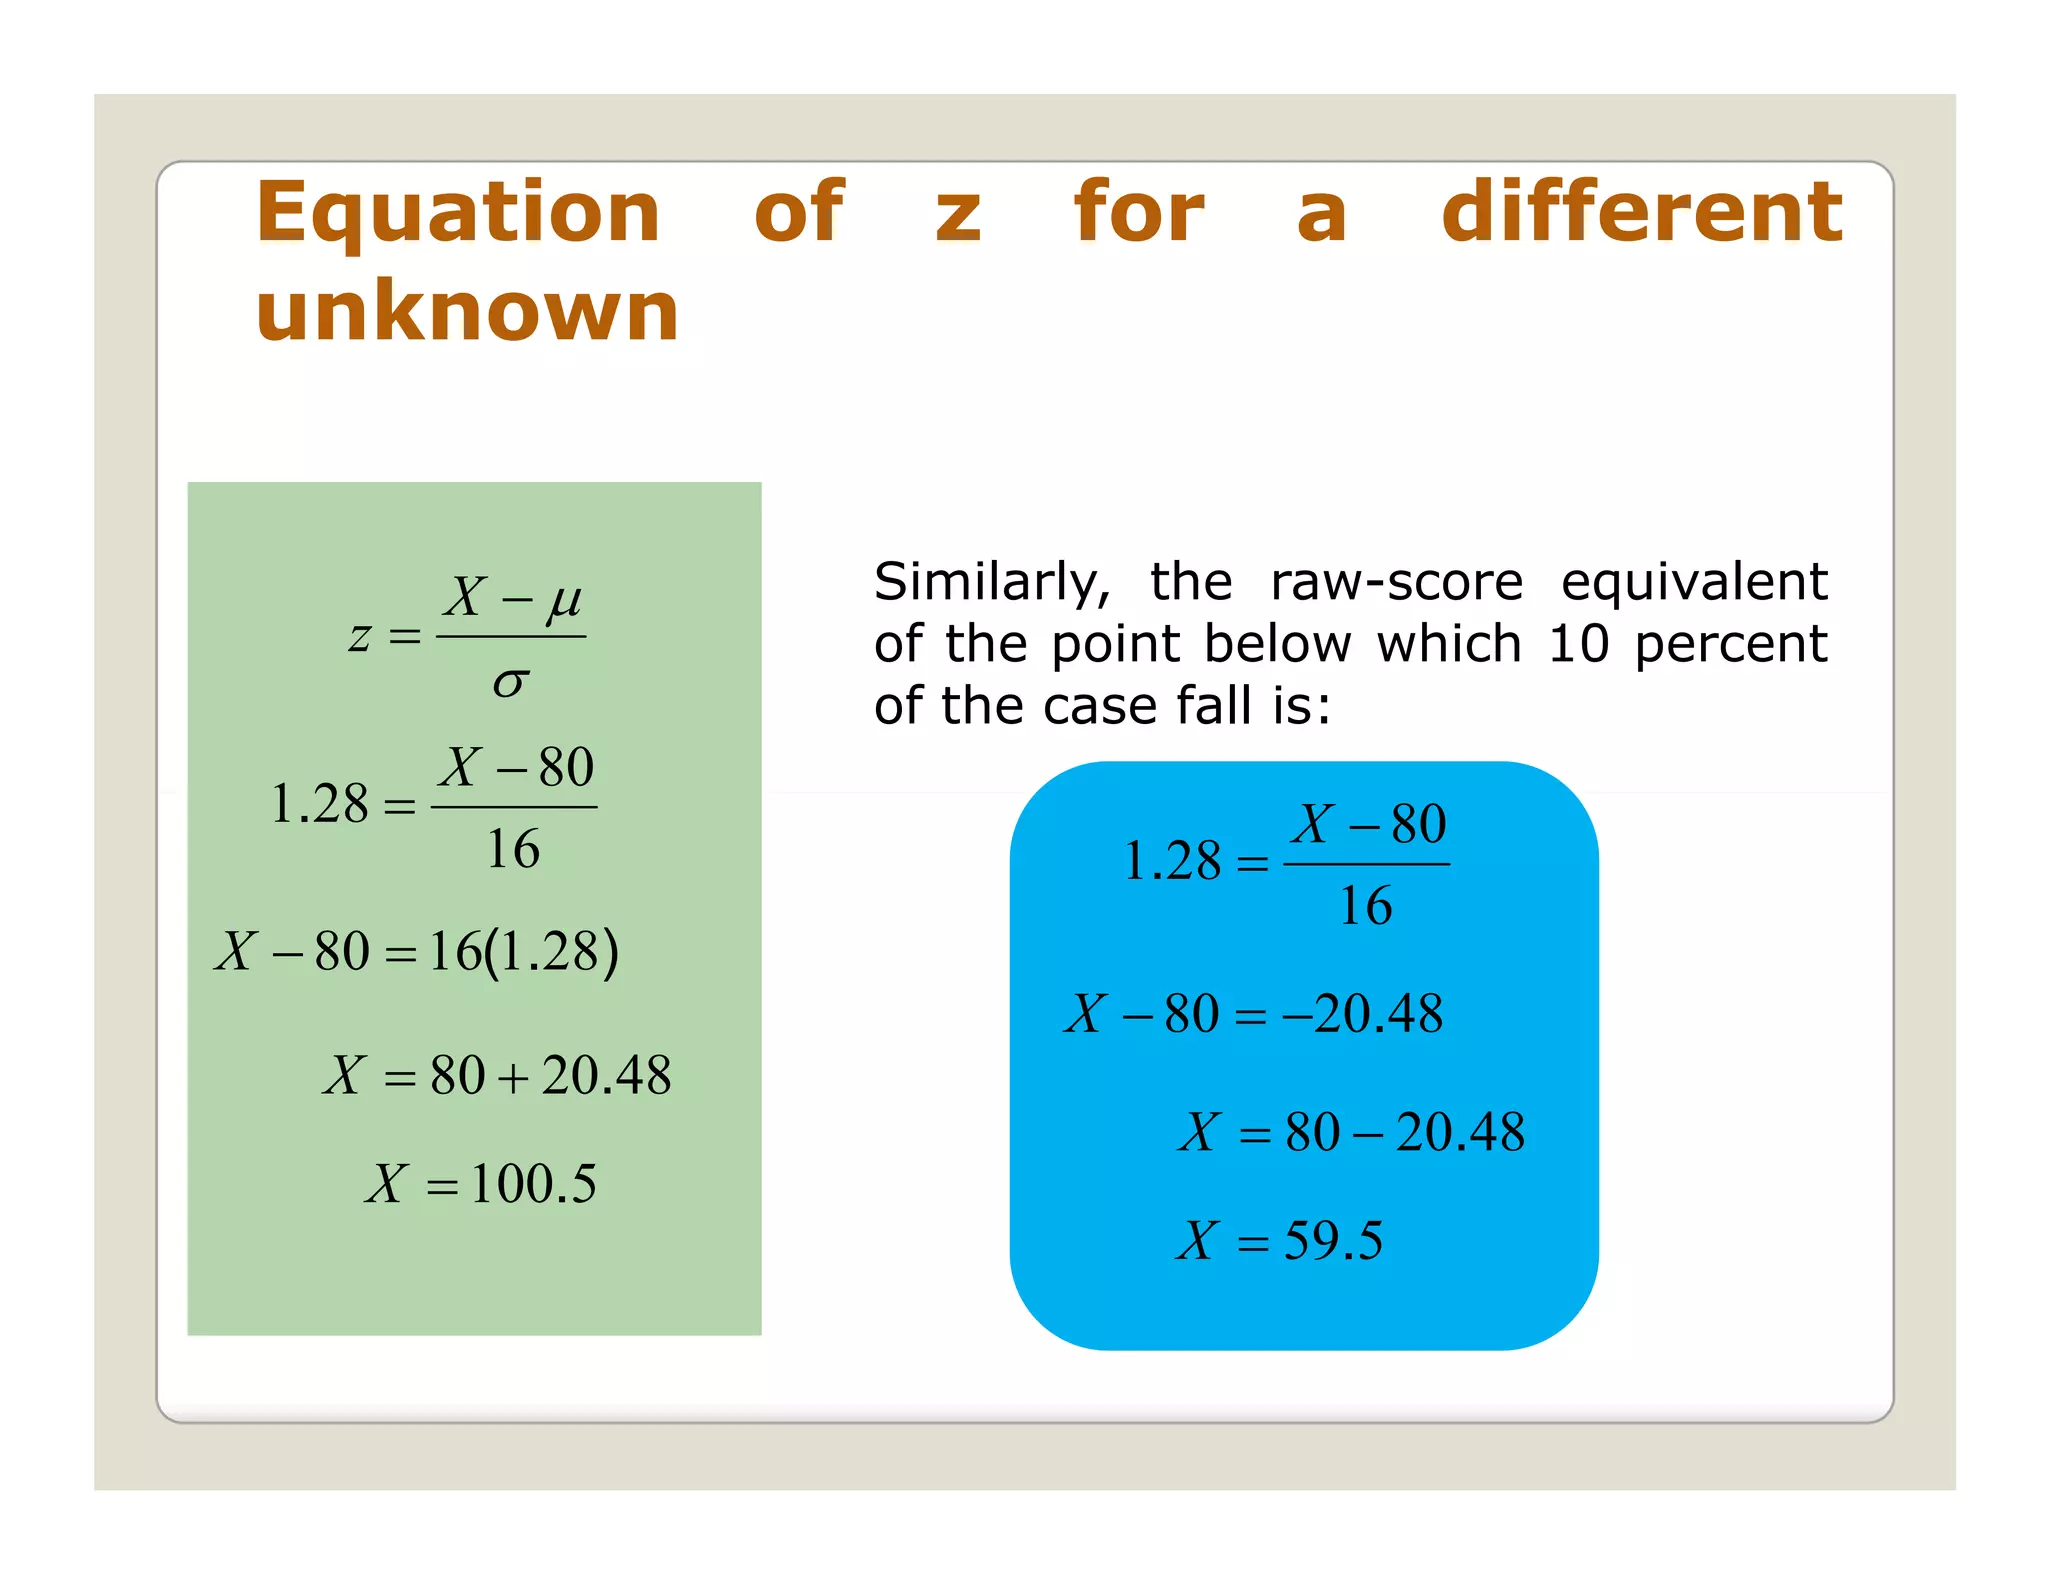
Equation of z for a different
unknown
X −µ Similarly, the raw-score equivalent
z= of the point below which 10 percent
σ of the case fall is:
X − 80
1.28 = X − 80
16 1.28 =
16
X − 80 = 16(1.28)
X − 80 = −20.48
X = 80 + 20.48
X = 80 − 20.48
X = 100.5
X = 59.5
36.
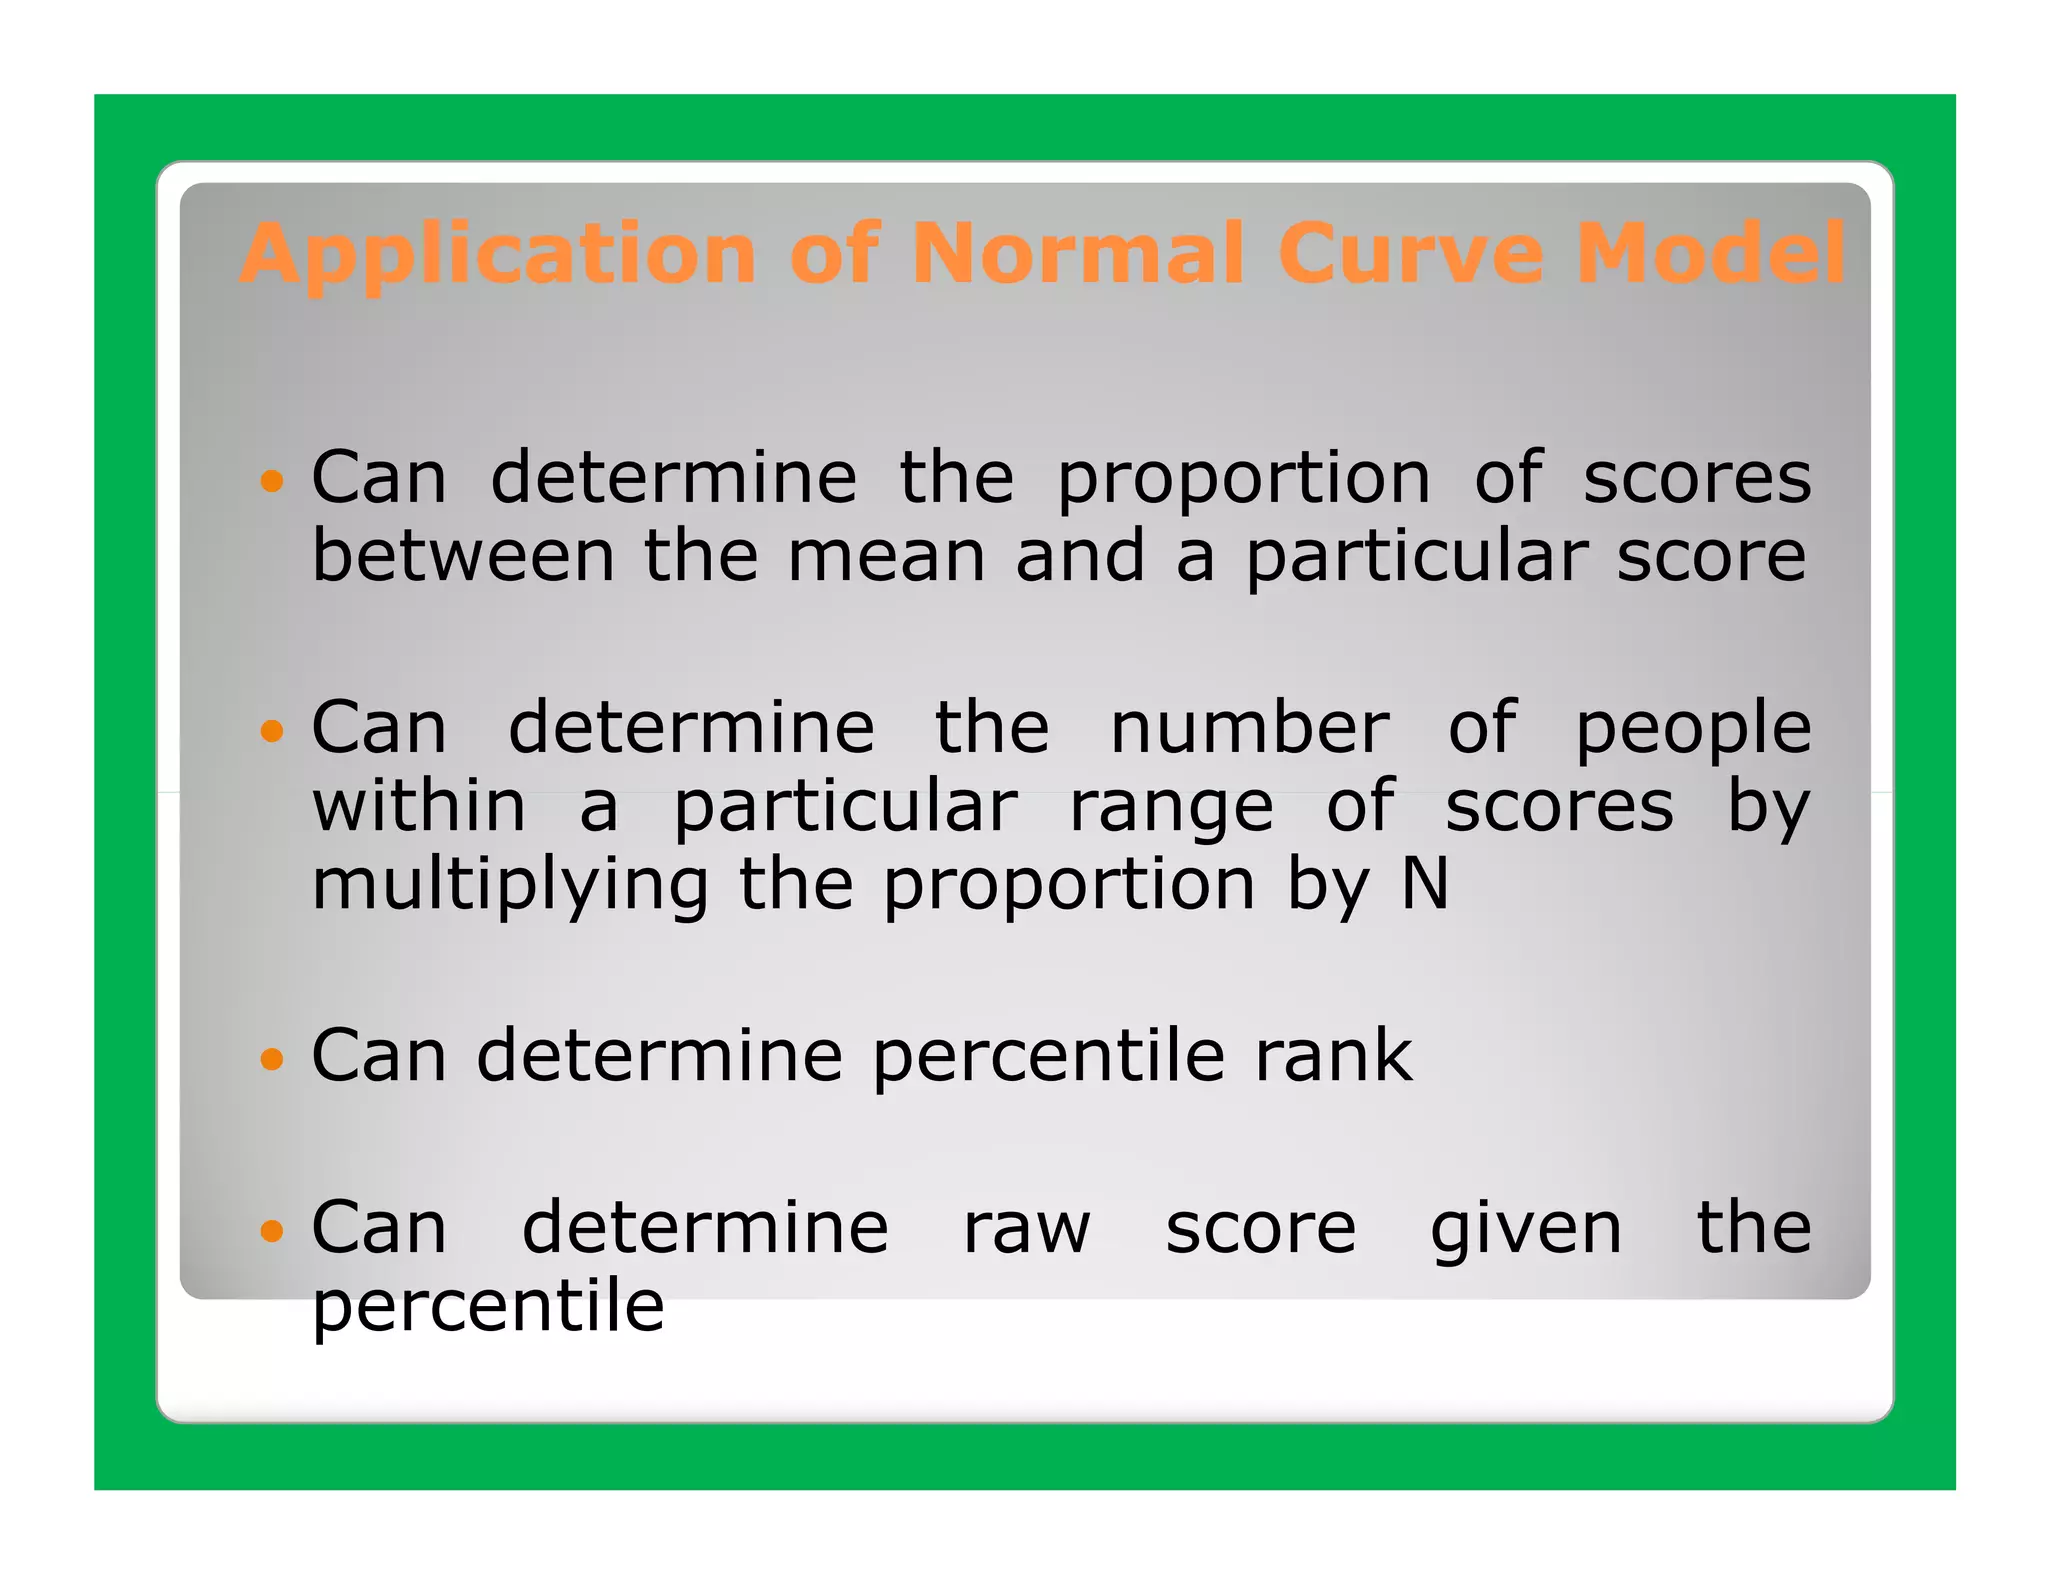
Application of NormalCurve Model
Can determine the proportion of scores
between the mean and a particular score
Can determine the number of people
within a particular range of scores by
multiplying the proportion by N
Can determine percentile rank
Can determine raw score given the
percentile
37.
Acknowledgement of References:
N.M Downie and R.W Heath. Basic
Statistical Methods, 5th Edition. Harper &
Row Publisher, 1983
Robert Niles
http://www.robertniles.com/stats/stdev.shtml
Rosita G. Santos, Phd, et. al. Statistics.
Escolar University, 1995.
Leslie MacGregor. z Scores & the Normal
Curve Model (presentation)