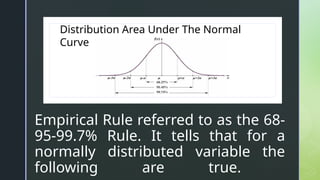
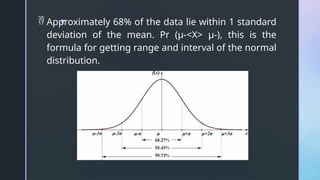
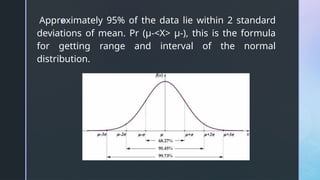
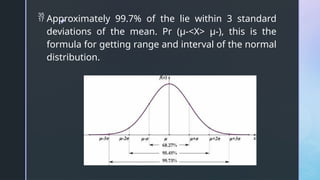
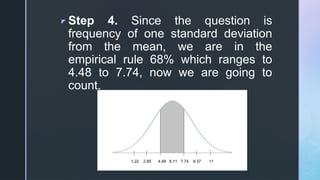
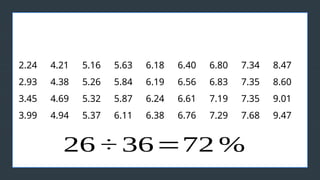
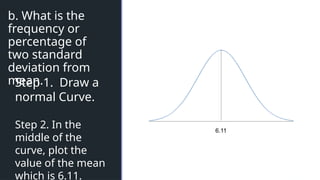
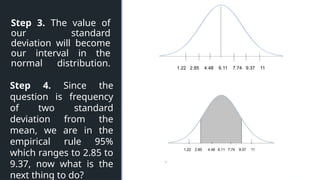
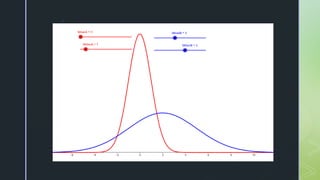
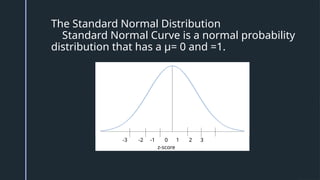
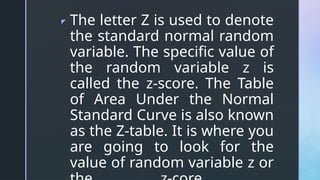
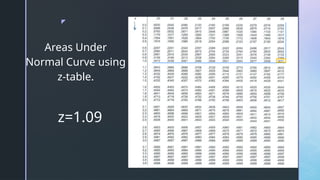
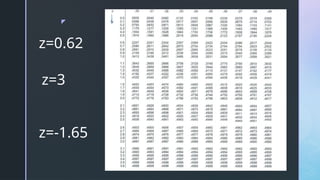
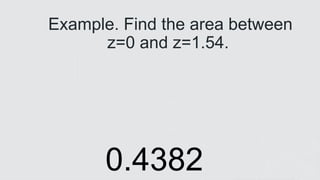
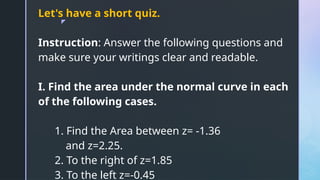
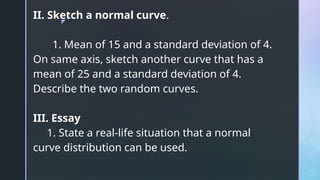
z
Is this
normal?
z
Is this
normal?
Why do you
think its not
normal?
z
Is this normal?
Why should we
normalize this
kind of
practice?
z
Is this normal?
Why should we
NOT normalize
this kind of
behavior?
NILAIT VS NANLAIT
z
Example 1. Height Distribution of
Grade 3 students in Wangyu
Elementary School.
z
Example 2. Employees daily wages
in peso in Gaisano mall, Cagayan de
Oro.
0.9
0.8
0.7
0.6
0.5
0.4
0.3
0.2
0.1
1-100 101-200 201-300 301-400 401-500 501-600 601-700 701-800 801-900-1000 1001-1100
z
z
N R
O
M
A
L C
U
R V
E
z
N
R
O M A L
C U
R
V E
z
Normal Distribution
is also called as
Gaussian
Distribution. It is the
probability of
continuous random
variable and
consider as the most
important curve in
statistics.
z
z
The
equation of
the
theoretical
normal
distribution
is given by
the formula.
z
Properties of Normal
Curve.
1.The distribution curve is
bell shaped.
2.The curve is symmetrical
to its center, the mean.
3.The mean, median and
mode coincide at the
center.
Properties of Normal
Curve.
3. The width of the curve is
determined by the standard
deviation of the distribution.
4. The curve is asymptotic to the
horizontal axis.
5. The area under the curve is 1, thus
it represents the probability or
proportion, or percentage associated
with specific sets of measurements
values.
Normal distribution is determined by
two parameters: the mean and the
standard deviation.
1. Mean Value
2. Standard Deviation Value
z
z
Empirical Rule referred to as the 68-
95-99.7% Rule. It tells that for a
normally distributed variable the
following are true.
Distribution Area Under The Normal
Curve
z
 Approximately 68% of the data lie within 1 standard
deviation of the mean. Pr (μ-<X> μ-), this is the
formula for getting range and interval of the normal
distribution.
z
Approximately 95% of the data lie within 2 standard
deviations of mean. Pr (μ-<X> μ-), this is the formula
for getting range and interval of the normal
distribution.
z
 Approximately 99.7% of the lie within 3 standard
deviations of the mean. Pr (μ-<X> μ-), this is the
formula for getting range and interval of the normal
distribution.
z
z
Example 1. What is the frequency
and relative frequency of babies’
weight that are within;
a. What is the frequency
or percentage of one
standard deviation from
mean.
b. What is the frequency
or percentage of two
standard deviation from
mean.
4.94 4.69 5.26 7.29 7.19 9.47 6.61 5.84 6.83
3.45 2.93 6.38 4.38 6.76 9.02 8.47 6.80 6.40
8.60 3.99 7.68 2.24 5.32 6.24 6.29 5.63 5.37
5.26 7.35 6.11 7.34 5.87 6.56 6.18 7.35 4.21
z
z
2.24 4.21 5.16 5.63 6.18 6.40 6.80 7.34 8.47
2.93 4.38 5.26 5.84 6.19 6.56 6.83 7.35 8.60
3.45 4.69 5.32 5.87 6.24 6.61 7.19 7.35 9.01
3.99 4.94 5.37 6.11 6.38 6.76 7.29 7.68 9.47
z
z
a. What is the
frequency or
percentage of one
standard deviation
from mean.
Solution:
Step 1. Draw a normal
Curve.
Step 2. In the middle of
the curve, plot
the value of the
6.11
z
z
Step 3. The value of
our standard
deviation will become
our interval in the
normal distribution.
1.22 2.85 4.48 6.11 7.74 9.37 11
When you are going
to the right starting
in the middle, mean
plus the standard
deviation meanwhile
when you are going
to the left of the
curve standard
deviation is
z Step 4. Since the question is
frequency of one standard deviation
from the mean, we are in the
empirical rule 68% which ranges to
4.48 to 7.74, now we are going to
count.
z
2.24 4.21 5.16 5.63 6.18 6.40 6.80 7.34 8.47
2.93 4.38 5.26 5.84 6.19 6.56 6.83 7.35 8.60
3.45 4.69 5.32 5.87 6.24 6.61 7.19 7.35 9.01
3.99 4.94 5.37 6.11 6.38 6.76 7.29 7.68 9.47
26 ÷ 36=72 %
÷÷
z
z
b. What is the
frequency or
percentage of
two standard
deviation from
mean.
6.11
Step 1. Draw a
normal Curve.
Step 2. In the
middle of the
curve, plot the
value of the mean
which is 6.11.
z
z
Step 3. The value of
our standard
deviation will become
our interval in the
normal distribution. 1.22 2.85 4.48 6.11 7.74 9.37 11
Step 4. Since the
question is frequency
of two standard
deviation from the
mean, we are in the
empirical rule 95%
which ranges to 2.85 to
9.37, now what is the
next thing to do?
z
2.24 4.21 5.16 5.63 6.18 6.40 6.80 7.34 8.47
2.93 4.38 5.26 5.84 6.19 6.56 6.83 7.35 8.60
3.45 4.69 5.32 5.87 6.24 6.61 7.19 7.35 9.01
3.99 4.94 5.37 6.11 6.38 6.76 7.29 7.68 9.47
3 4 ÷ 36=95 %
÷÷
z
How about if we
compare two data
sets with normal
curve?
z
z
=50
=10
=50
=5
z
z
z
The Standard Normal Distribution
Standard Normal Curve is a normal probability
distribution that has a μ= 0 and =1.
-3 -2 -1 0 1 2 3
z-score
z The letter Z is used to denote
the standard normal random
variable. The specific value of
the random variable z is
called the z-score. The Table
of Area Under the Normal
Standard Curve is also known
as the Z-table. It is where you
are going to look for the
value of random variable z or
z
Areas Under
Normal Curve using
z-table.
z=1.09
z
z=0.62
z=-1.65
z=3
z
z
Example. Find the area between
z=0 and z=1.54.
0.4382
z
z
Areas Under
Standard
Normal Curve
Find the area
between z=1.52
and z=2.5
z
Find the area
between z= -1.5
and z=-2.5
z
Let’s try
this !
1. Anna is planning to enroll in MSU
taking up Bachelor of Science in Civil
Engineering. The average academic
performance of all the students 80 and
a standard deviation of 5, it follows a
normal distribution.
a. Sketch a Normal Curve using
Empirical Rule and describe the
curves.
2. Find the area between z=1.7 and z=2
z
Let's have a short quiz.
Instruction: Answer the following questions and
make sure your writings clear and readable.
I. Find the area under the normal curve in each
of the following cases.
1. Find the Area between z= -1.36
and z=2.25.
2. To the right of z=1.85
3. To the left z=-0.45
z
II. Sketch a normal curve.
1. Mean of 15 and a standard deviation of 4.
On same axis, sketch another curve that has a
mean of 25 and a standard deviation of 4.
Describe the two random curves.
III. Essay
1. State a real-life situation that a normal
curve distribution can be used.

Presentation1.pptx .normal curve/distribution

  • 1.
  • 2.
    z Is this normal? Why doyou think its not normal?
  • 3.
    z Is this normal? Whyshould we normalize this kind of practice?
  • 4.
    z Is this normal? Whyshould we NOT normalize this kind of behavior? NILAIT VS NANLAIT
  • 5.
    z Example 1. HeightDistribution of Grade 3 students in Wangyu Elementary School.
  • 6.
    z Example 2. Employeesdaily wages in peso in Gaisano mall, Cagayan de Oro. 0.9 0.8 0.7 0.6 0.5 0.4 0.3 0.2 0.1 1-100 101-200 201-300 301-400 401-500 501-600 601-700 701-800 801-900-1000 1001-1100
  • 7.
  • 8.
  • 9.
    z N R O M AL C U R V E
  • 10.
    z Normal Distribution is alsocalled as Gaussian Distribution. It is the probability of continuous random variable and consider as the most important curve in statistics.
  • 11.
  • 12.
  • 13.
    Properties of Normal Curve. 1.Thedistribution curve is bell shaped. 2.The curve is symmetrical to its center, the mean. 3.The mean, median and mode coincide at the center.
  • 14.
    Properties of Normal Curve. 3.The width of the curve is determined by the standard deviation of the distribution. 4. The curve is asymptotic to the horizontal axis. 5. The area under the curve is 1, thus it represents the probability or proportion, or percentage associated with specific sets of measurements values.
  • 15.
    Normal distribution isdetermined by two parameters: the mean and the standard deviation. 1. Mean Value 2. Standard Deviation Value
  • 16.
    z z Empirical Rule referredto as the 68- 95-99.7% Rule. It tells that for a normally distributed variable the following are true. Distribution Area Under The Normal Curve
  • 17.
    z  Approximately 68%of the data lie within 1 standard deviation of the mean. Pr (μ-<X> μ-), this is the formula for getting range and interval of the normal distribution.
  • 18.
    z Approximately 95% ofthe data lie within 2 standard deviations of mean. Pr (μ-<X> μ-), this is the formula for getting range and interval of the normal distribution.
  • 19.
    z  Approximately 99.7%of the lie within 3 standard deviations of the mean. Pr (μ-<X> μ-), this is the formula for getting range and interval of the normal distribution.
  • 20.
    z z Example 1. Whatis the frequency and relative frequency of babies’ weight that are within; a. What is the frequency or percentage of one standard deviation from mean. b. What is the frequency or percentage of two standard deviation from mean. 4.94 4.69 5.26 7.29 7.19 9.47 6.61 5.84 6.83 3.45 2.93 6.38 4.38 6.76 9.02 8.47 6.80 6.40 8.60 3.99 7.68 2.24 5.32 6.24 6.29 5.63 5.37 5.26 7.35 6.11 7.34 5.87 6.56 6.18 7.35 4.21
  • 21.
  • 22.
    z 2.24 4.21 5.165.63 6.18 6.40 6.80 7.34 8.47 2.93 4.38 5.26 5.84 6.19 6.56 6.83 7.35 8.60 3.45 4.69 5.32 5.87 6.24 6.61 7.19 7.35 9.01 3.99 4.94 5.37 6.11 6.38 6.76 7.29 7.68 9.47
  • 23.
    z z a. What isthe frequency or percentage of one standard deviation from mean. Solution: Step 1. Draw a normal Curve. Step 2. In the middle of the curve, plot the value of the 6.11
  • 24.
    z z Step 3. Thevalue of our standard deviation will become our interval in the normal distribution. 1.22 2.85 4.48 6.11 7.74 9.37 11 When you are going to the right starting in the middle, mean plus the standard deviation meanwhile when you are going to the left of the curve standard deviation is
  • 25.
    z Step 4.Since the question is frequency of one standard deviation from the mean, we are in the empirical rule 68% which ranges to 4.48 to 7.74, now we are going to count.
  • 26.
    z 2.24 4.21 5.165.63 6.18 6.40 6.80 7.34 8.47 2.93 4.38 5.26 5.84 6.19 6.56 6.83 7.35 8.60 3.45 4.69 5.32 5.87 6.24 6.61 7.19 7.35 9.01 3.99 4.94 5.37 6.11 6.38 6.76 7.29 7.68 9.47 26 ÷ 36=72 % ÷÷
  • 27.
    z z b. What isthe frequency or percentage of two standard deviation from mean. 6.11 Step 1. Draw a normal Curve. Step 2. In the middle of the curve, plot the value of the mean which is 6.11.
  • 28.
    z z Step 3. Thevalue of our standard deviation will become our interval in the normal distribution. 1.22 2.85 4.48 6.11 7.74 9.37 11 Step 4. Since the question is frequency of two standard deviation from the mean, we are in the empirical rule 95% which ranges to 2.85 to 9.37, now what is the next thing to do?
  • 29.
    z 2.24 4.21 5.165.63 6.18 6.40 6.80 7.34 8.47 2.93 4.38 5.26 5.84 6.19 6.56 6.83 7.35 8.60 3.45 4.69 5.32 5.87 6.24 6.61 7.19 7.35 9.01 3.99 4.94 5.37 6.11 6.38 6.76 7.29 7.68 9.47 3 4 ÷ 36=95 % ÷÷
  • 30.
    z How about ifwe compare two data sets with normal curve?
  • 31.
  • 32.
  • 33.
  • 34.
    z z The Standard NormalDistribution Standard Normal Curve is a normal probability distribution that has a μ= 0 and =1. -3 -2 -1 0 1 2 3 z-score
  • 35.
    z The letterZ is used to denote the standard normal random variable. The specific value of the random variable z is called the z-score. The Table of Area Under the Normal Standard Curve is also known as the Z-table. It is where you are going to look for the value of random variable z or
  • 36.
    z Areas Under Normal Curveusing z-table. z=1.09
  • 37.
  • 38.
    z z Example. Find thearea between z=0 and z=1.54. 0.4382
  • 39.
    z z Areas Under Standard Normal Curve Findthe area between z=1.52 and z=2.5
  • 40.
    z Find the area betweenz= -1.5 and z=-2.5
  • 41.
    z Let’s try this ! 1.Anna is planning to enroll in MSU taking up Bachelor of Science in Civil Engineering. The average academic performance of all the students 80 and a standard deviation of 5, it follows a normal distribution. a. Sketch a Normal Curve using Empirical Rule and describe the curves. 2. Find the area between z=1.7 and z=2
  • 42.
    z Let's have ashort quiz. Instruction: Answer the following questions and make sure your writings clear and readable. I. Find the area under the normal curve in each of the following cases. 1. Find the Area between z= -1.36 and z=2.25. 2. To the right of z=1.85 3. To the left z=-0.45
  • 43.
    z II. Sketch anormal curve. 1. Mean of 15 and a standard deviation of 4. On same axis, sketch another curve that has a mean of 25 and a standard deviation of 4. Describe the two random curves. III. Essay 1. State a real-life situation that a normal curve distribution can be used.