Download as PDF, PPTX

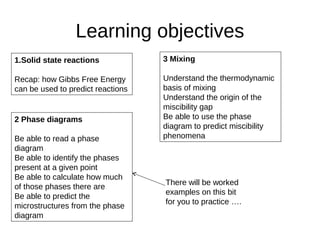
![1. Prediction of reactions
e.g. solar cell contact – metal M to semiconductor AB
AB
M
AB
M
MB + A
AB
M
or
stable
unstable
M + AB MB + A Will it happen at equilibrium?
keqm = [MB]*[A] /[M]*[AB] If keqm is large, the reaction goes from l to r
)ln( eqmkRTG Find the Gibb’s free energy for the reaction.
If ∆G is large and negative, keqm is large and the reaction goes from l to r](https://image.slidesharecdn.com/cdtlecture-phasediagrams-141107043936-conversion-gate02/85/Lecture-8-Phase-Diagrams-3-320.jpg)
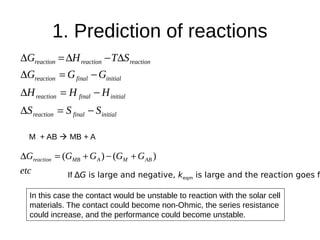
![ΔSmix derived
ΔS = (Sfinal – Sinitial)
Sfinal from the statistical definition S = kBlnw
ΔSmix = kBln
Using Stirling’s approximation lnn! = nlnn-n gives
• ΔSmix = -NkB[ xAlnxA + xBlnxB]
)!()!(
!
BA NxNx
N
For reference only](https://image.slidesharecdn.com/cdtlecture-phasediagrams-141107043936-conversion-gate02/85/Lecture-8-Phase-Diagrams-31-320.jpg)
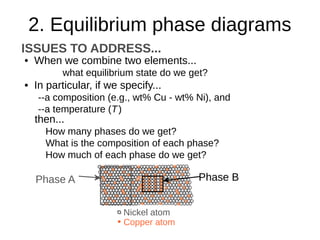
![ΔGmix - the formula
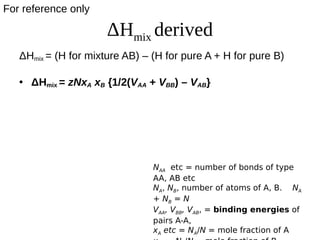
• ΔGmix = zNxA xB {1/2(VAA + VBB) – VAB}
+ NkBT[ xAlnxA + xBlnxB]
Binding energy term {...} may be +ve or –ve
Entropy term [...] is negative
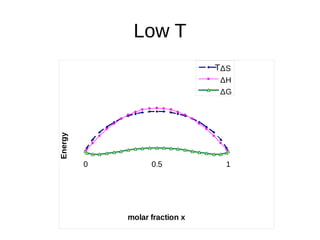
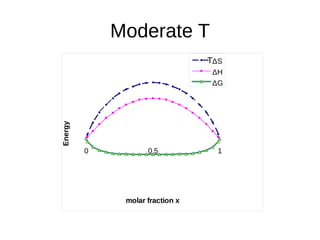
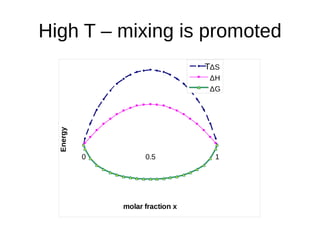
mixmixmix STHG
For reference only](https://image.slidesharecdn.com/cdtlecture-phasediagrams-141107043936-conversion-gate02/85/Lecture-8-Phase-Diagrams-32-320.jpg)
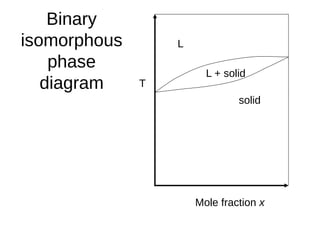
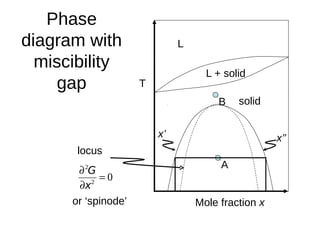
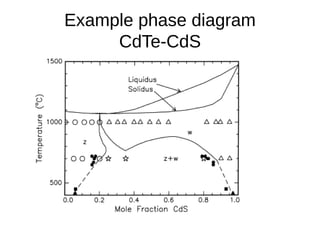
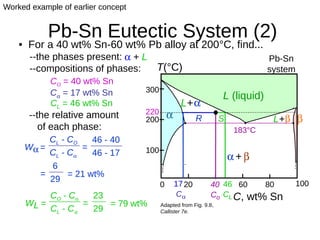

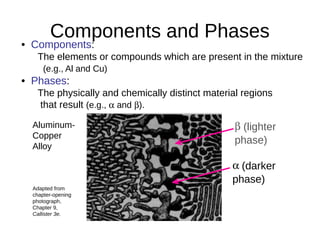
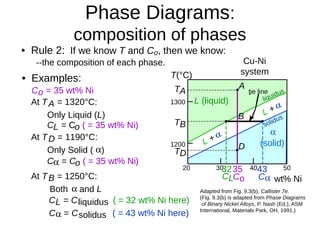
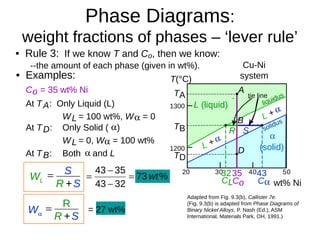
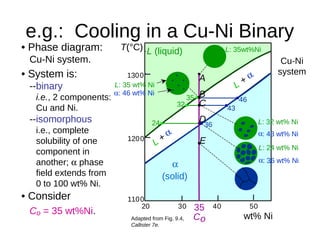
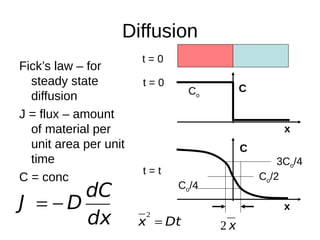
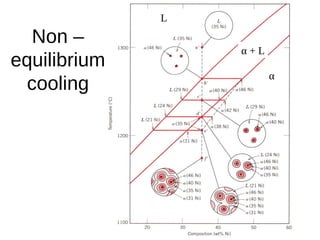
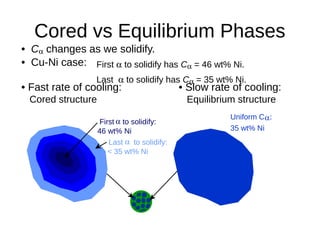
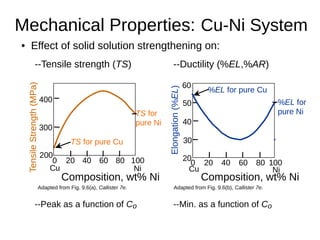
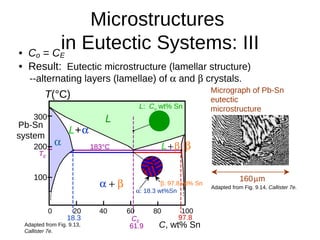
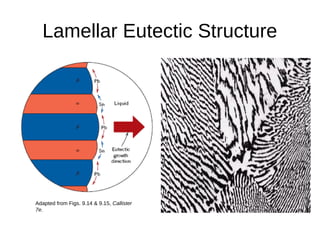
1. The document discusses phase diagrams and thermodynamics of mixing. 2. It explains how phase diagrams can be used to determine the number and types of phases present, the composition of each phase, and the amount of each phase at a given temperature and composition. 3. Binary eutectic and eutectoid systems allow for a range of microstructures depending on the cooling rate, and alloying generally increases strength but decreases ductility due to solid solution strengthening.


![10[1].Phase Diagrams.ppt](https://cdn.slidesharecdn.com/ss_thumbnails/101-221009051328-479a8439-thumbnail.jpg?width=640&height=640&fit=bounds)


