This document discusses reaction rates and kinetics concepts including:
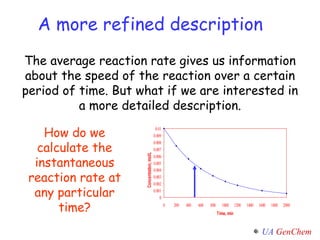
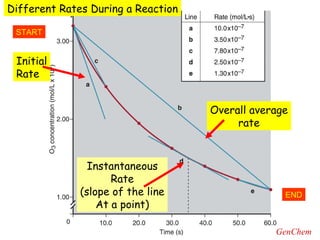
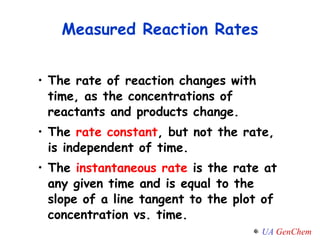
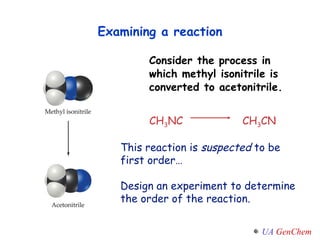
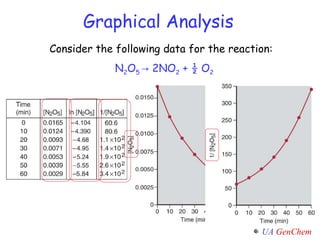
- Instantaneous reaction rates can be calculated from the slope of concentration-time graphs at specific points.
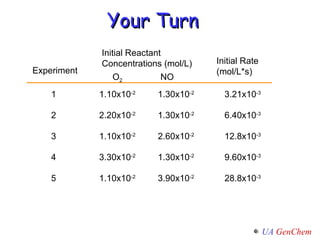
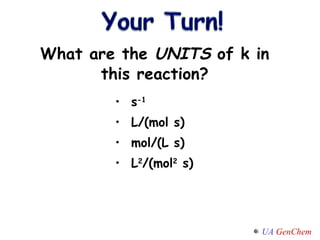
- Reaction orders and rate laws can be determined experimentally using methods like the initial rate method or integrated rate law method.
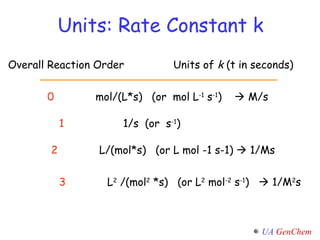
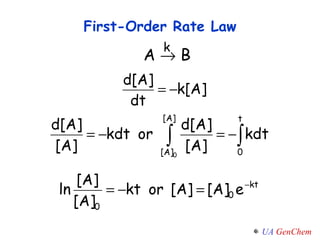
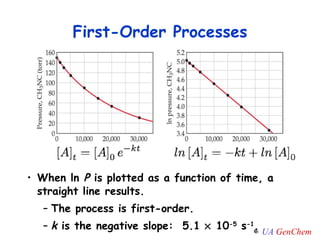
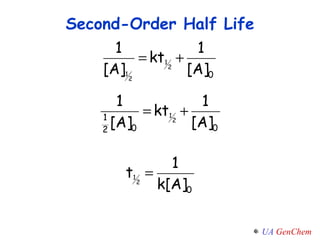
- First-order reactions follow the integrated rate law that the natural log of the concentration is linear with time. Second-order and zero-order reactions also have defining rate laws and kinetics equations.

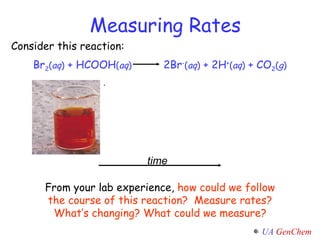
![ [Br 2 ] Absorption Br 2 ( aq ) + HCOOH ( aq ) 2Br - ( aq ) + 2H + ( aq ) + CO 2 ( g ) time 393 nm light Detector 393 nm Br 2 ( aq )](https://image.slidesharecdn.com/lectw2152-ratelawsalg-110506165719-phpapp02/85/Lect-w2-152-rate-laws_alg-6-320.jpg)
![Instantaneous rate = rate for specific tiny instance in time Br 2 ( aq ) + HCOOH ( aq ) 2Br - ( aq ) + 2H + ( aq ) + CO 2 ( g ) Average rate = [Br 2 ] t = - [Br 2 ] final – [Br 2 ] initial t final - t initial slope of tangent slope of tangent slope of tangent](https://image.slidesharecdn.com/lectw2152-ratelawsalg-110506165719-phpapp02/85/Lect-w2-152-rate-laws_alg-7-320.jpg)
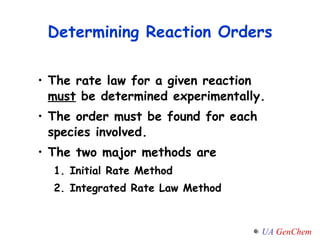
![rate [Br 2 ] rate = k [Br 2 ] + 0.0 = rate constant = 3.50 x 10 -3 s -1 Y=mX+b Constant = Slope = k How do the RATES change with [Br 2 ] ? Rate = k [Br 2 ] 1 this is called a 1 st order reaction Rate Law The rate law for a reaction tells us how rate varies with concentration of the reactants. Br 2 (aq) + HCOOH(aq) HBr(aq) + CO 2 (g) R A T E k = rate [Br 2 ]](https://image.slidesharecdn.com/lectw2152-ratelawsalg-110506165719-phpapp02/85/Lect-w2-152-rate-laws_alg-8-320.jpg)
![SOLUTION: For each of the following reactions, determine the reaction order with respect to each reactant and the overall order from the given rate law. (a) The reaction is 2nd order in NO, 1st order in O 2 , and 3rd order overall. Your Turn (a) 2NO( g ) + O 2 ( g ) 2NO 2 ( g ); rate = k [NO] 2 [O 2 ] CH 3 CHO( g ) CH 4 ( g ) + CO( g ); rate = k [CH 3 CHO] 3/2 (c) H 2 O 2 ( aq ) + 3I - ( aq ) + 2H + ( aq ) I 3 - ( aq ) + 2H 2 O( l ); rate = k [H 2 O 2 ][I - ]](https://image.slidesharecdn.com/lectw2152-ratelawsalg-110506165719-phpapp02/85/Lect-w2-152-rate-laws_alg-9-320.jpg)
![SOLUTION: For each of the following reactions, determine the reaction order with respect to each reactant and the overall order from the given rate law. (a) The reaction is 2nd order in NO, 1st order in O 2 , and 3rd order overall. Your Turn (a) 2NO( g ) + O 2 ( g ) 2NO 2 ( g ); rate = k [NO] 2 [O 2 ] CH 3 CHO( g ) CH 4 ( g ) + CO( g ); rate = k [CH 3 CHO] 3/2 (c) H 2 O 2 ( aq ) + 3I - ( aq ) + 2H + ( aq ) I 3 - ( aq ) + 2H 2 O( l ); rate = k [H 2 O 2 ][I - ]](https://image.slidesharecdn.com/lectw2152-ratelawsalg-110506165719-phpapp02/85/Lect-w2-152-rate-laws_alg-10-320.jpg)
![What is the effect on the rate if the concentration of A is doubled? Consider the reaction: 2A + 2B + C -> 2D + E If the rate law for this reaction is Rate = k [A][B] 2 No change x2 x4 x8 x16](https://image.slidesharecdn.com/lectw2152-ratelawsalg-110506165719-phpapp02/85/Lect-w2-152-rate-laws_alg-11-320.jpg)
![What is the effect on the rate if the concentration of A is doubled? No change x2 x4 x8 x16 Rate = k [A][B] 2](https://image.slidesharecdn.com/lectw2152-ratelawsalg-110506165719-phpapp02/85/Lect-w2-152-rate-laws_alg-12-320.jpg)
![What is the effect on the rate if the concentrations of A, B & C are all doubled? No change x2 x4 x8 x16 Rate = k [A][B] 2](https://image.slidesharecdn.com/lectw2152-ratelawsalg-110506165719-phpapp02/85/Lect-w2-152-rate-laws_alg-13-320.jpg)
![Rate Laws In general, for a A + b B x X with a catalyst C Rate = k [A] m [B] n [C] p The exponents m, n, and p are the reaction order with respect each reactant Overall reaction order= m + n + p These numbers can be 0, 1, 2 or fractions and must be determined by experiment ! They are NOT related to the stoichiometric coefficients a,b,x](https://image.slidesharecdn.com/lectw2152-ratelawsalg-110506165719-phpapp02/85/Lect-w2-152-rate-laws_alg-16-320.jpg)

![Determining Reaction Orders Using Initial Rates Compare 2 experiments in which the concentration of one reactant varies and the concentration of the other reactant(s) remains constant. k [O 2 ] 2 m [NO] 2 n k [O 2 ] 1 m [NO] 1 n = = [O 2 ] 2 m [O 2 ] 1 m = 6.40x10 -3 mol/L*s 3.21x10 -3 mol/L*s = ; 2 = 2 m m = 1 Do a similar calculation for the other reactant(s). Run a series of experiments, each of which starts with a different set of reactant concentrations, and from each obtain an initial rate. O 2 ( g ) + 2NO( g ) 2NO 2 ( g ) rate = k [O 2 ] m [NO] n rate 2 rate 1 [O 2 ] 2 [O 2 ] 1 m 1.10x10 -2 mol/L 2.20x10 -2 mol/L m](https://image.slidesharecdn.com/lectw2152-ratelawsalg-110506165719-phpapp02/85/Lect-w2-152-rate-laws_alg-18-320.jpg)
![Expected Solution : Another Example Consider this reaction inside a car engine: How can we use this data to determine the rate law and the rate orders with respect to each reactant? rate = k [NO 2 ] m [CO] n Exp. Initial Rate (mol/L*s) Initial [NO 2 ] Initial [CO] 1 2 3 0.0050 0.080 0.0050 0.10 0.10 0.40 0.10 0.10 0.20](https://image.slidesharecdn.com/lectw2152-ratelawsalg-110506165719-phpapp02/85/Lect-w2-152-rate-laws_alg-20-320.jpg)
![16 = 4 m and m = 2 The reaction is 2 nd order in NO 2 . First, choose two experiments in which [CO] remains constant and the [NO 2 ] varies . One Variable at a Time 0.080 0.0050 rate 2 rate 1 [NO 2 ] 2 [NO 2 ] 1 m = k [NO 2 ] m 2 [CO] n 2 k [NO 2 ] m 1 [CO] n 1 = 0.40 0.10 = m Exp. Initial Rate (mol/L*s) Initial [NO 2 ] Initial [CO] 1 2 3 0.0050 0.080 0.0050 0.10 0.10 0.40 0.10 0.10 0.20](https://image.slidesharecdn.com/lectw2152-ratelawsalg-110506165719-phpapp02/85/Lect-w2-152-rate-laws_alg-21-320.jpg)
![Now, choose two experiments in which [NO 2 ] remains constant and the [CO] varies. One Variable at a Time The reaction is zero order in CO . rate = k [NO 2 ] 2 [CO] 0 = k [NO 2 ] 2 Overall order Exp. Initial Rate (mol/L*s) Initial [NO 2 ] Initial [CO] 1 2 3 0.0050 0.080 0.0050 0.10 0.10 0.40 0.10 0.10 0.20 k [NO 2 ] m 3 [CO] n 3 k [NO 2 ] m 1 [CO] n 1 [CO] 3 [CO] 1 n = rate 3 rate 1 = 0.0050 0.0050 = 0.20 0.10 n ; 1 = 2 n and n = 0](https://image.slidesharecdn.com/lectw2152-ratelawsalg-110506165719-phpapp02/85/Lect-w2-152-rate-laws_alg-22-320.jpg)
![Your Turn rate = k [NO 2 ] 2 What is the value of the constant, k, in this reaction? Exp. Initial Rate (mol/L*s) Initial [NO 2 ] Initial [CO] 1 2 3 0.0050 0.080 0.0050 0.10 0.10 0.40 0.10 0.10 0.20](https://image.slidesharecdn.com/lectw2152-ratelawsalg-110506165719-phpapp02/85/Lect-w2-152-rate-laws_alg-23-320.jpg)
![Concentration-Time Relations Consider a FIRST ORDER REACTION: A B The rate law is Rate= k[A] RATE= -d[A]/dt = k[A] How can we predict the concentration of reactants at any moment in time? How do you find [A] = f(t) ?](https://image.slidesharecdn.com/lectw2152-ratelawsalg-110506165719-phpapp02/85/Lect-w2-152-rate-laws_alg-26-320.jpg)
![Integrating - (d[A]/d t) = k [A], we get [A] / [A] 0 =fraction remaining after time t has elapsed. Called the integrated first-order rate law Integrated Rate Laws](https://image.slidesharecdn.com/lectw2152-ratelawsalg-110506165719-phpapp02/85/Lect-w2-152-rate-laws_alg-28-320.jpg)
![Plot the experimental ln[A] vs. time If the graph is linear, the reaction is first-order. The slope of this line = -k y = mx + b First-Order Rate Law ln [A] = - k t + ln [A] 0](https://image.slidesharecdn.com/lectw2152-ratelawsalg-110506165719-phpapp02/85/Lect-w2-152-rate-laws_alg-30-320.jpg)
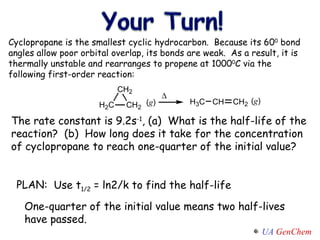
![First-Order Reactions The half-life , t ½ , is the time required for the concentration of a reactant to decrease to half of its initial concentration. t ½ = t when [A] = [A] 0 /2 = 1200 s = 20 minutes How do you know decomposition is first order? units of k (s -1 ) ln [A] 0 [A] 0 /2 k = t ½ ln2 k = 0.693 k = What is the half-life of N 2 O 5 if it decomposes with a rate constant of 5.7 x 10 -4 s -1 ? t ½ ln2 k = 0.693 5.7 x 10 -4 s -1 =](https://image.slidesharecdn.com/lectw2152-ratelawsalg-110506165719-phpapp02/85/Lect-w2-152-rate-laws_alg-33-320.jpg)
![A plot of [N 2 O 5 ] vs. time for three half-lives](https://image.slidesharecdn.com/lectw2152-ratelawsalg-110506165719-phpapp02/85/Lect-w2-152-rate-laws_alg-34-320.jpg)
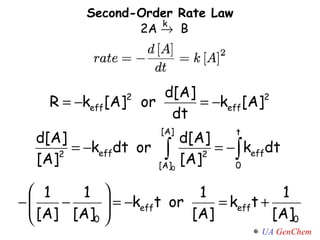
![Plot the experimental 1/[A] vs. time If the graph is linear, the reaction is second-order. The rate constant is k = slope Second-Order Rate Law y = mx + b](https://image.slidesharecdn.com/lectw2152-ratelawsalg-110506165719-phpapp02/85/Lect-w2-152-rate-laws_alg-36-320.jpg)
![Zero-Order Reactions rate = k [A] 0 = k k = = M /s [A] is the concentration of A at any time t [A] 0 is the concentration of A at time t =0 t ½ = t when [A] = [A] 0 /2 [A] = [A] 0 - kt A product rate = - D[A] D t rate [A] 0 D[A] D t = k - t ½ = [A] 0 2 k](https://image.slidesharecdn.com/lectw2152-ratelawsalg-110506165719-phpapp02/85/Lect-w2-152-rate-laws_alg-38-320.jpg)
![Summary ln[A] t = -kt + ln[A] 0 1/[A] t = kt + 1/[A] 0 [A] t = -kt + [A] 0](https://image.slidesharecdn.com/lectw2152-ratelawsalg-110506165719-phpapp02/85/Lect-w2-152-rate-laws_alg-40-320.jpg)
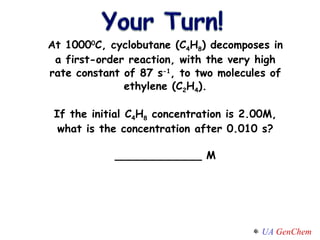
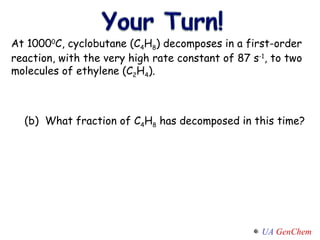
![SOLUTION: [C 4 H 8 ] = 0.84 mol/L = 0.58 ln 2.00 [C 4 H 8 ] = -(87s -1 ) (0.010s) ln [C 4 H 8 ] 0 [C 4 H 8 ] t = - k t (a) (b) [C 4 H 8 ] 0 - [C 4 H 8 ] t [C 4 H 8 ] 0 = 2.00M - 0.84M 2.00M](https://image.slidesharecdn.com/lectw2152-ratelawsalg-110506165719-phpapp02/85/Lect-w2-152-rate-laws_alg-43-320.jpg)
![0 th Order 1 st Order 2 nd Order Plot for straight line Slope, y-intercept Half-life Rate law rate = k rate = k [A] rate = k [A] 2 Units for k mol/(L*s) 1/s L/(mol*s) Int. rate law (straight-line form) [A] t = -k t + [A] 0 ln[A] t = - k t + ln[A] 0 1/[A] t = k t + 1/[A] 0 [A] t vs. t ln[A] t vs. t 1/[A] t vs t -k, [A] 0 -k, ln[A] 0 k, 1/[A] 0 [A] 0 /(2 k) (ln 2)/ k 1/( k [A] 0 ) Overview](https://image.slidesharecdn.com/lectw2152-ratelawsalg-110506165719-phpapp02/85/Lect-w2-152-rate-laws_alg-46-320.jpg)
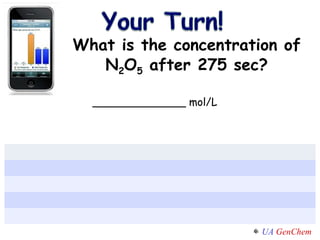
![Summary Activity: N 2 O 5 (g) NO 3 (g) + NO 2 (g) Consider the following graphs and reaction data to predict the concentration of N 2 O 5 at 275 sec. Time (s) [N 2 O 5 ] 0 1.000 25 0.822 50 0.677 75 0.557 100 0.458 125 0.377 150 0.310 175 0.255 200 0.210](https://image.slidesharecdn.com/lectw2152-ratelawsalg-110506165719-phpapp02/85/Lect-w2-152-rate-laws_alg-47-320.jpg)


![Getting Started with Apache Spark: Big Data Made Simple [Free Meetup]](https://cdn.slidesharecdn.com/ss_thumbnails/apachesparkgettingstarted-260203175547-8361bcc3-thumbnail.jpg?width=640&height=640&fit=bounds)

