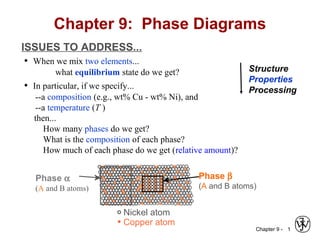
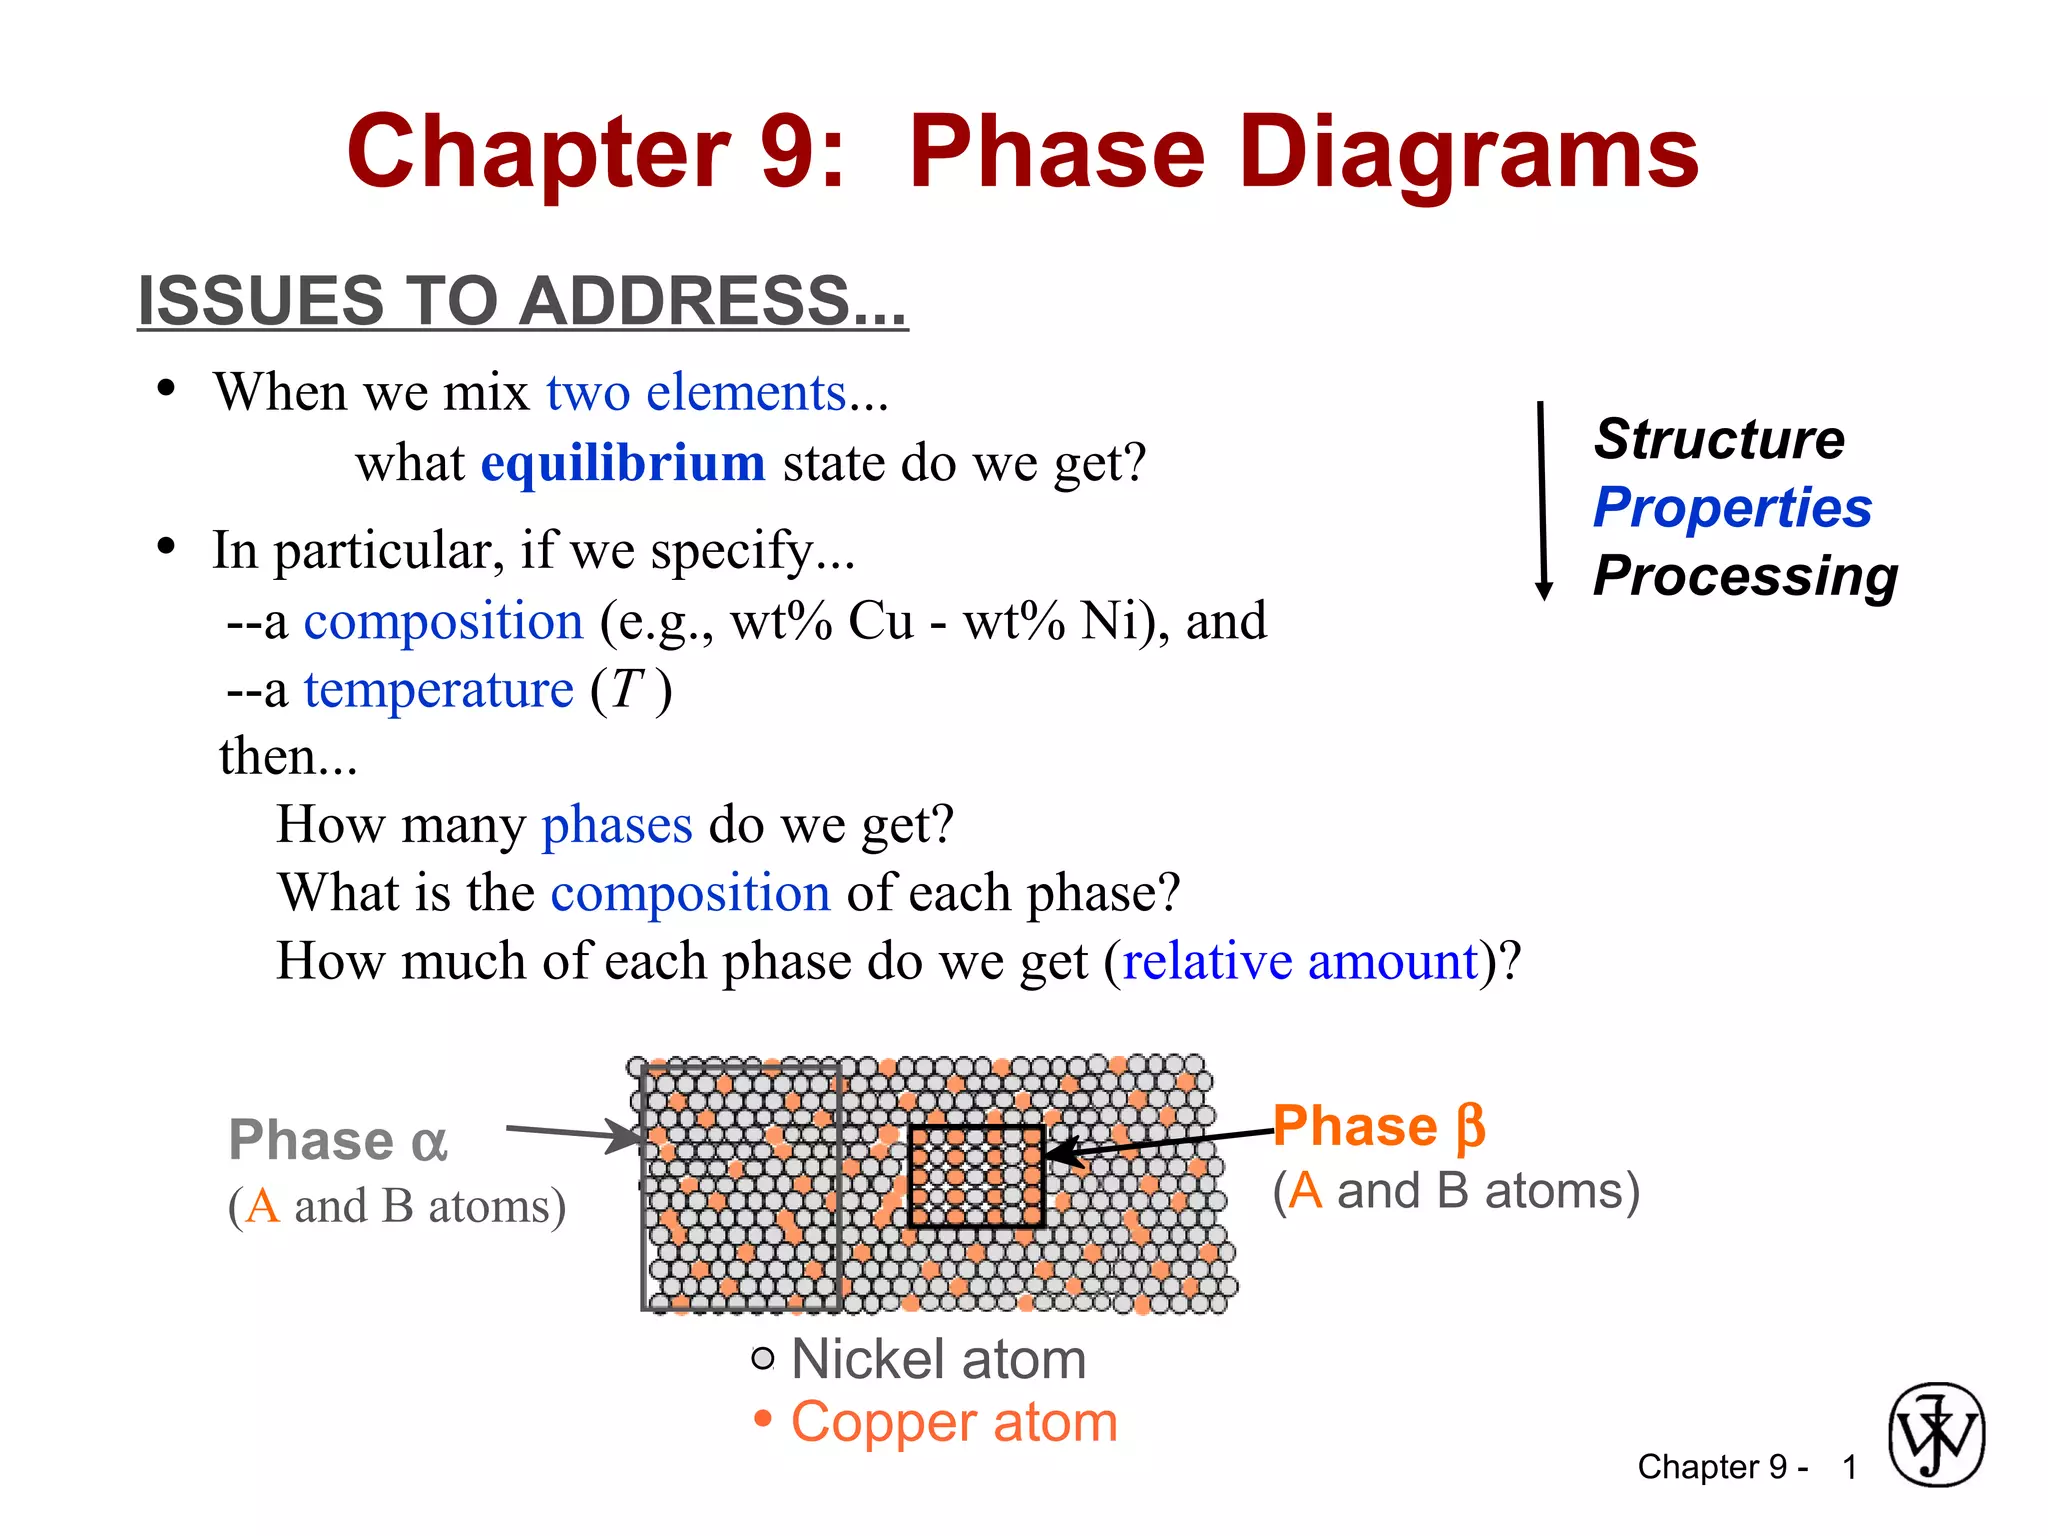
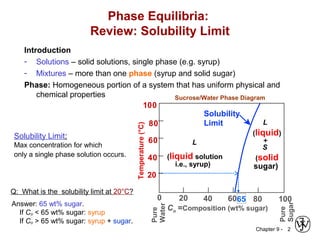
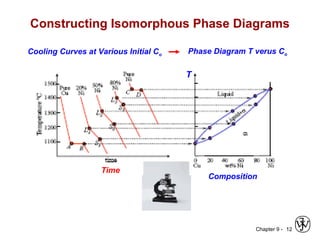
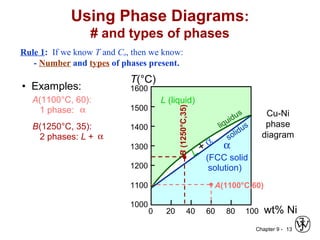
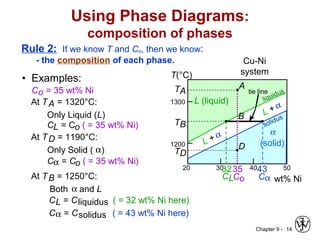
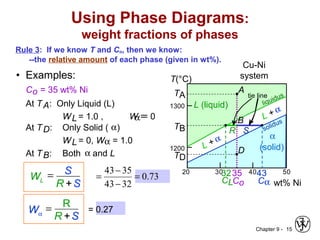
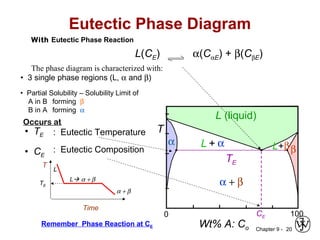
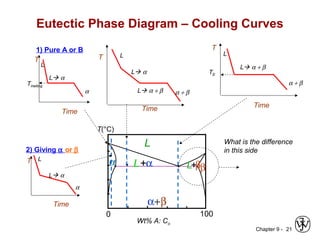
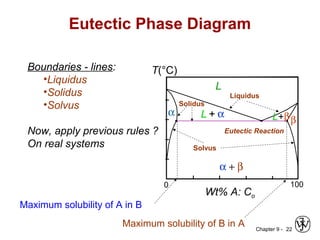
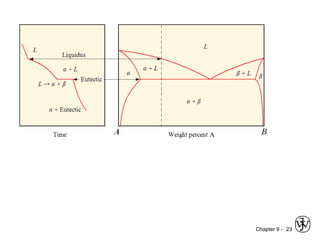
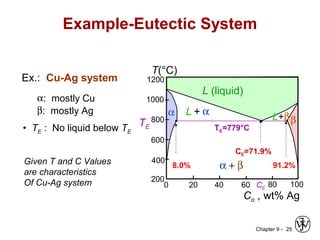
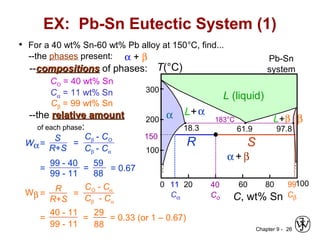
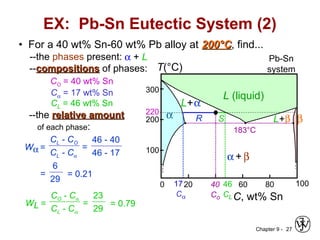
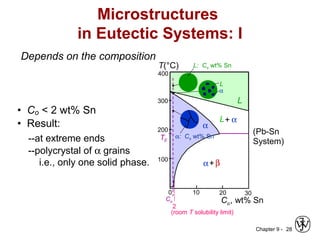
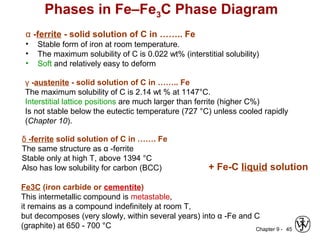
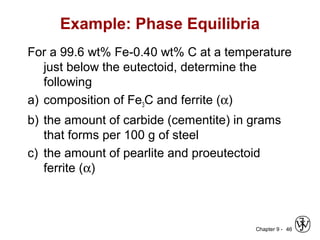
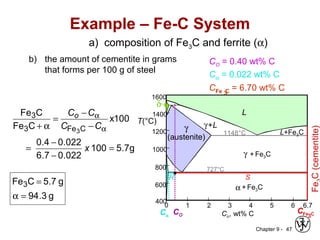
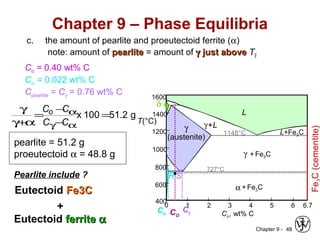
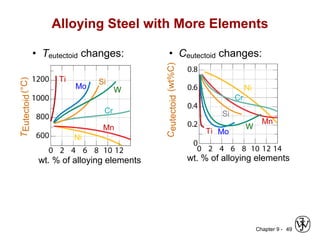
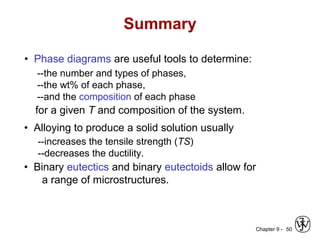
Chapter 9 - 1
ISSUES TO ADDRESS...
• When we mix two elements...
what equilibrium state do we get?
• In particular, if we specify...
--a composition (e.g., wt% Cu - wt% Ni), and
--a temperature (T )
then...
How many phases do we get?
What is the composition of each phase?
How much of each phase do we get (relative amount)?
Chapter 9: Phase Diagrams
Phase β
(A and B atoms)
Phase α
(A and B atoms)
Nickel atom
Copper atom
Structure
Properties
Processing
Chapter 9 - 2
Phase Equilibria:
Review: Solubility Limit
Introduction
- Solutions – solid solutions, single phase (e.g. syrup)
- Mixtures – more than one phase (syrup and solid sugar)
Phase: Homogeneous portion of a system that has uniform physical and
chemical properties
Solubility Limit:
Max concentration for which
only a single phase solution occurs.
Q: What is the solubility limit at 20°C?
Answer: 65 wt% sugar.
If Co < 65 wt% sugar: syrup
If Co > 65 wt% sugar: syrup + sugar.
65
Sucrose/Water Phase Diagram
Pure
Sugar
Temperature(°C)
0 20 40 60 80 100
Co =Composition (wt% sugar)
L
(liquid solution
i.e., syrup)
Solubility
Limit L
(liquid)
+
S
(solid
sugar)
20
40
60
80
100
Pure
Water
Chapter 9 - 3
• Components:
The elements or compounds which are present in the mixture (e.g., Al and Cu)
• Phases:
The physically and chemically distinct material regions that result (e.g., α and β).
•Equilibrium
No change with time – fixed composition for each component
Al-Cu Alloy
Components and Phases
α (darker phase)
Includes Al and Cu
β (lighter phase)
Includes Al and Cu
Two phases
Two Components
Chapter 9 - 4
Effect of T & Composition (Co)
• Changing T can change # of phases:
D (100°C,90)
2 phases
B (100°C,70)
1 phase
path A to B.
• Changing Co can change # of phases: path B to D.
A (20°C,70)
2 phases
70 80 1006040200
Temperature(°C)
Co =Composition (wt% sugar)
L
(liquid solution
i.e., syrup)
20
100
40
60
80
0
L
(liquid)
+
S
(solid
sugar)
water-
sugar
system
Chapter 9 - 5
Phase Diagrams
Types of phase diagrams depend on Solubility
• Isomorphous phase diagram (complete solubility)
• Eutectic phase diagram (partial solubility)
• Complex phase diagram (…….)
How to obtain phase diagrams ?
- From cooling curves for various starting solutions
(Thermal method)
• Thermodynamics: Phase Diagrams Indicate phases as function of T, Co, and P.
• For this course:
-binary systems: just 2 components.
-independent variables: T and Co (P = 1 atm is almost always used).
Phase Diagram:
A Plot of T versus C indicating various boundaries between phases
T
Time
?
Phase Change
T
composition
Uses of Phase Diagrams:
- No. of phases
- Composition of each phase
- Relative amount of each phase
+ Predict the microstructure
Chapter 9 - 6
Phase Equilibria - Solutions
Crystal
Structure
electroneg r (nm)
Ni FCC 1.9 0.1246
Cu FCC 1.8 0.1278
Both metals have
•Nearly the same atomic radius
•The same crystal structure (FCC)
•similar electronegativities
(W. Hume – Rothery rules) suggesting high mutual solubility.
Simple Solution System (e.g., Ni-Cu solution)
Remember
Ni and Cu are totally miscible (soluble) in all proportions (compositions).
ONE PHASE ALWAYS – Isomorphous !
Chapter 9 - 7
Phase Diagrams- Metals
• 2 phases:
L (liquid)
α (FCC solid solution)
• 3 phase fields:
L
L + α
α
Phase Diagram for Cu-Ni system
20 40 60 80 1000 wt% Ni
1000
1100
1200
1300
1400
1500
1600
T(°C)
L (liquid)
α
(FCC solid Soln)
L +αLiquidus line
Solidus line
Isomorphous Phase Diagram
Complete solubility - one phase field extends from 0 to 100 wt% Ni.
Chapter 9 - 8
Phase Change
• Phase boundary:
Lines between different phases e.g.
– Liquid
– solid
• one phase
• two phases …etc)
• Phase Change:
– Solidification (or melting)
– Phase Reaction: one phase gives DIRECTLY two phases
e.g.
Liquid  Solid phase 1 + Solid Phase 2 (both insoluble)
• This occurs at
– Certain (fixed) temperature: TE
– Certain (fixed) composition: CE
• Eutectic Phase Reaction:
L α + β
• There are other types of phase reactions (Later)
Chapter 9 - 9
Cooling Curves
There are various types of cooling curves:
Depending on composition (characteristics)
1. Pure Element
2. Mixture of soluble 2 elements
3. Mixture of Partially Soluble 2 elements
4. Mixtures undergoing Phase Reactions
1. At the composition for phase reaction
2. Before the composition for phase reaction
Chapter 9 - 10
Types of Cooling Curves
2) Mixture of soluble 2 elements
Time
L
L α
α
T
3) Phase Reaction at CE 3) Phase Reaction: Co > CE
Time
L
L α + β α + β
T
L α
T
Time
L
L α (A or B)
α
1) Pure Element
Tmelting
Time
L
L α + β
α + β
T
TE
Chapter 9 - 11
Constructing Phase Diagrams
Thermal Method
• Start with several different solutions
• Each solution at certain co
• Prepare the solutions in liquid form (melting)
• Cool each solution while recording T versus time
• Plot the cooling curve for each solution
• At each phase change: there are changes in the slope
– Latent Heat
– Change in the properties (specific heat)
– Phase reaction (later)
• Project cooling curves on T versus co plot.
• Connect the points from projection creating boundaries.
• Label different obtained areas and boundaries.
Chapter 9 - 12
Constructing Isomorphous Phase Diagrams
Cooling Curves at Various Initial Co Phase Diagram T verus Co
T
Composition
Time
Chapter 9 - 13
wt% Ni20 40 60 80 1000
1000
1100
1200
1300
1400
1500
1600
T(°C)
L (liquid)
α
(FCC solid
solution)
L
+ α
liquidus
solidus
Cu-Ni
phase
diagram
Using Phase Diagrams:
# and types of phases
Rule 1: If we know T and Co, then we know:
- Number and types of phases present.
• Examples:
A(1100°C, 60):
1 phase: α
B(1250°C, 35):
2 phases: L + α
B(1250°C,35) A(1100°C,60)
Chapter 9 - 14
wt% Ni
20
1200
1300
T(°C)
L (liquid)
α
(solid)L +α
liquidus
solidus
30 40 50
L +α
Cu-Ni
system
Using Phase Diagrams:
composition of phases
Rule 2: If we know T and Co, then we know:
- the composition of each phase.
• Examples:
TA
A
35
Co
32
CL
At TA = 1320°C:
Only Liquid (L)
CL = Co ( = 35 wt% Ni)
At TB = 1250°C:
Both α and L
CL = Cliquidus ( = 32 wt% Ni here)
Cα = Csolidus ( = 43 wt% Ni here)
At TD = 1190°C:
Only Solid ( α)
Cα = Co ( = 35 wt% Ni)
Co = 35 wt% Ni
B
TB
D
TD
tie line
4
Cα
3
Chapter 9 - 15
Rule 3: If we know T and Co, then we know:
--the relative amount of each phase (given in wt%).
• Examples:
At TA: Only Liquid (L)
WL = 1.0 , W =α = 0
At TD: Only Solid ( α)
WL = 0, Wα = 1.0
Co = 35 wt% Ni
Using Phase Diagrams:
weight fractions of phases
wt% Ni
20
1200
1300
T(°C)
L (liquid)
α
(solid)L +α
liquidus
solidus
30 40 50
L +α
Cu-Ni
system
TA
A
35
Co
32
CL
B
TB
D
TD
tie line
4
Cα
3
R S
At TB: Both α and L
73.0
3243
3543
=
−
−
=
= 0.27
WL
= S
R +S
Wα
= R
R +S
Chapter 9 - 16
• Tie line – connects the phases in equilibrium with
each other - essentially an isotherm
The Lever Rule
How much of each phase?
ThinkThink of it as a lever (teeter-totter)
ML
Mα
R S
RMSM L ⋅=⋅α
L
L
LL
L
L
CC
CC
SR
R
W
CC
CC
SR
S
MM
M
W
−
−
=
+
=
−
−
=
+
=
+
=
α
α
α
α
α
00
wt% Ni
20
1200
1300
T(°C)
L (liquid)
α
(solid)L +α
liquidus
solidus
30 40 50
L +α
B
TB
tie line
CoCL Cα
SR
Chapter 9 - 17
wt% Ni
20
1200
1300
30 40 50
1100
L (liquid)
α
(solid)
L +
α
L +
α
T(°C)
A
35
Co
L: 35wt%Ni
Cu-Ni
system
Observe the microstructure
while going down (cooling)
at the same composition.
• Consider
Co = 35 wt%Ni.
Microstructure - Cooling in a Cu-Ni Binary
4635
43
32
α: 43 wt% Ni
L: 32 wt% Ni
L: 24 wt% Ni
α: 36 wt% Ni
Bα: 46 wt% Ni
L: 35 wt% Ni
C
D
E
24 36
Chapter 9 - 18
• Cα changes as we solidify.
• Cu-Ni case:
• Fast rate of cooling:
Cored structure
• Slow rate of cooling:
Equilibrium structure
First α to solidify has Cα = 46 wt% Ni.
Last α to solidify has Cα = 35 wt% Ni.
Cored vs Equilibrium Phases
First α to solidify:
46 wt% Ni
Uniform Cα:
35 wt% Ni
Last α to solidify:
< 35 wt% Ni
Chapter 9 - 19
Mechanical Properties: Cu-Ni System
• Effect of solid solution strengthening on:
--Tensile strength (TS)
- Peak as a function of Co
TensileStrength(MPa)
Composition, wt% Ni
Cu Ni
0 20 40 60 80 100
200
300
400
TS for
pure Ni
TS for pure Cu
--Ductility (%EL,%AR)
- Min. as a function of Co
Elongation(%EL) Composition, wt% Ni
Cu Ni
0 20 40 60 80 100
20
30
40
50
60
%EL for
pure Ni
%EL for pure Cu
Chapter 9 - 20
Eutectic Phase Diagram
With Eutectic Phase Reaction
L(CE) α(CαE) + β(CβE)
The phase diagram is characterized with:
• 3 single phase regions (L, α and β)
• Partial Solubility – Solubility Limit of
A in B forming β
B in A forming α
Occurs at
L (liquid)
α L + α L+ββ
α + β
Wt% A: Co
1000
T
CE
TE
: Eutectic Composition• CE
• TE : Eutectic Temperature
Remember Phase Reaction at CE
Time
L
L α + β
α + β
T
TE
Chapter 9 - 21
Eutectic Phase Diagram – Cooling Curves
L
α L+α L+ββ
α+β
Wt% A: Co
1000
T(°C)
T
Time
L
L α
α
1) Pure A or B
Tmelting
2) Giving α or β
Time
L
L α
α
T
Time
L
L α + β α + β
T
L α
Time
L
L α + β
α + β
T
TE
What is the difference
in this side
Chapter 9 - 22
Maximum solubility of A in B
L
α L + α L+ββ
α + β
Wt% A: Co
1000
T(°C)
Liquidus
Solidus
Solvus
Eutectic Reaction
Eutectic Phase Diagram
Maximum solubility of B in A
Boundaries - lines:
•Liquidus
•Solidus
•Solvus
Now, apply previous rules ?
On real systems
Chapter 9 - 23
Chapter 9 - 24
Chapter 9 - 25
Example-Eutectic System
α: mostly Cu
β: mostly Ag
• TE : No liquid below TE
Ex.: Cu-Ag system
L (liquid)
α L + α
L+ββ
α + β
Co , wt% Ag
20 40 60 80 1000
200
1200
T(°C)
400
600
800
1000
CE
TE
8.0%
CE=71.9%
91.2%
TE=779°C
Given T and C Values
are characteristics
Of Cu-Ag system
Chapter 9 - 26
L+α
L+β
α + β
200
T(°C)
18.3
C, wt% Sn
20 60 80 1000
300
100
L (liquid)
α 183°C
61.9 97.8
β
• For a 40 wt% Sn-60 wt% Pb alloy at 150°C, find...
--the phases present: Pb-Sn
system
EX: Pb-Sn Eutectic System (1)
α + β
--compositionscompositions of phases:
CO = 40 wt% Sn
--the relative amountrelative amount
of each phase:
150
40
Co
11
Cα
99
Cβ
SR
Cα = 11 wt% Sn
Cβ = 99 wt% Sn
Wα=
Cβ - CO
Cβ - Cα
=
99 - 40
99 - 11
=
59
88
= 0.67
S
R+S
=
Wβ =
CO - Cα
Cβ - Cα
=
R
R+S
=
29
88
= 0.33 (or 1 – 0.67)=
40 - 11
99 - 11
Chapter 9 - 27
L+β
α + β
200
T(°C)
C, wt% Sn
20 60 80 1000
300
100
L (liquid)
α β
L+α
183°C
• For a 40 wt% Sn-60 wt% Pb alloy at 200200°°CC, find...
--the phases present: Pb-Sn
system
EX: Pb-Sn Eutectic System (2)
α + L
--compositionscompositions of phases:
CO = 40 wt% Sn
--the relative amountrelative amount
of each phase:
Wα =
CL - CO
CL - Cα
=
46 - 40
46 - 17
=
6
29
= 0.21
WL =
CO - Cα
CL - Cα
=
23
29
= 0.79
40
Co
46
CL
17
Cα
220
SR
Cα = 17 wt% Sn
CL = 46 wt% Sn
Chapter 9 - 28
• Co < 2 wt% Sn
• Result:
--at extreme ends
--polycrystal of α grains
i.e., only one solid phase.
Microstructures
in Eutectic Systems: I
0
L+ α
200
T(°C)
Co, wt% Sn
10
2
20
Co
300
100
L
α
30
α+β
400
(room T solubility limit)
TE
(Pb-Sn
System)
α
L
L: Co wt% Sn
α: Co wt% Sn
Depends on the composition
Chapter 9 - 29
• 2 wt% Sn < Co < 18.3 wt% Sn
• Result:
 Initially liquid + α
 then α alone
 finally two phases
 α polycrystal
 fine β-phase inclusions
Microstructures
in Eutectic Systems: II
Pb-Sn
system
L + α
200
T(°C)
Co , wt% Sn
10
18.3
200
Co
300
100
L
α
30
α+ β
400
(sol. limit at TE)
TE
2
(sol. limit at Troom)
L
α
L: Co wt% Sn
α
β
α: Co wt% Sn
Chapter 9 - 30
• Co = CE
• Result: Eutectic microstructure (lamellar structure)
--alternating layers (lamellae) of α and β crystals.
Microstructures
in Eutectic Systems: III
160µm
Micrograph of Pb-Sn
eutectic
microstructure
Pb-Sn
system
L+β
α + β
200
T(°C)
C, wt% Sn
20 60 80 1000
300
100
L
α β
L+α
183°C
40
TE
18.3
α: 18.3 wt%Sn
97.8
β: 97.8 wt% Sn
CE
61.9
L: Co wt% Sn
Chapter 9 - 31
Lamellar Eutectic Structure
Chapter 9 - 32
• 18.3 wt% Sn < Co < 61.9 wt% Sn
• Result: α crystals and a eutectic microstructure
Microstructures
in Eutectic Systems: IV
18.3 61.9
SR
97.8
SR
primary α
eutectic α
eutectic β
Pb-Sn
system
L+β200
T(°C)
Co, wt% Sn
20 60 80 1000
300
100
L
α β
L+α
40
α+β
TE
L: Co wt% Sn Lα
L
α
Chapter 9 - 33
• 18.3 wt% Sn < Co < 61.9 wt% Sn
• Result: α crystals and a eutectic microstructure
Microstructures
in Eutectic Systems: IV
18.3 61.9
SR
97.8
SR
primary α
eutectic α
eutectic β
WL = (1-Wα) = 0.50
Cα = 18.3 wt% Sn
CL = 61.9 wt% Sn
S
R + S
Wα‘ = = 0.50
• Just above TE :
• Just below TE :
Cα = 18.3 wt% Sn
Cβ = 97.8 wt% Sn
S
R + S
Wα= = 0.73
Wβ = 0.27
Pb-Sn
system
L+β200
T(°C)
Co, wt% Sn
20 60 80 1000
300
100
L
α β
L+α
40
α+β
TE
L: Co wt% Sn Lα
L
α
What is the fraction of
Eutectic α ?
Pro-eutectic (primary) α ?
Chapter 9 - 34
L+α
L+β
α + β
200
Co, wt% Sn20 60 80 1000
300
100
L
α β
TE
40
(Pb-Sn
System)
Hypoeutectic & Hypereutectic
160 µm
eutectic micro-constituent
hypereutectic: (illustration only)
β
β
β
β
β
β
175 µm
α
α
α
α
α
α
hypoeutectic: Co = 50 wt% Sn
T(°C)
61.9
eutectic
eutectic: Co =61.9wt% Sn
Chapter 9 - 35
Intermetallic Compounds
Note: intermetallic compound forms a line - not an area like α ?
Mg2Pb
In Previous Phase diagrams
α and β are terminal solid
solutions
Can we obtain
other intermediate phases ?
Now: Mg2Pb
• is an intermetallic compound
• with a ratio (2:1) (Mg:Pb)-Molar
• melts at a fixed temperature M
• Cooling curve ???
Because stoichiometry (i.e. composition) is exact: Calculate ?
Calculate Wt% Pb = 207 /(207+2(24.3)) X 100 = 81 %
Chapter 9 - 36
Same Story ?
• No. and type of each phase
• Composition of each phase
• Relative amount or fraction of each phase
• Distinguish between
– primary phase
– Eutectic phase
• Microstructure
• Cooling Curves
• Fill the regions with types of phases?
Chapter 9 - 37
Eutectoid & Peritectic Phase Reactions
• Eutectic - liquid in equilibrium with two solids
L α + βcool
heat
intermetallic compound
- cementite
cool
heat
• Eutectoid - solid phase in equilibrium with two solid
phases
S2 S1+S3
γ α + Fe3C (727ºC)
cool
heat
• Peritectic - liquid + solid 1  solid 2 (Fig 9.21)
S1 + L S2
δ + L γ (1493ºC)
Chapter 9 - 38
Complex Phase Diagrams
α and η are terminal solid solutions - β, β’, γ, δ and ε are intermediate solid solutions.
• new phenomena exist: ……… reaction ………. reaction
Chapter 9 - 39
Eutectoid & Peritectic
Cu-Zn Phase diagram
Eutectoid transition δ γ + ε
Peritectic transition γ + L δ
Chapter 9 - 40
Phase Diagram with Eutectoid Phase Reactions
The eutectoid (eutectic-like in Greek) reaction is similar to the eutectic
This phase diagram includes both:
Eutectic ReactionEutectoid Reaction
Our Interest In
Fe-C phase diagram
Chapter 9 - 41
Iron-Carbon (Fe-C) Phase Diagram
• 2 important points
-Eutectoid (B):
γ ⇒ α +Fe3C
-Eutectic (A):
L ⇒ γ +Fe3C
Fe3C(cementite)
1600
1400
1200
1000
800
600
400
0 1 2 3 4 5 6 6.7
L
γ
(austeniteaustenite)
γ+L
γ+Fe3C
α+Fe3C
α+γ
L+Fe3C
δ
(Fe) Co, wt% C
1148°C
T(°C)
α 727°C = Teutectoid
A
SR
4.30
Result: Pearlite =
alternating layers of
α and Fe3C phases
120 µm
γ γ
γγ
R S
0.76
CeutectoidB
Fe3C (cementite-hardhard)
α(ferriteferrite-softsoft)
Chapter 9 - 42
Development of Microstructure in Iron-Carbon alloys
PearlitePearlite Structure
By DiffusionDiffusion
Note: remember the names! Austenite, ferriteferrite, cemetitecemetite and pearlitepearlite
Chapter 9 - 43
Hypoeutectoid Steel
Fe3C(cementite)
1600
1400
1200
1000
800
600
400
0 1 2 3 4 5 6 6.7
L
γ
(austenite)
γ+L
γ + Fe3C
α+ Fe3C
L+Fe3C
δ
(Fe) Co, wt% C
1148°C
T(°C)
α
727°C
(Fe-C
System)
C0
0.76
proeutectoid ferritepearlite
100 µm HypoeutectoidHypoeutectoid
steel
R S
α
wα =S/(R+S)
wFe3C =(1-wα)
wpearlite = wγ
pearlite
r s
wα =s/(r+s)
wγ =(1- wα)
γ
γ γ
γα
α
α
γγ
γ γ
γ γ
γγ
Chapter 9 - 44
Hypereutectoid Steel
Fe3C(cementite)
1600
1400
1200
1000
800
600
400
0 1 2 3 4 5 6 6.7
L
γ
(austenite)
γ+L
γ +Fe3C
α +Fe3C
L+Fe3C
δ
(Fe) Co, wt%C
1148°C
T(°C)
α
(Fe-C
System)
0.76
Co
proeutectoid FeFe33CC
60 µmHypereutectoid
steel
pearlitepearlite
R S
wα =S/(R+S)
wFe3C =(1-wα)
wpearlite = wγ
pearlite
sr
wFe3C =r/(r+s)
wγ =(1-w Fe3C )
Fe3C
γγ
γ γ
γγ
γ γ
γγ
γ γ
Chapter 9 - 45
Phases in Fe–Fe3C Phase Diagram
α -ferrite - solid solution of C in …….. Fe
• Stable form of iron at room temperature.
• The maximum solubility of C is 0.022 wt% (interstitial solubility)
• Soft and relatively easy to deform
+ Fe-C liquid solution
γ -austenite - solid solution of C in …….. Fe
The maximum solubility of C is 2.14 wt % at 1147°C.
Interstitial lattice positions are much larger than ferrite (higher C%)
Is not stable below the eutectic temperature (727 °C) unless cooled rapidly
(Chapter 10).
δ -ferrite solid solution of C in ……. Fe
The same structure as α -ferrite
Stable only at high T, above 1394 °C
Also has low solubility for carbon (BCC)
Fe3C (iron carbide or cementite)
This intermetallic compound is metastable,
it remains as a compound indefinitely at room T,
but decomposes (very slowly, within several years) into α -Fe and C
(graphite) at 650 - 700 °C
Chapter 9 - 46
Example: Phase Equilibria
For a 99.6 wt% Fe-0.40 wt% C at a temperature
just below the eutectoid, determine the
following
a) composition of Fe3C and ferrite (α)
b) the amount of carbide (cementite) in grams
that forms per 100 g of steel
c) the amount of pearlite and proeutectoid
ferrite (α)
Chapter 9 - 47
Example – Fe-C System
g3.94
g5.7CFe
g7.5100
022.07.6
022.04.0
100x
CFe
CFe
3
CFe3
3
3
=α
=
=
−
−
=
−
−
=
α+ α
α
x
CC
CCo
b) the amount of cementite in grams
that forms per 100 g of steel
a) composition of Fe3C and ferrite (α)
CO = 0.40 wt% C
Cα = 0.022 wt% C
CFe C = 6.70 wt% C
3
FeC(cementite)
1600
1400
1200
1000
800
600
400
0 1 2 3 4 5 6 6.7
L
γ
(austenite)
γ+L
γ + Fe3C
α + Fe3C
L+Fe3C
δ
Co, wt% C
1148°C
T(°C)
727°C
CO
R S
CFe C3Cα
Chapter 9 - 48
Chapter 9 – Phase Equilibria
c. the amount of pearlite and proeutectoid ferrite (α)
note: amount of pearlitepearlite = amount of γγ just abovejust above TE
Co = 0.40 wt% C
Cα = 0.022 wt% C
Cpearlite = Cγ = 0.76 wt% C
γ
γ+α
=
Co −Cα
Cγ−Cα
x 100 =51.2 g
pearlite = 51.2 g
proeutectoid α = 48.8 g
FeC(cementite)
1600
1400
1200
1000
800
600
400
0 1 2 3 4 5 6 6.7
L
γ
(austenite)
γ+L
γ + Fe3C
α + Fe3C
L+Fe3C
δ
Co, wt% C
1148°C
T(°C)
727°C
CO
R S
CγCα
Pearlite include ?
Eutectoid Fe3CFe3C
+
Eutectoid ferriteferrite αα
Chapter 9 - 49
Alloying Steel with More Elements
• Teutectoid changes: • Ceutectoid changes:
TEutectoid(°C)
wt. % of alloying elements
Ti
Ni
Mo
Si
W
Cr
Mn
wt. % of alloying elements
Ceutectoid(wt%C)
Ni
Ti
Cr
Si
Mn
W
Mo
Chapter 9 - 50
• Phase diagrams are useful tools to determine:
--the number and types of phases,
--the wt% of each phase,
--and the composition of each phase
for a given T and composition of the system.
• Alloying to produce a solid solution usually
--increases the tensile strength (TS)
--decreases the ductility.
• Binary eutectics and binary eutectoids allow for
a range of microstructures.
Summary

Ch09 m

  • 1.
    Chapter 9 -1 ISSUES TO ADDRESS... • When we mix two elements... what equilibrium state do we get? • In particular, if we specify... --a composition (e.g., wt% Cu - wt% Ni), and --a temperature (T ) then... How many phases do we get? What is the composition of each phase? How much of each phase do we get (relative amount)? Chapter 9: Phase Diagrams Phase β (A and B atoms) Phase α (A and B atoms) Nickel atom Copper atom Structure Properties Processing
  • 2.
    Chapter 9 -2 Phase Equilibria: Review: Solubility Limit Introduction - Solutions – solid solutions, single phase (e.g. syrup) - Mixtures – more than one phase (syrup and solid sugar) Phase: Homogeneous portion of a system that has uniform physical and chemical properties Solubility Limit: Max concentration for which only a single phase solution occurs. Q: What is the solubility limit at 20°C? Answer: 65 wt% sugar. If Co < 65 wt% sugar: syrup If Co > 65 wt% sugar: syrup + sugar. 65 Sucrose/Water Phase Diagram Pure Sugar Temperature(°C) 0 20 40 60 80 100 Co =Composition (wt% sugar) L (liquid solution i.e., syrup) Solubility Limit L (liquid) + S (solid sugar) 20 40 60 80 100 Pure Water
  • 3.
    Chapter 9 -3 • Components: The elements or compounds which are present in the mixture (e.g., Al and Cu) • Phases: The physically and chemically distinct material regions that result (e.g., α and β). •Equilibrium No change with time – fixed composition for each component Al-Cu Alloy Components and Phases α (darker phase) Includes Al and Cu β (lighter phase) Includes Al and Cu Two phases Two Components
  • 4.
    Chapter 9 -4 Effect of T & Composition (Co) • Changing T can change # of phases: D (100°C,90) 2 phases B (100°C,70) 1 phase path A to B. • Changing Co can change # of phases: path B to D. A (20°C,70) 2 phases 70 80 1006040200 Temperature(°C) Co =Composition (wt% sugar) L (liquid solution i.e., syrup) 20 100 40 60 80 0 L (liquid) + S (solid sugar) water- sugar system
  • 5.
    Chapter 9 -5 Phase Diagrams Types of phase diagrams depend on Solubility • Isomorphous phase diagram (complete solubility) • Eutectic phase diagram (partial solubility) • Complex phase diagram (…….) How to obtain phase diagrams ? - From cooling curves for various starting solutions (Thermal method) • Thermodynamics: Phase Diagrams Indicate phases as function of T, Co, and P. • For this course: -binary systems: just 2 components. -independent variables: T and Co (P = 1 atm is almost always used). Phase Diagram: A Plot of T versus C indicating various boundaries between phases T Time ? Phase Change T composition Uses of Phase Diagrams: - No. of phases - Composition of each phase - Relative amount of each phase + Predict the microstructure
  • 6.
    Chapter 9 -6 Phase Equilibria - Solutions Crystal Structure electroneg r (nm) Ni FCC 1.9 0.1246 Cu FCC 1.8 0.1278 Both metals have •Nearly the same atomic radius •The same crystal structure (FCC) •similar electronegativities (W. Hume – Rothery rules) suggesting high mutual solubility. Simple Solution System (e.g., Ni-Cu solution) Remember Ni and Cu are totally miscible (soluble) in all proportions (compositions). ONE PHASE ALWAYS – Isomorphous !
  • 7.
    Chapter 9 -7 Phase Diagrams- Metals • 2 phases: L (liquid) α (FCC solid solution) • 3 phase fields: L L + α α Phase Diagram for Cu-Ni system 20 40 60 80 1000 wt% Ni 1000 1100 1200 1300 1400 1500 1600 T(°C) L (liquid) α (FCC solid Soln) L +αLiquidus line Solidus line Isomorphous Phase Diagram Complete solubility - one phase field extends from 0 to 100 wt% Ni.
  • 8.
    Chapter 9 -8 Phase Change • Phase boundary: Lines between different phases e.g. – Liquid – solid • one phase • two phases …etc) • Phase Change: – Solidification (or melting) – Phase Reaction: one phase gives DIRECTLY two phases e.g. Liquid  Solid phase 1 + Solid Phase 2 (both insoluble) • This occurs at – Certain (fixed) temperature: TE – Certain (fixed) composition: CE • Eutectic Phase Reaction: L α + β • There are other types of phase reactions (Later)
  • 9.
    Chapter 9 -9 Cooling Curves There are various types of cooling curves: Depending on composition (characteristics) 1. Pure Element 2. Mixture of soluble 2 elements 3. Mixture of Partially Soluble 2 elements 4. Mixtures undergoing Phase Reactions 1. At the composition for phase reaction 2. Before the composition for phase reaction
  • 10.
    Chapter 9 -10 Types of Cooling Curves 2) Mixture of soluble 2 elements Time L L α α T 3) Phase Reaction at CE 3) Phase Reaction: Co > CE Time L L α + β α + β T L α T Time L L α (A or B) α 1) Pure Element Tmelting Time L L α + β α + β T TE
  • 11.
    Chapter 9 -11 Constructing Phase Diagrams Thermal Method • Start with several different solutions • Each solution at certain co • Prepare the solutions in liquid form (melting) • Cool each solution while recording T versus time • Plot the cooling curve for each solution • At each phase change: there are changes in the slope – Latent Heat – Change in the properties (specific heat) – Phase reaction (later) • Project cooling curves on T versus co plot. • Connect the points from projection creating boundaries. • Label different obtained areas and boundaries.
  • 12.
    Chapter 9 -12 Constructing Isomorphous Phase Diagrams Cooling Curves at Various Initial Co Phase Diagram T verus Co T Composition Time
  • 13.
    Chapter 9 -13 wt% Ni20 40 60 80 1000 1000 1100 1200 1300 1400 1500 1600 T(°C) L (liquid) α (FCC solid solution) L + α liquidus solidus Cu-Ni phase diagram Using Phase Diagrams: # and types of phases Rule 1: If we know T and Co, then we know: - Number and types of phases present. • Examples: A(1100°C, 60): 1 phase: α B(1250°C, 35): 2 phases: L + α B(1250°C,35) A(1100°C,60)
  • 14.
    Chapter 9 -14 wt% Ni 20 1200 1300 T(°C) L (liquid) α (solid)L +α liquidus solidus 30 40 50 L +α Cu-Ni system Using Phase Diagrams: composition of phases Rule 2: If we know T and Co, then we know: - the composition of each phase. • Examples: TA A 35 Co 32 CL At TA = 1320°C: Only Liquid (L) CL = Co ( = 35 wt% Ni) At TB = 1250°C: Both α and L CL = Cliquidus ( = 32 wt% Ni here) Cα = Csolidus ( = 43 wt% Ni here) At TD = 1190°C: Only Solid ( α) Cα = Co ( = 35 wt% Ni) Co = 35 wt% Ni B TB D TD tie line 4 Cα 3
  • 15.
    Chapter 9 -15 Rule 3: If we know T and Co, then we know: --the relative amount of each phase (given in wt%). • Examples: At TA: Only Liquid (L) WL = 1.0 , W =α = 0 At TD: Only Solid ( α) WL = 0, Wα = 1.0 Co = 35 wt% Ni Using Phase Diagrams: weight fractions of phases wt% Ni 20 1200 1300 T(°C) L (liquid) α (solid)L +α liquidus solidus 30 40 50 L +α Cu-Ni system TA A 35 Co 32 CL B TB D TD tie line 4 Cα 3 R S At TB: Both α and L 73.0 3243 3543 = − − = = 0.27 WL = S R +S Wα = R R +S
  • 16.
    Chapter 9 -16 • Tie line – connects the phases in equilibrium with each other - essentially an isotherm The Lever Rule How much of each phase? ThinkThink of it as a lever (teeter-totter) ML Mα R S RMSM L ⋅=⋅α L L LL L L CC CC SR R W CC CC SR S MM M W − − = + = − − = + = + = α α α α α 00 wt% Ni 20 1200 1300 T(°C) L (liquid) α (solid)L +α liquidus solidus 30 40 50 L +α B TB tie line CoCL Cα SR
  • 17.
    Chapter 9 -17 wt% Ni 20 1200 1300 30 40 50 1100 L (liquid) α (solid) L + α L + α T(°C) A 35 Co L: 35wt%Ni Cu-Ni system Observe the microstructure while going down (cooling) at the same composition. • Consider Co = 35 wt%Ni. Microstructure - Cooling in a Cu-Ni Binary 4635 43 32 α: 43 wt% Ni L: 32 wt% Ni L: 24 wt% Ni α: 36 wt% Ni Bα: 46 wt% Ni L: 35 wt% Ni C D E 24 36
  • 18.
    Chapter 9 -18 • Cα changes as we solidify. • Cu-Ni case: • Fast rate of cooling: Cored structure • Slow rate of cooling: Equilibrium structure First α to solidify has Cα = 46 wt% Ni. Last α to solidify has Cα = 35 wt% Ni. Cored vs Equilibrium Phases First α to solidify: 46 wt% Ni Uniform Cα: 35 wt% Ni Last α to solidify: < 35 wt% Ni
  • 19.
    Chapter 9 -19 Mechanical Properties: Cu-Ni System • Effect of solid solution strengthening on: --Tensile strength (TS) - Peak as a function of Co TensileStrength(MPa) Composition, wt% Ni Cu Ni 0 20 40 60 80 100 200 300 400 TS for pure Ni TS for pure Cu --Ductility (%EL,%AR) - Min. as a function of Co Elongation(%EL) Composition, wt% Ni Cu Ni 0 20 40 60 80 100 20 30 40 50 60 %EL for pure Ni %EL for pure Cu
  • 20.
    Chapter 9 -20 Eutectic Phase Diagram With Eutectic Phase Reaction L(CE) α(CαE) + β(CβE) The phase diagram is characterized with: • 3 single phase regions (L, α and β) • Partial Solubility – Solubility Limit of A in B forming β B in A forming α Occurs at L (liquid) α L + α L+ββ α + β Wt% A: Co 1000 T CE TE : Eutectic Composition• CE • TE : Eutectic Temperature Remember Phase Reaction at CE Time L L α + β α + β T TE
  • 21.
    Chapter 9 -21 Eutectic Phase Diagram – Cooling Curves L α L+α L+ββ α+β Wt% A: Co 1000 T(°C) T Time L L α α 1) Pure A or B Tmelting 2) Giving α or β Time L L α α T Time L L α + β α + β T L α Time L L α + β α + β T TE What is the difference in this side
  • 22.
    Chapter 9 -22 Maximum solubility of A in B L α L + α L+ββ α + β Wt% A: Co 1000 T(°C) Liquidus Solidus Solvus Eutectic Reaction Eutectic Phase Diagram Maximum solubility of B in A Boundaries - lines: •Liquidus •Solidus •Solvus Now, apply previous rules ? On real systems
  • 23.
  • 24.
  • 25.
    Chapter 9 -25 Example-Eutectic System α: mostly Cu β: mostly Ag • TE : No liquid below TE Ex.: Cu-Ag system L (liquid) α L + α L+ββ α + β Co , wt% Ag 20 40 60 80 1000 200 1200 T(°C) 400 600 800 1000 CE TE 8.0% CE=71.9% 91.2% TE=779°C Given T and C Values are characteristics Of Cu-Ag system
  • 26.
    Chapter 9 -26 L+α L+β α + β 200 T(°C) 18.3 C, wt% Sn 20 60 80 1000 300 100 L (liquid) α 183°C 61.9 97.8 β • For a 40 wt% Sn-60 wt% Pb alloy at 150°C, find... --the phases present: Pb-Sn system EX: Pb-Sn Eutectic System (1) α + β --compositionscompositions of phases: CO = 40 wt% Sn --the relative amountrelative amount of each phase: 150 40 Co 11 Cα 99 Cβ SR Cα = 11 wt% Sn Cβ = 99 wt% Sn Wα= Cβ - CO Cβ - Cα = 99 - 40 99 - 11 = 59 88 = 0.67 S R+S = Wβ = CO - Cα Cβ - Cα = R R+S = 29 88 = 0.33 (or 1 – 0.67)= 40 - 11 99 - 11
  • 27.
    Chapter 9 -27 L+β α + β 200 T(°C) C, wt% Sn 20 60 80 1000 300 100 L (liquid) α β L+α 183°C • For a 40 wt% Sn-60 wt% Pb alloy at 200200°°CC, find... --the phases present: Pb-Sn system EX: Pb-Sn Eutectic System (2) α + L --compositionscompositions of phases: CO = 40 wt% Sn --the relative amountrelative amount of each phase: Wα = CL - CO CL - Cα = 46 - 40 46 - 17 = 6 29 = 0.21 WL = CO - Cα CL - Cα = 23 29 = 0.79 40 Co 46 CL 17 Cα 220 SR Cα = 17 wt% Sn CL = 46 wt% Sn
  • 28.
    Chapter 9 -28 • Co < 2 wt% Sn • Result: --at extreme ends --polycrystal of α grains i.e., only one solid phase. Microstructures in Eutectic Systems: I 0 L+ α 200 T(°C) Co, wt% Sn 10 2 20 Co 300 100 L α 30 α+β 400 (room T solubility limit) TE (Pb-Sn System) α L L: Co wt% Sn α: Co wt% Sn Depends on the composition
  • 29.
    Chapter 9 -29 • 2 wt% Sn < Co < 18.3 wt% Sn • Result:  Initially liquid + α  then α alone  finally two phases  α polycrystal  fine β-phase inclusions Microstructures in Eutectic Systems: II Pb-Sn system L + α 200 T(°C) Co , wt% Sn 10 18.3 200 Co 300 100 L α 30 α+ β 400 (sol. limit at TE) TE 2 (sol. limit at Troom) L α L: Co wt% Sn α β α: Co wt% Sn
  • 30.
    Chapter 9 -30 • Co = CE • Result: Eutectic microstructure (lamellar structure) --alternating layers (lamellae) of α and β crystals. Microstructures in Eutectic Systems: III 160µm Micrograph of Pb-Sn eutectic microstructure Pb-Sn system L+β α + β 200 T(°C) C, wt% Sn 20 60 80 1000 300 100 L α β L+α 183°C 40 TE 18.3 α: 18.3 wt%Sn 97.8 β: 97.8 wt% Sn CE 61.9 L: Co wt% Sn
  • 31.
    Chapter 9 -31 Lamellar Eutectic Structure
  • 32.
    Chapter 9 -32 • 18.3 wt% Sn < Co < 61.9 wt% Sn • Result: α crystals and a eutectic microstructure Microstructures in Eutectic Systems: IV 18.3 61.9 SR 97.8 SR primary α eutectic α eutectic β Pb-Sn system L+β200 T(°C) Co, wt% Sn 20 60 80 1000 300 100 L α β L+α 40 α+β TE L: Co wt% Sn Lα L α
  • 33.
    Chapter 9 -33 • 18.3 wt% Sn < Co < 61.9 wt% Sn • Result: α crystals and a eutectic microstructure Microstructures in Eutectic Systems: IV 18.3 61.9 SR 97.8 SR primary α eutectic α eutectic β WL = (1-Wα) = 0.50 Cα = 18.3 wt% Sn CL = 61.9 wt% Sn S R + S Wα‘ = = 0.50 • Just above TE : • Just below TE : Cα = 18.3 wt% Sn Cβ = 97.8 wt% Sn S R + S Wα= = 0.73 Wβ = 0.27 Pb-Sn system L+β200 T(°C) Co, wt% Sn 20 60 80 1000 300 100 L α β L+α 40 α+β TE L: Co wt% Sn Lα L α What is the fraction of Eutectic α ? Pro-eutectic (primary) α ?
  • 34.
    Chapter 9 -34 L+α L+β α + β 200 Co, wt% Sn20 60 80 1000 300 100 L α β TE 40 (Pb-Sn System) Hypoeutectic & Hypereutectic 160 µm eutectic micro-constituent hypereutectic: (illustration only) β β β β β β 175 µm α α α α α α hypoeutectic: Co = 50 wt% Sn T(°C) 61.9 eutectic eutectic: Co =61.9wt% Sn
  • 35.
    Chapter 9 -35 Intermetallic Compounds Note: intermetallic compound forms a line - not an area like α ? Mg2Pb In Previous Phase diagrams α and β are terminal solid solutions Can we obtain other intermediate phases ? Now: Mg2Pb • is an intermetallic compound • with a ratio (2:1) (Mg:Pb)-Molar • melts at a fixed temperature M • Cooling curve ??? Because stoichiometry (i.e. composition) is exact: Calculate ? Calculate Wt% Pb = 207 /(207+2(24.3)) X 100 = 81 %
  • 36.
    Chapter 9 -36 Same Story ? • No. and type of each phase • Composition of each phase • Relative amount or fraction of each phase • Distinguish between – primary phase – Eutectic phase • Microstructure • Cooling Curves • Fill the regions with types of phases?
  • 37.
    Chapter 9 -37 Eutectoid & Peritectic Phase Reactions • Eutectic - liquid in equilibrium with two solids L α + βcool heat intermetallic compound - cementite cool heat • Eutectoid - solid phase in equilibrium with two solid phases S2 S1+S3 γ α + Fe3C (727ºC) cool heat • Peritectic - liquid + solid 1  solid 2 (Fig 9.21) S1 + L S2 δ + L γ (1493ºC)
  • 38.
    Chapter 9 -38 Complex Phase Diagrams α and η are terminal solid solutions - β, β’, γ, δ and ε are intermediate solid solutions. • new phenomena exist: ……… reaction ………. reaction
  • 39.
    Chapter 9 -39 Eutectoid & Peritectic Cu-Zn Phase diagram Eutectoid transition δ γ + ε Peritectic transition γ + L δ
  • 40.
    Chapter 9 -40 Phase Diagram with Eutectoid Phase Reactions The eutectoid (eutectic-like in Greek) reaction is similar to the eutectic This phase diagram includes both: Eutectic ReactionEutectoid Reaction Our Interest In Fe-C phase diagram
  • 41.
    Chapter 9 -41 Iron-Carbon (Fe-C) Phase Diagram • 2 important points -Eutectoid (B): γ ⇒ α +Fe3C -Eutectic (A): L ⇒ γ +Fe3C Fe3C(cementite) 1600 1400 1200 1000 800 600 400 0 1 2 3 4 5 6 6.7 L γ (austeniteaustenite) γ+L γ+Fe3C α+Fe3C α+γ L+Fe3C δ (Fe) Co, wt% C 1148°C T(°C) α 727°C = Teutectoid A SR 4.30 Result: Pearlite = alternating layers of α and Fe3C phases 120 µm γ γ γγ R S 0.76 CeutectoidB Fe3C (cementite-hardhard) α(ferriteferrite-softsoft)
  • 42.
    Chapter 9 -42 Development of Microstructure in Iron-Carbon alloys PearlitePearlite Structure By DiffusionDiffusion Note: remember the names! Austenite, ferriteferrite, cemetitecemetite and pearlitepearlite
  • 43.
    Chapter 9 -43 Hypoeutectoid Steel Fe3C(cementite) 1600 1400 1200 1000 800 600 400 0 1 2 3 4 5 6 6.7 L γ (austenite) γ+L γ + Fe3C α+ Fe3C L+Fe3C δ (Fe) Co, wt% C 1148°C T(°C) α 727°C (Fe-C System) C0 0.76 proeutectoid ferritepearlite 100 µm HypoeutectoidHypoeutectoid steel R S α wα =S/(R+S) wFe3C =(1-wα) wpearlite = wγ pearlite r s wα =s/(r+s) wγ =(1- wα) γ γ γ γα α α γγ γ γ γ γ γγ
  • 44.
    Chapter 9 -44 Hypereutectoid Steel Fe3C(cementite) 1600 1400 1200 1000 800 600 400 0 1 2 3 4 5 6 6.7 L γ (austenite) γ+L γ +Fe3C α +Fe3C L+Fe3C δ (Fe) Co, wt%C 1148°C T(°C) α (Fe-C System) 0.76 Co proeutectoid FeFe33CC 60 µmHypereutectoid steel pearlitepearlite R S wα =S/(R+S) wFe3C =(1-wα) wpearlite = wγ pearlite sr wFe3C =r/(r+s) wγ =(1-w Fe3C ) Fe3C γγ γ γ γγ γ γ γγ γ γ
  • 45.
    Chapter 9 -45 Phases in Fe–Fe3C Phase Diagram α -ferrite - solid solution of C in …….. Fe • Stable form of iron at room temperature. • The maximum solubility of C is 0.022 wt% (interstitial solubility) • Soft and relatively easy to deform + Fe-C liquid solution γ -austenite - solid solution of C in …….. Fe The maximum solubility of C is 2.14 wt % at 1147°C. Interstitial lattice positions are much larger than ferrite (higher C%) Is not stable below the eutectic temperature (727 °C) unless cooled rapidly (Chapter 10). δ -ferrite solid solution of C in ……. Fe The same structure as α -ferrite Stable only at high T, above 1394 °C Also has low solubility for carbon (BCC) Fe3C (iron carbide or cementite) This intermetallic compound is metastable, it remains as a compound indefinitely at room T, but decomposes (very slowly, within several years) into α -Fe and C (graphite) at 650 - 700 °C
  • 46.
    Chapter 9 -46 Example: Phase Equilibria For a 99.6 wt% Fe-0.40 wt% C at a temperature just below the eutectoid, determine the following a) composition of Fe3C and ferrite (α) b) the amount of carbide (cementite) in grams that forms per 100 g of steel c) the amount of pearlite and proeutectoid ferrite (α)
  • 47.
    Chapter 9 -47 Example – Fe-C System g3.94 g5.7CFe g7.5100 022.07.6 022.04.0 100x CFe CFe 3 CFe3 3 3 =α = = − − = − − = α+ α α x CC CCo b) the amount of cementite in grams that forms per 100 g of steel a) composition of Fe3C and ferrite (α) CO = 0.40 wt% C Cα = 0.022 wt% C CFe C = 6.70 wt% C 3 FeC(cementite) 1600 1400 1200 1000 800 600 400 0 1 2 3 4 5 6 6.7 L γ (austenite) γ+L γ + Fe3C α + Fe3C L+Fe3C δ Co, wt% C 1148°C T(°C) 727°C CO R S CFe C3Cα
  • 48.
    Chapter 9 -48 Chapter 9 – Phase Equilibria c. the amount of pearlite and proeutectoid ferrite (α) note: amount of pearlitepearlite = amount of γγ just abovejust above TE Co = 0.40 wt% C Cα = 0.022 wt% C Cpearlite = Cγ = 0.76 wt% C γ γ+α = Co −Cα Cγ−Cα x 100 =51.2 g pearlite = 51.2 g proeutectoid α = 48.8 g FeC(cementite) 1600 1400 1200 1000 800 600 400 0 1 2 3 4 5 6 6.7 L γ (austenite) γ+L γ + Fe3C α + Fe3C L+Fe3C δ Co, wt% C 1148°C T(°C) 727°C CO R S CγCα Pearlite include ? Eutectoid Fe3CFe3C + Eutectoid ferriteferrite αα
  • 49.
    Chapter 9 -49 Alloying Steel with More Elements • Teutectoid changes: • Ceutectoid changes: TEutectoid(°C) wt. % of alloying elements Ti Ni Mo Si W Cr Mn wt. % of alloying elements Ceutectoid(wt%C) Ni Ti Cr Si Mn W Mo
  • 50.
    Chapter 9 -50 • Phase diagrams are useful tools to determine: --the number and types of phases, --the wt% of each phase, --and the composition of each phase for a given T and composition of the system. • Alloying to produce a solid solution usually --increases the tensile strength (TS) --decreases the ductility. • Binary eutectics and binary eutectoids allow for a range of microstructures. Summary