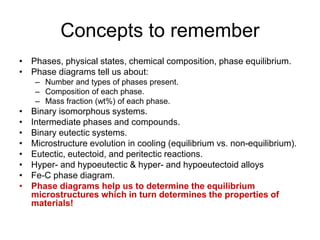
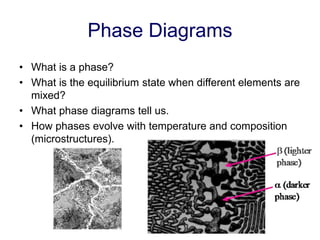
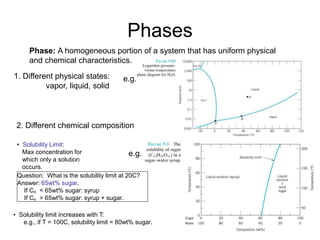
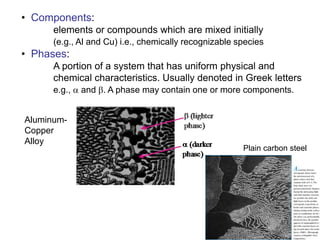
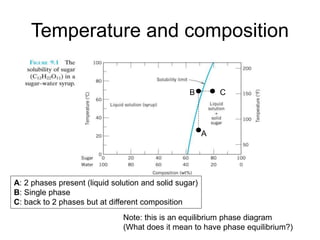
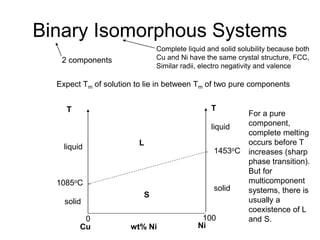
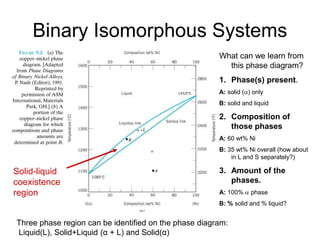
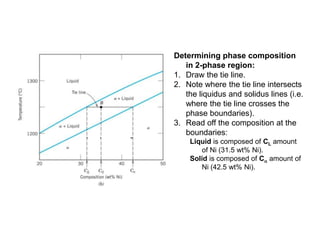
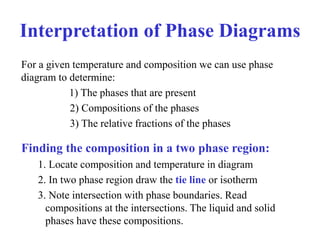
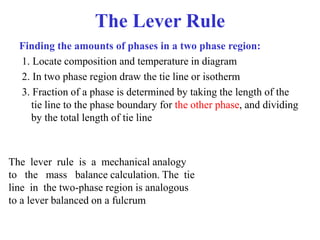
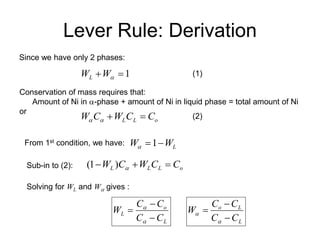
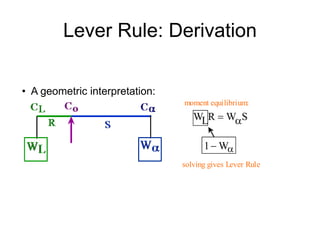
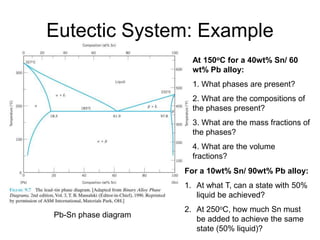
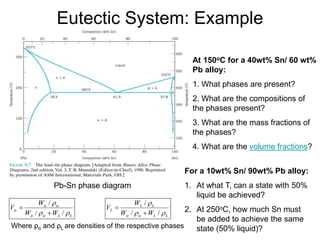
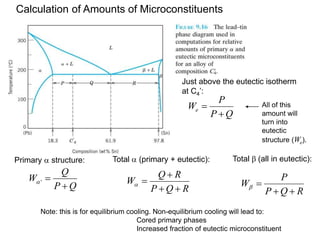
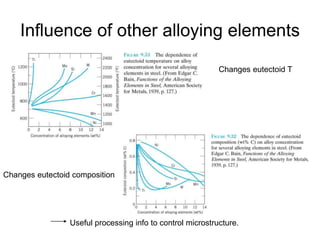
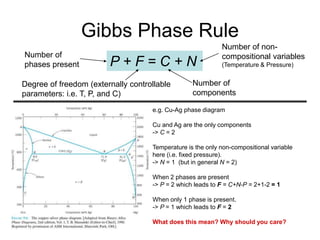
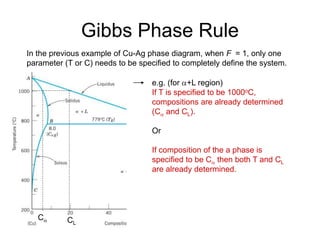
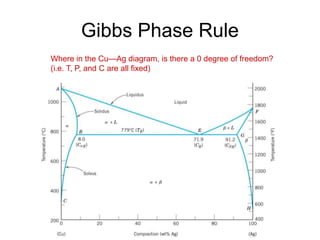
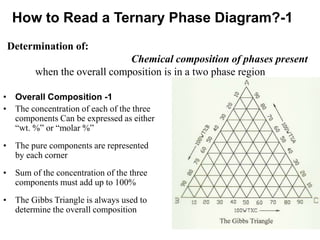
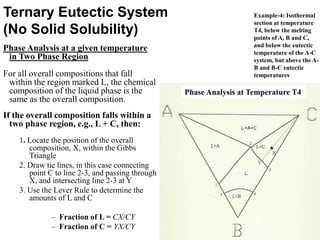
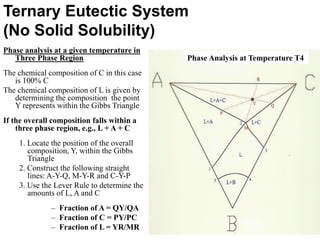
Phase diagrams provide information about the equilibrium phases that exist at different temperatures and compositions for a system. They show the phase transformations that can be expected when temperature or composition is changed. For a binary system, the phase diagram indicates whether single or multiple phases exist at different temperatures and compositions using lines to represent phase boundaries. The lever rule can be used to determine the fractions of each phase in a two-phase region of the diagram by calculating the ratio of distances on a tie line between the overall composition and phase boundaries.


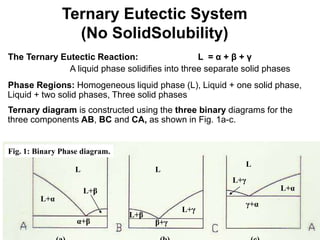

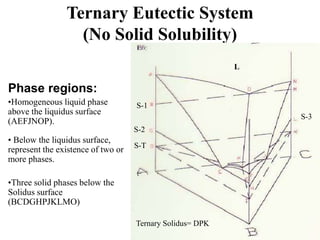


![Ternary Eutectic System
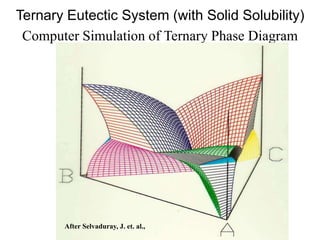
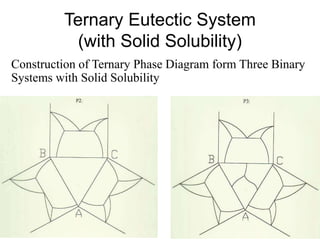
(with Solid Solubility)
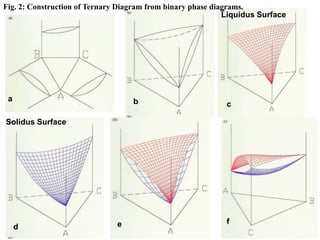
Construction of Ternary Phase Diagram form Three Binary
Systems with Solid Solubility
Main outline of Ternary Phase Diagram with
Ternary Eutectic (Te)
All Liduidus Surfaces
[Red(α+L), Purple(β+L), Green(γ+L)]
Computer Simulation of Liquidus](https://image.slidesharecdn.com/nhphasediagrams-220912142526-66cbf837/85/NH-Phase-Diagrams-ppt-103-320.jpg)