Downloaded 710 times
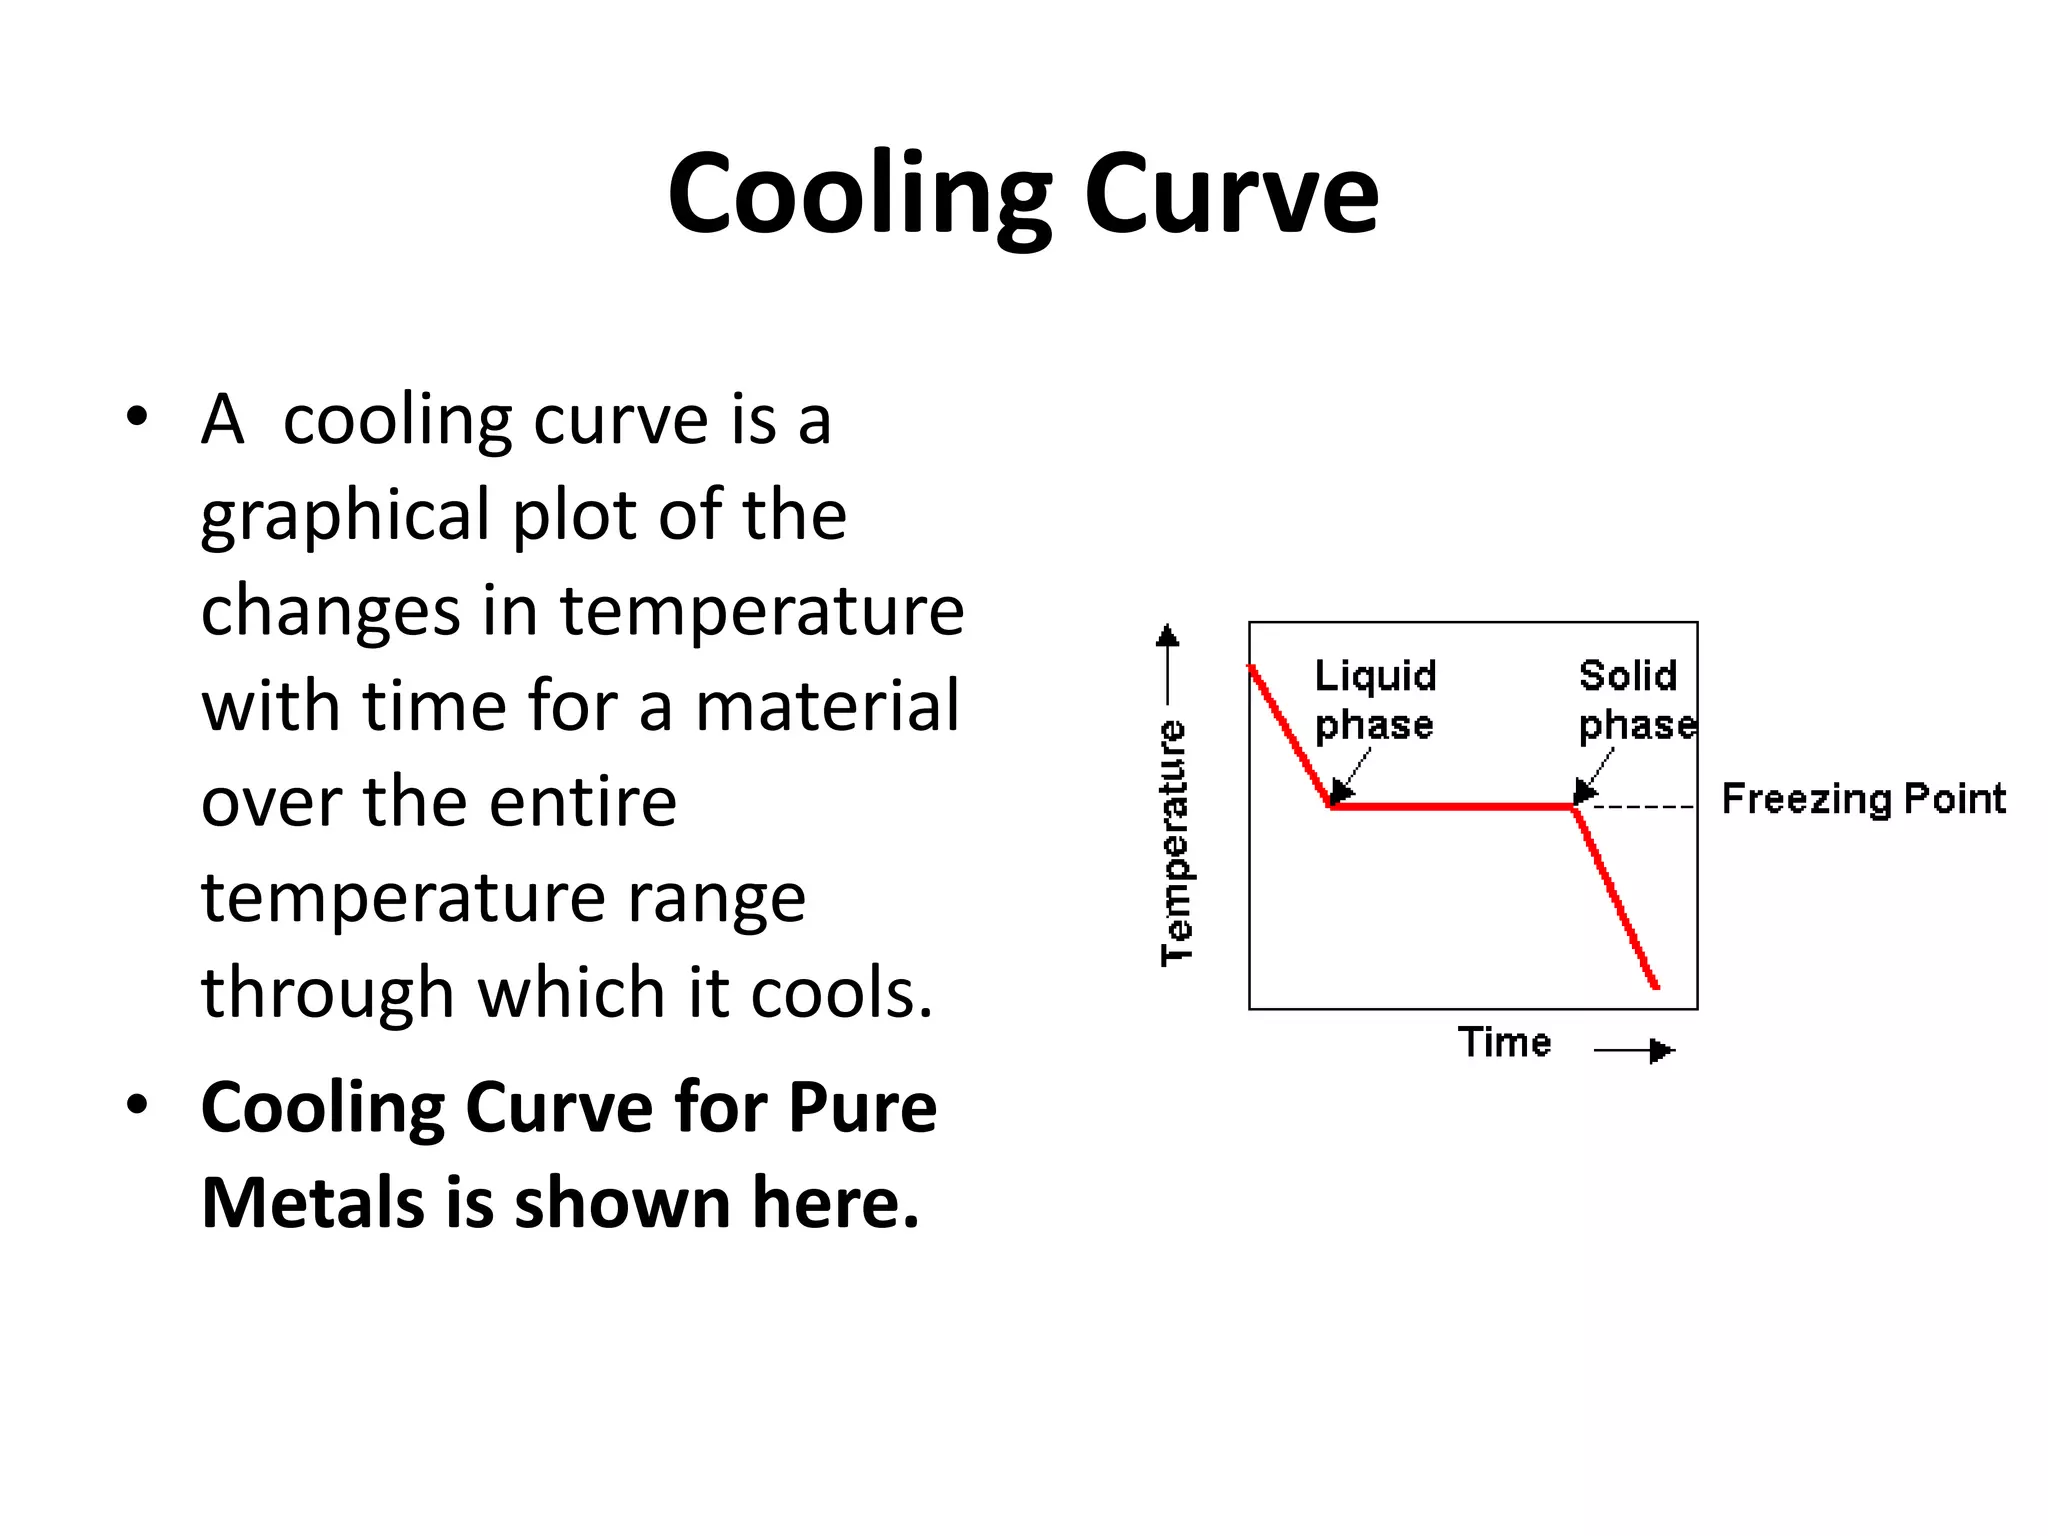
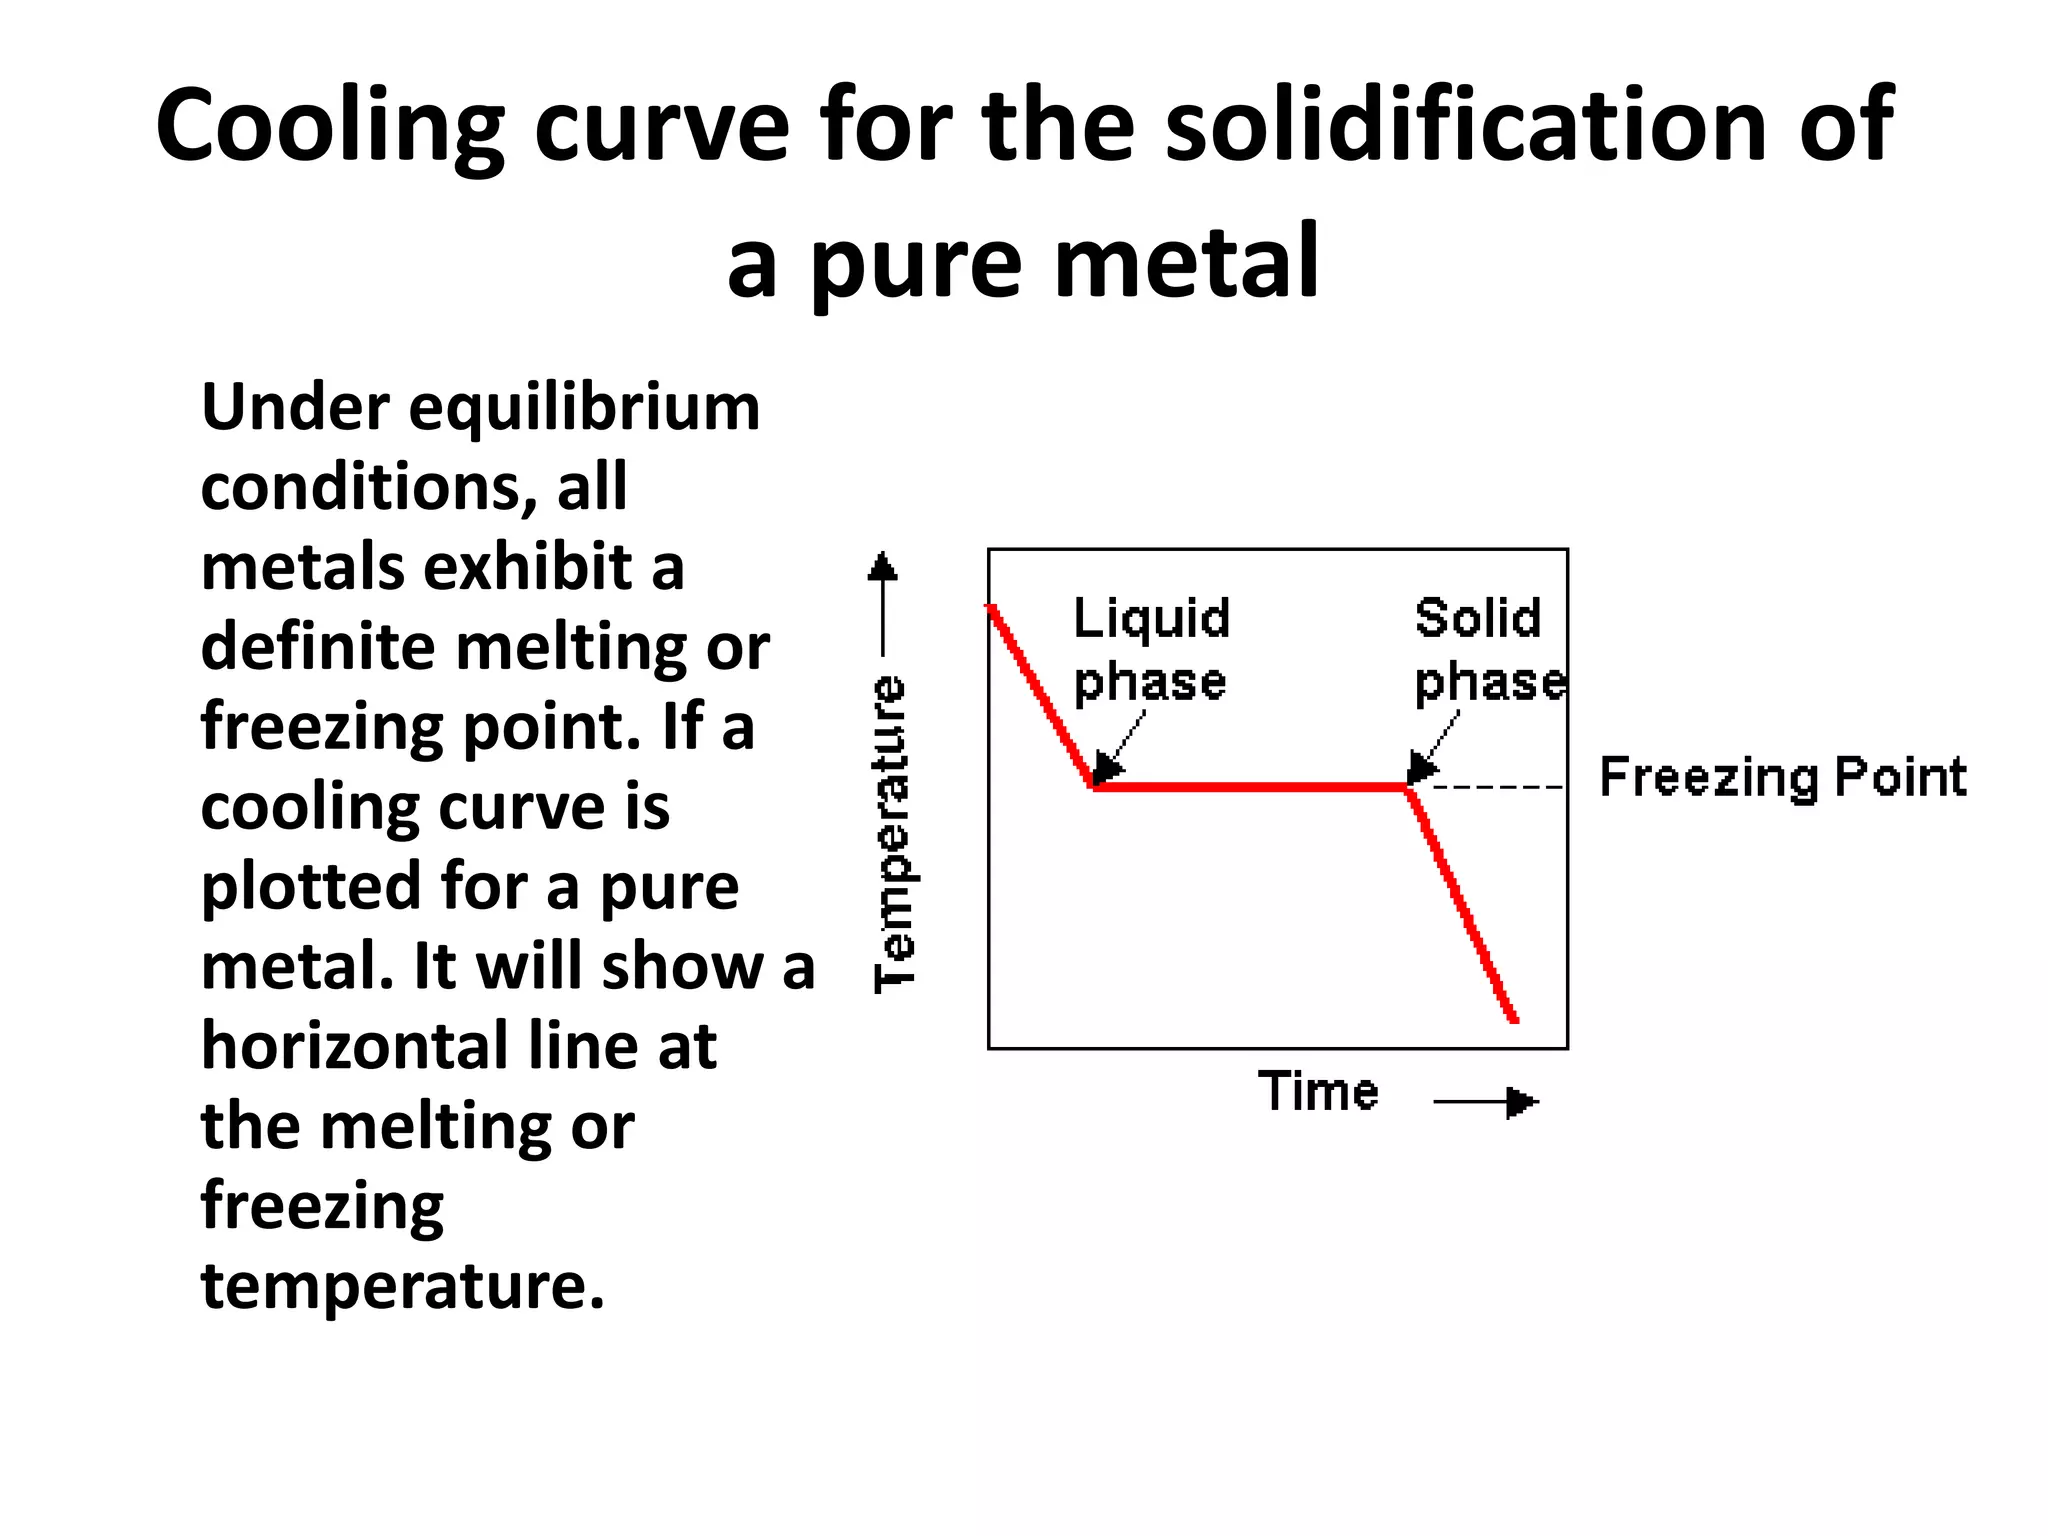
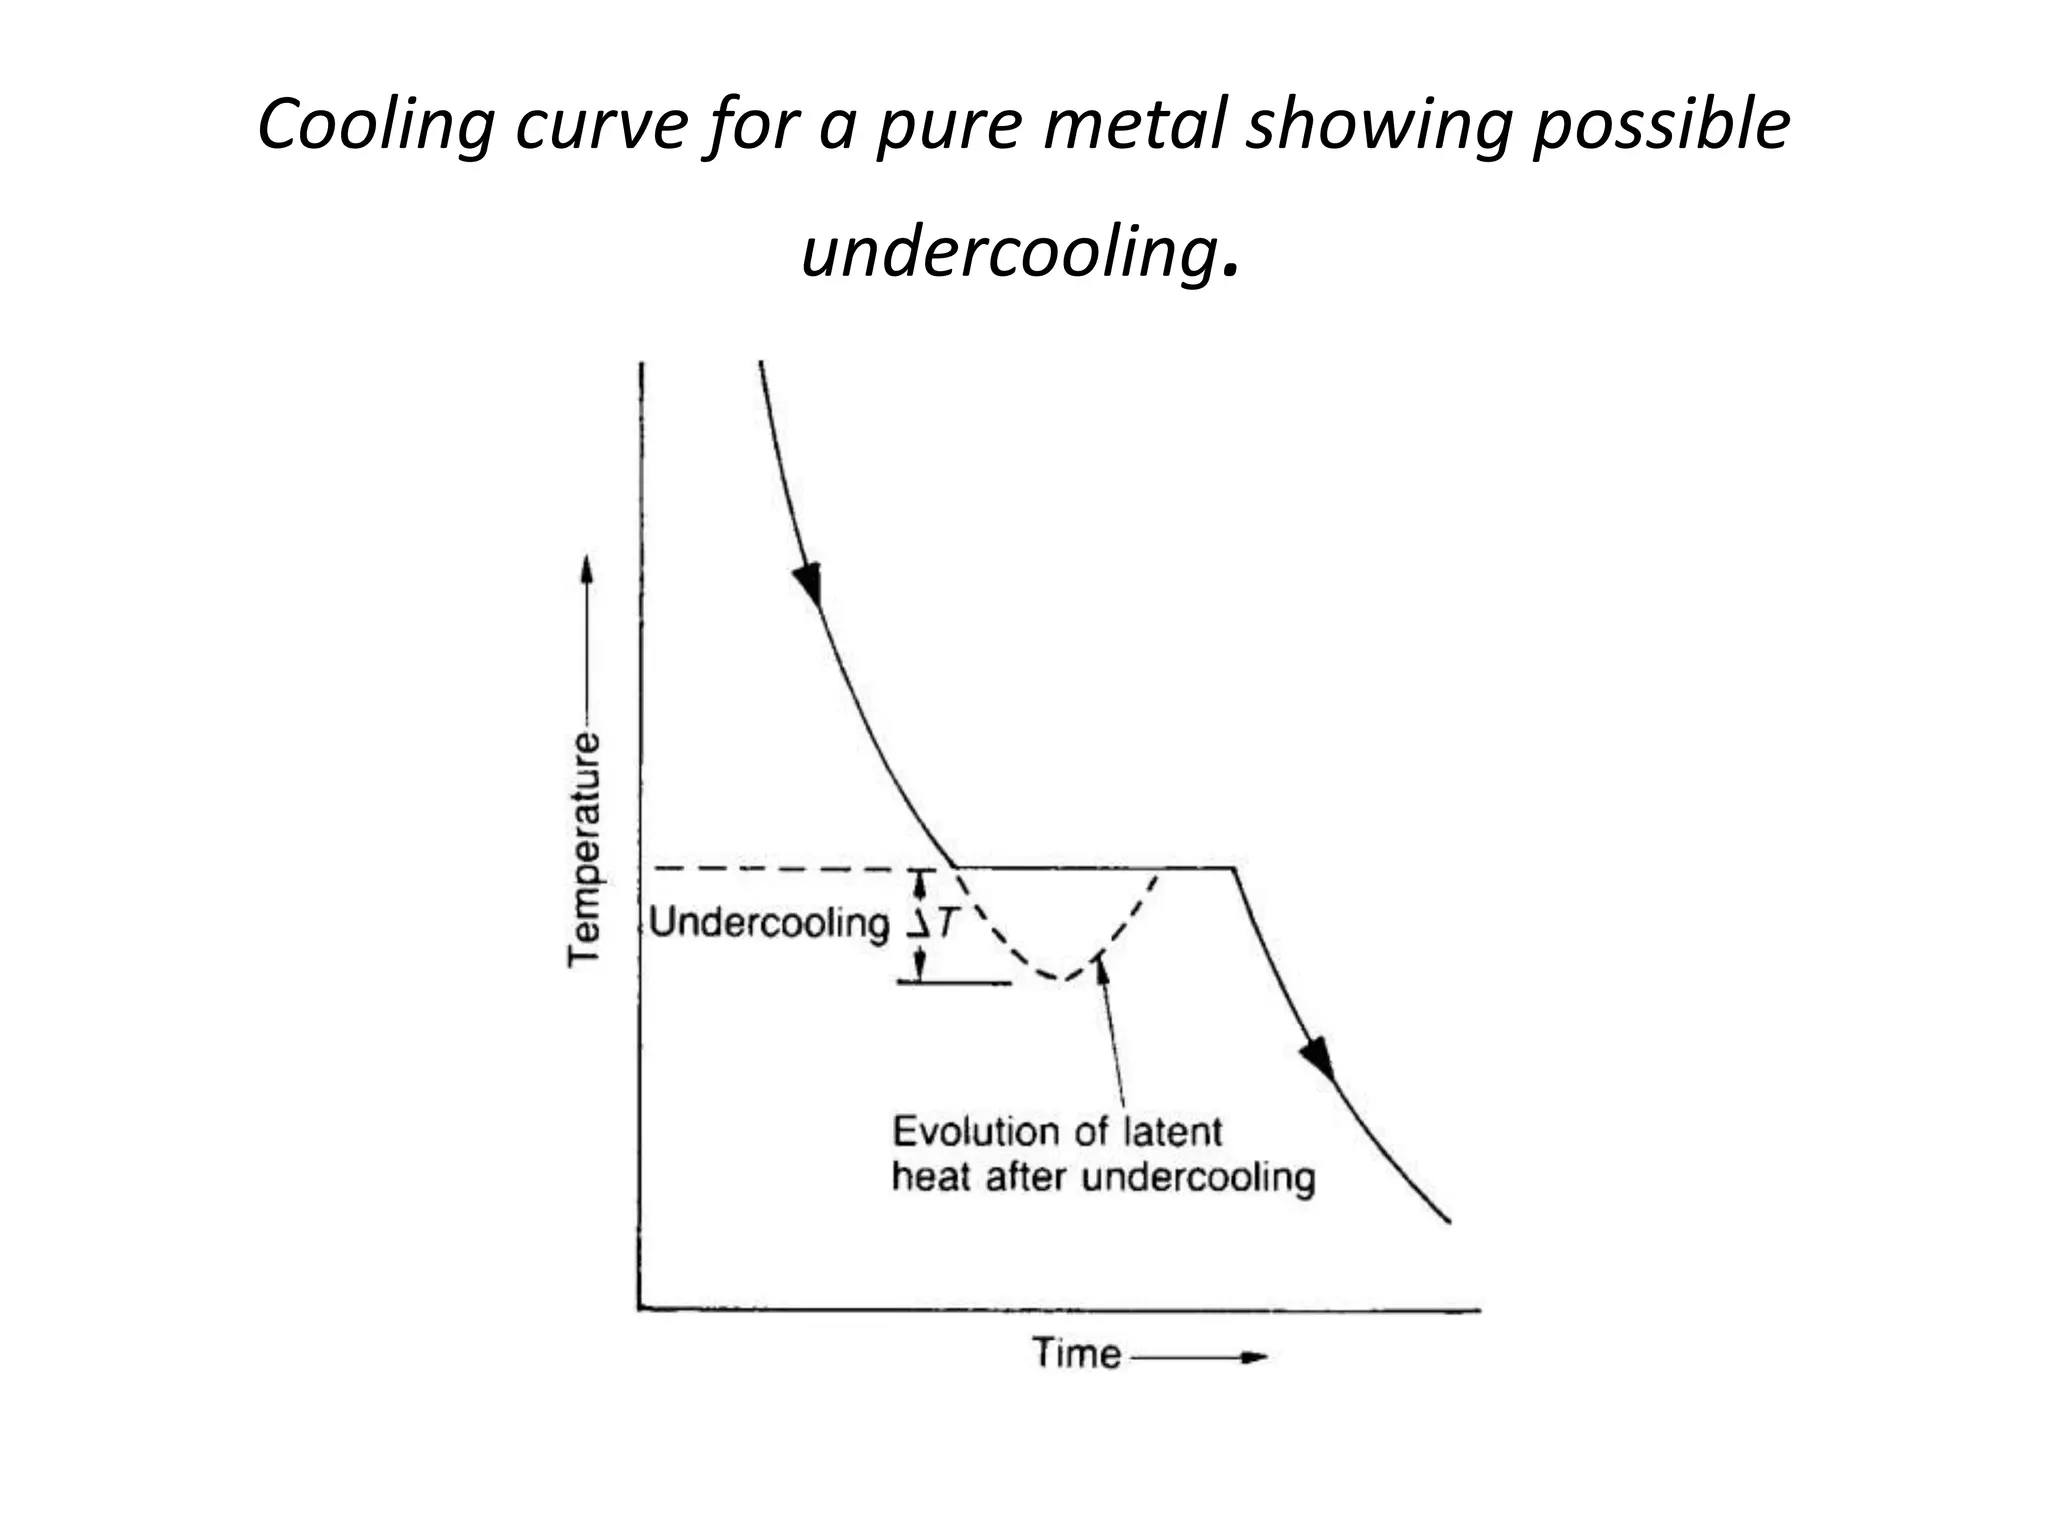
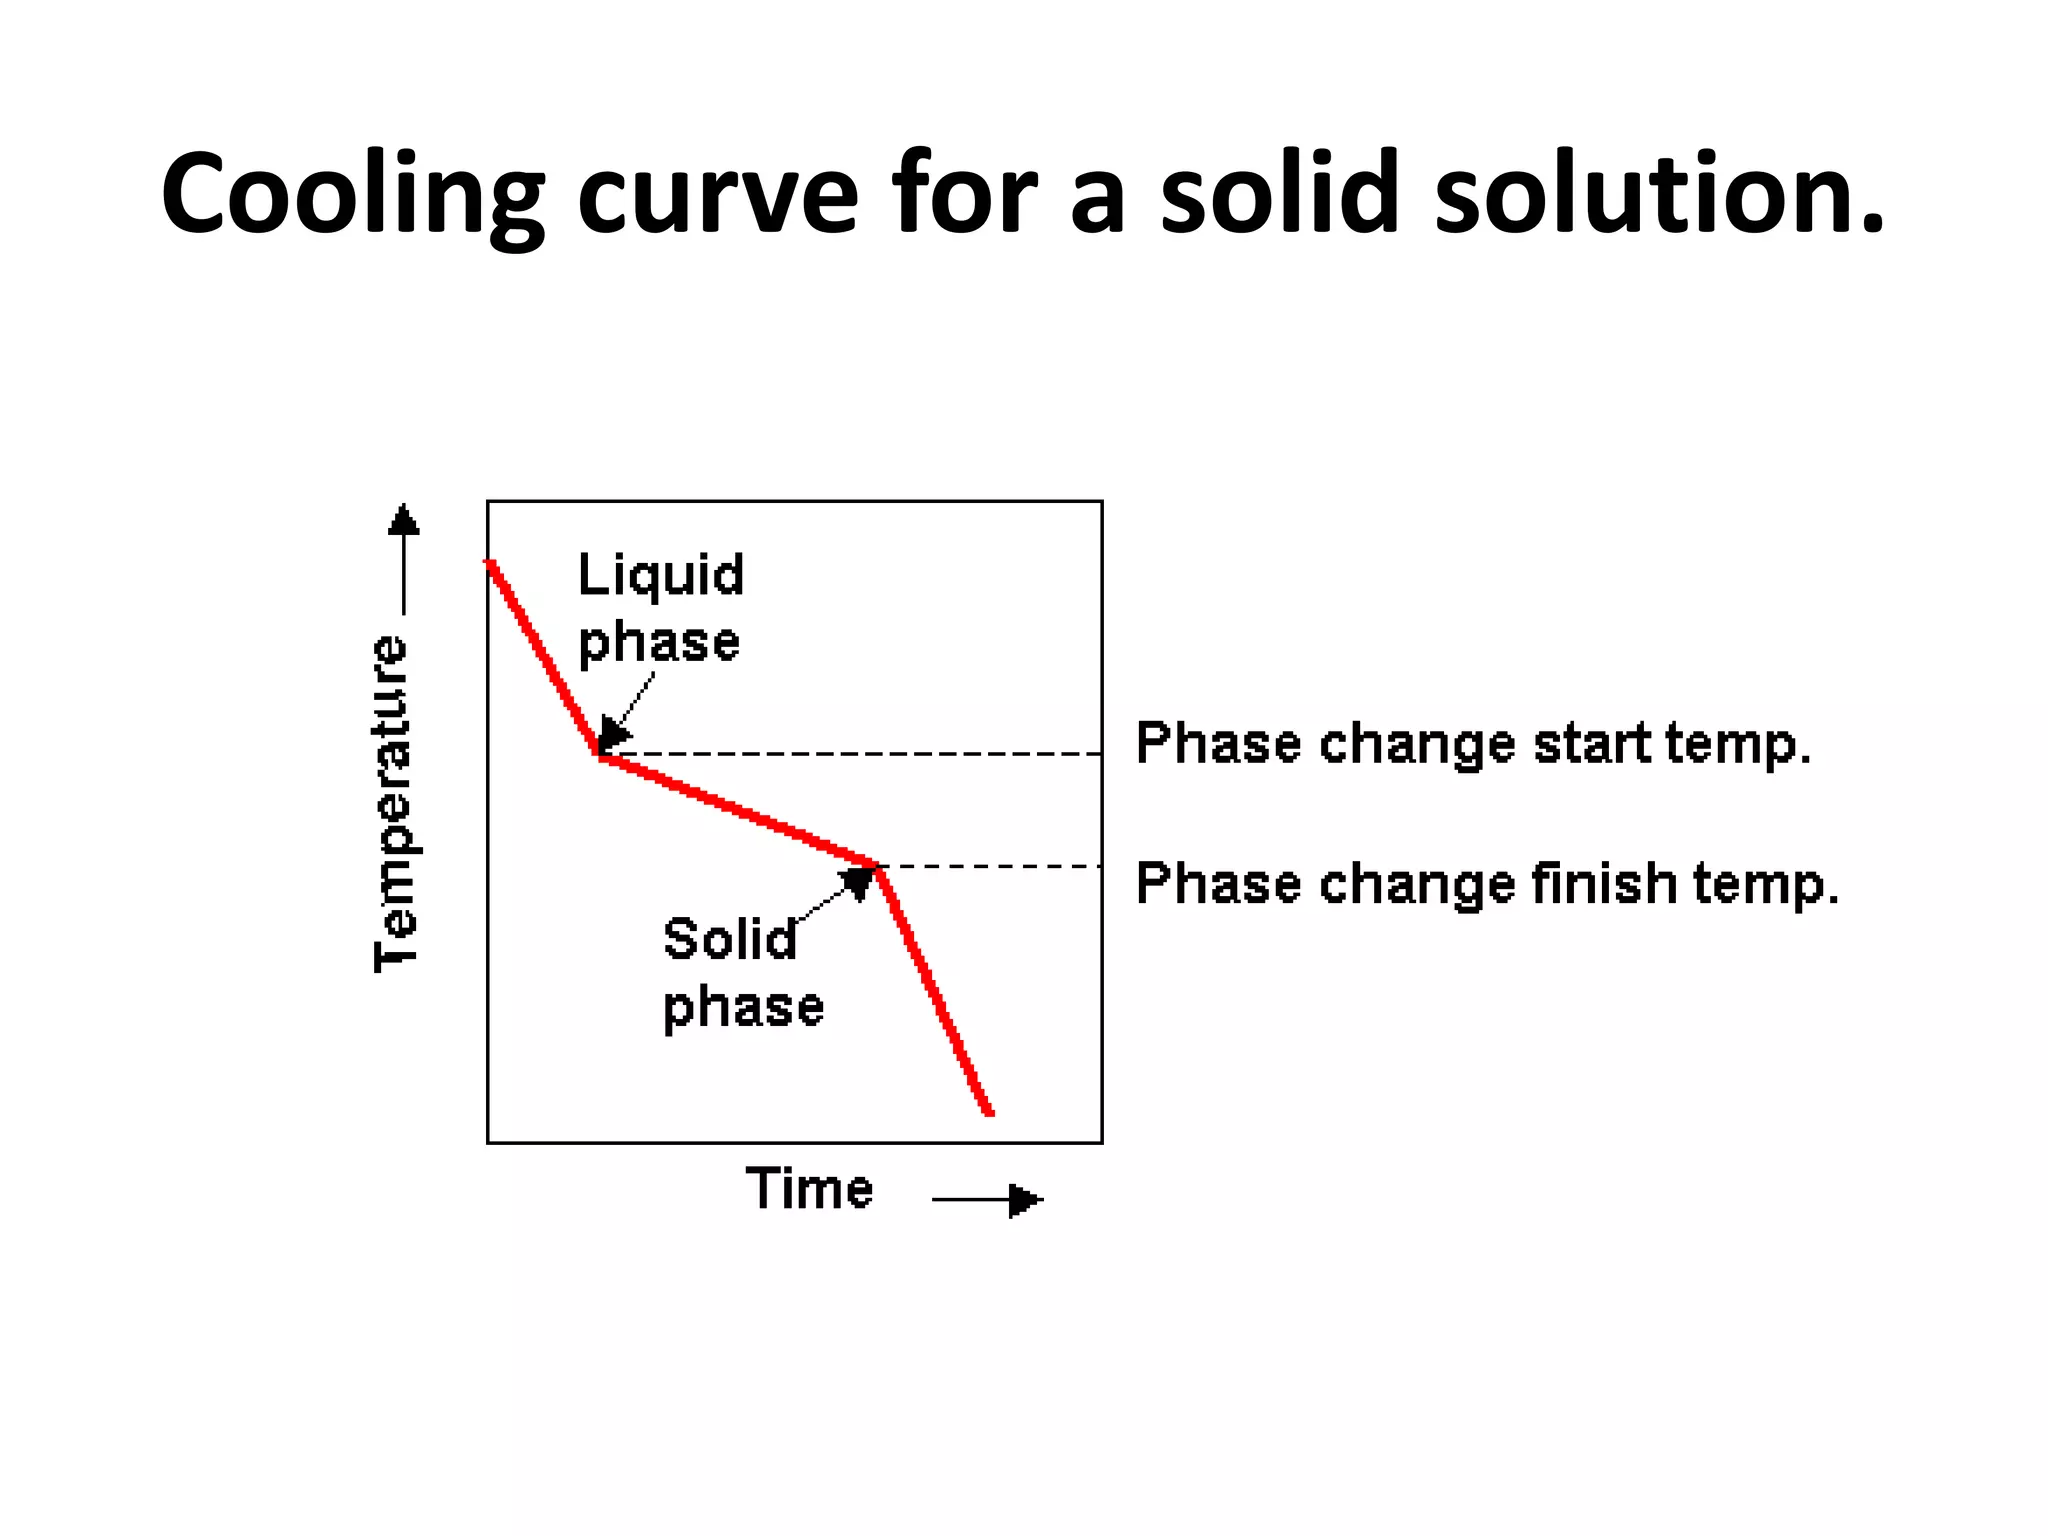
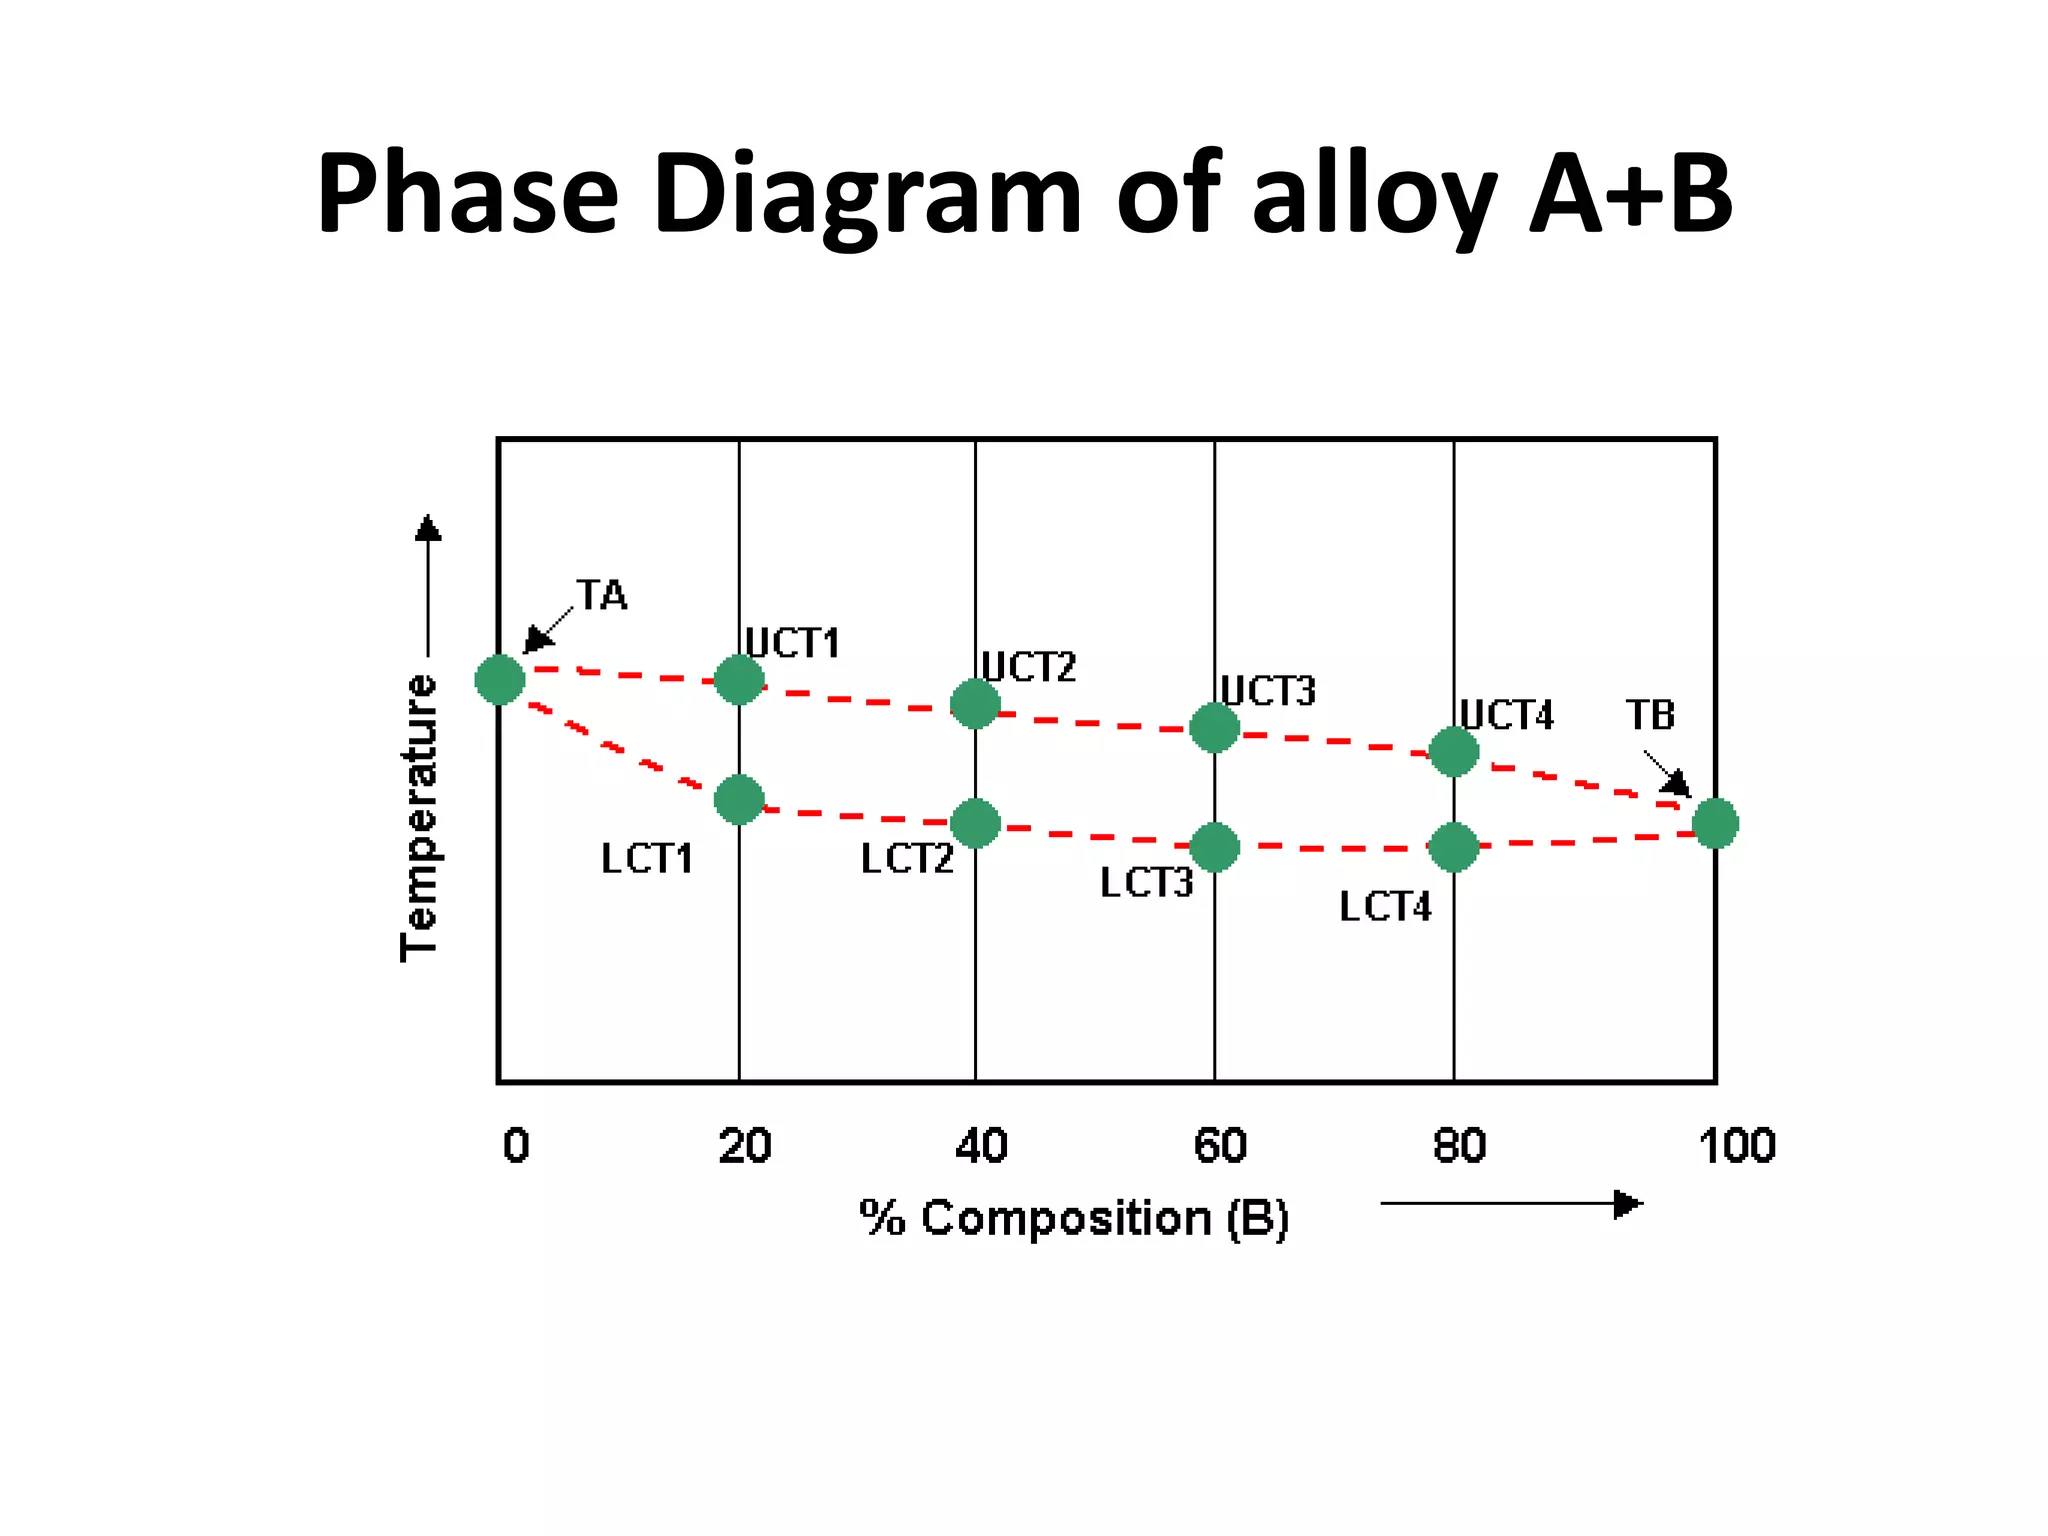
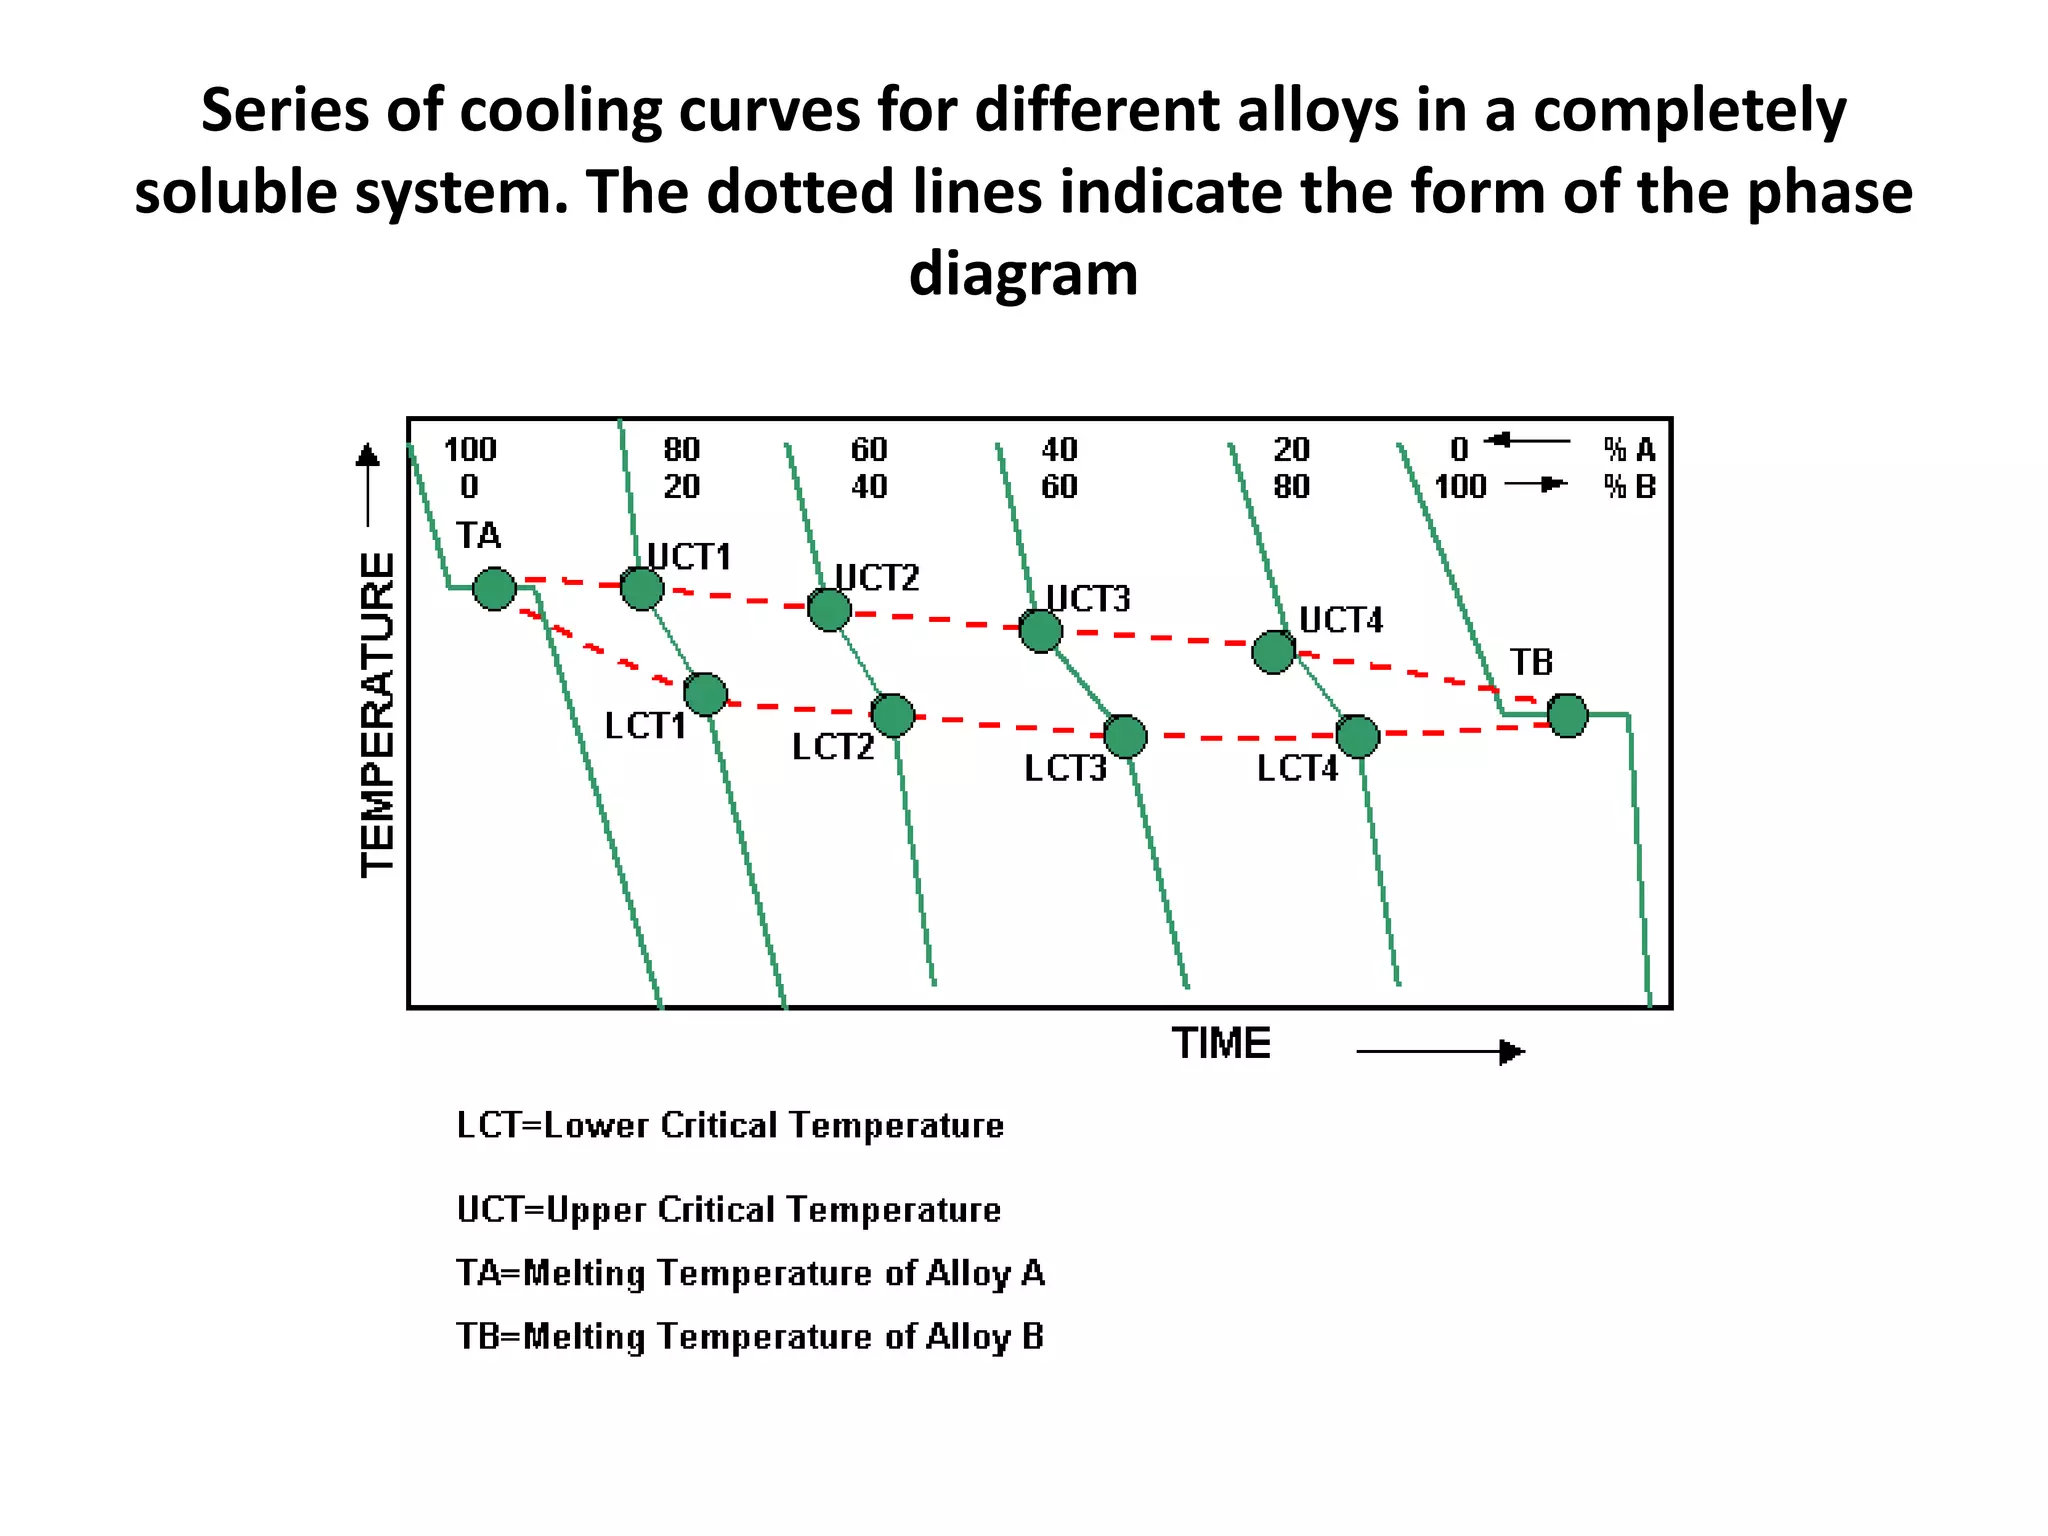
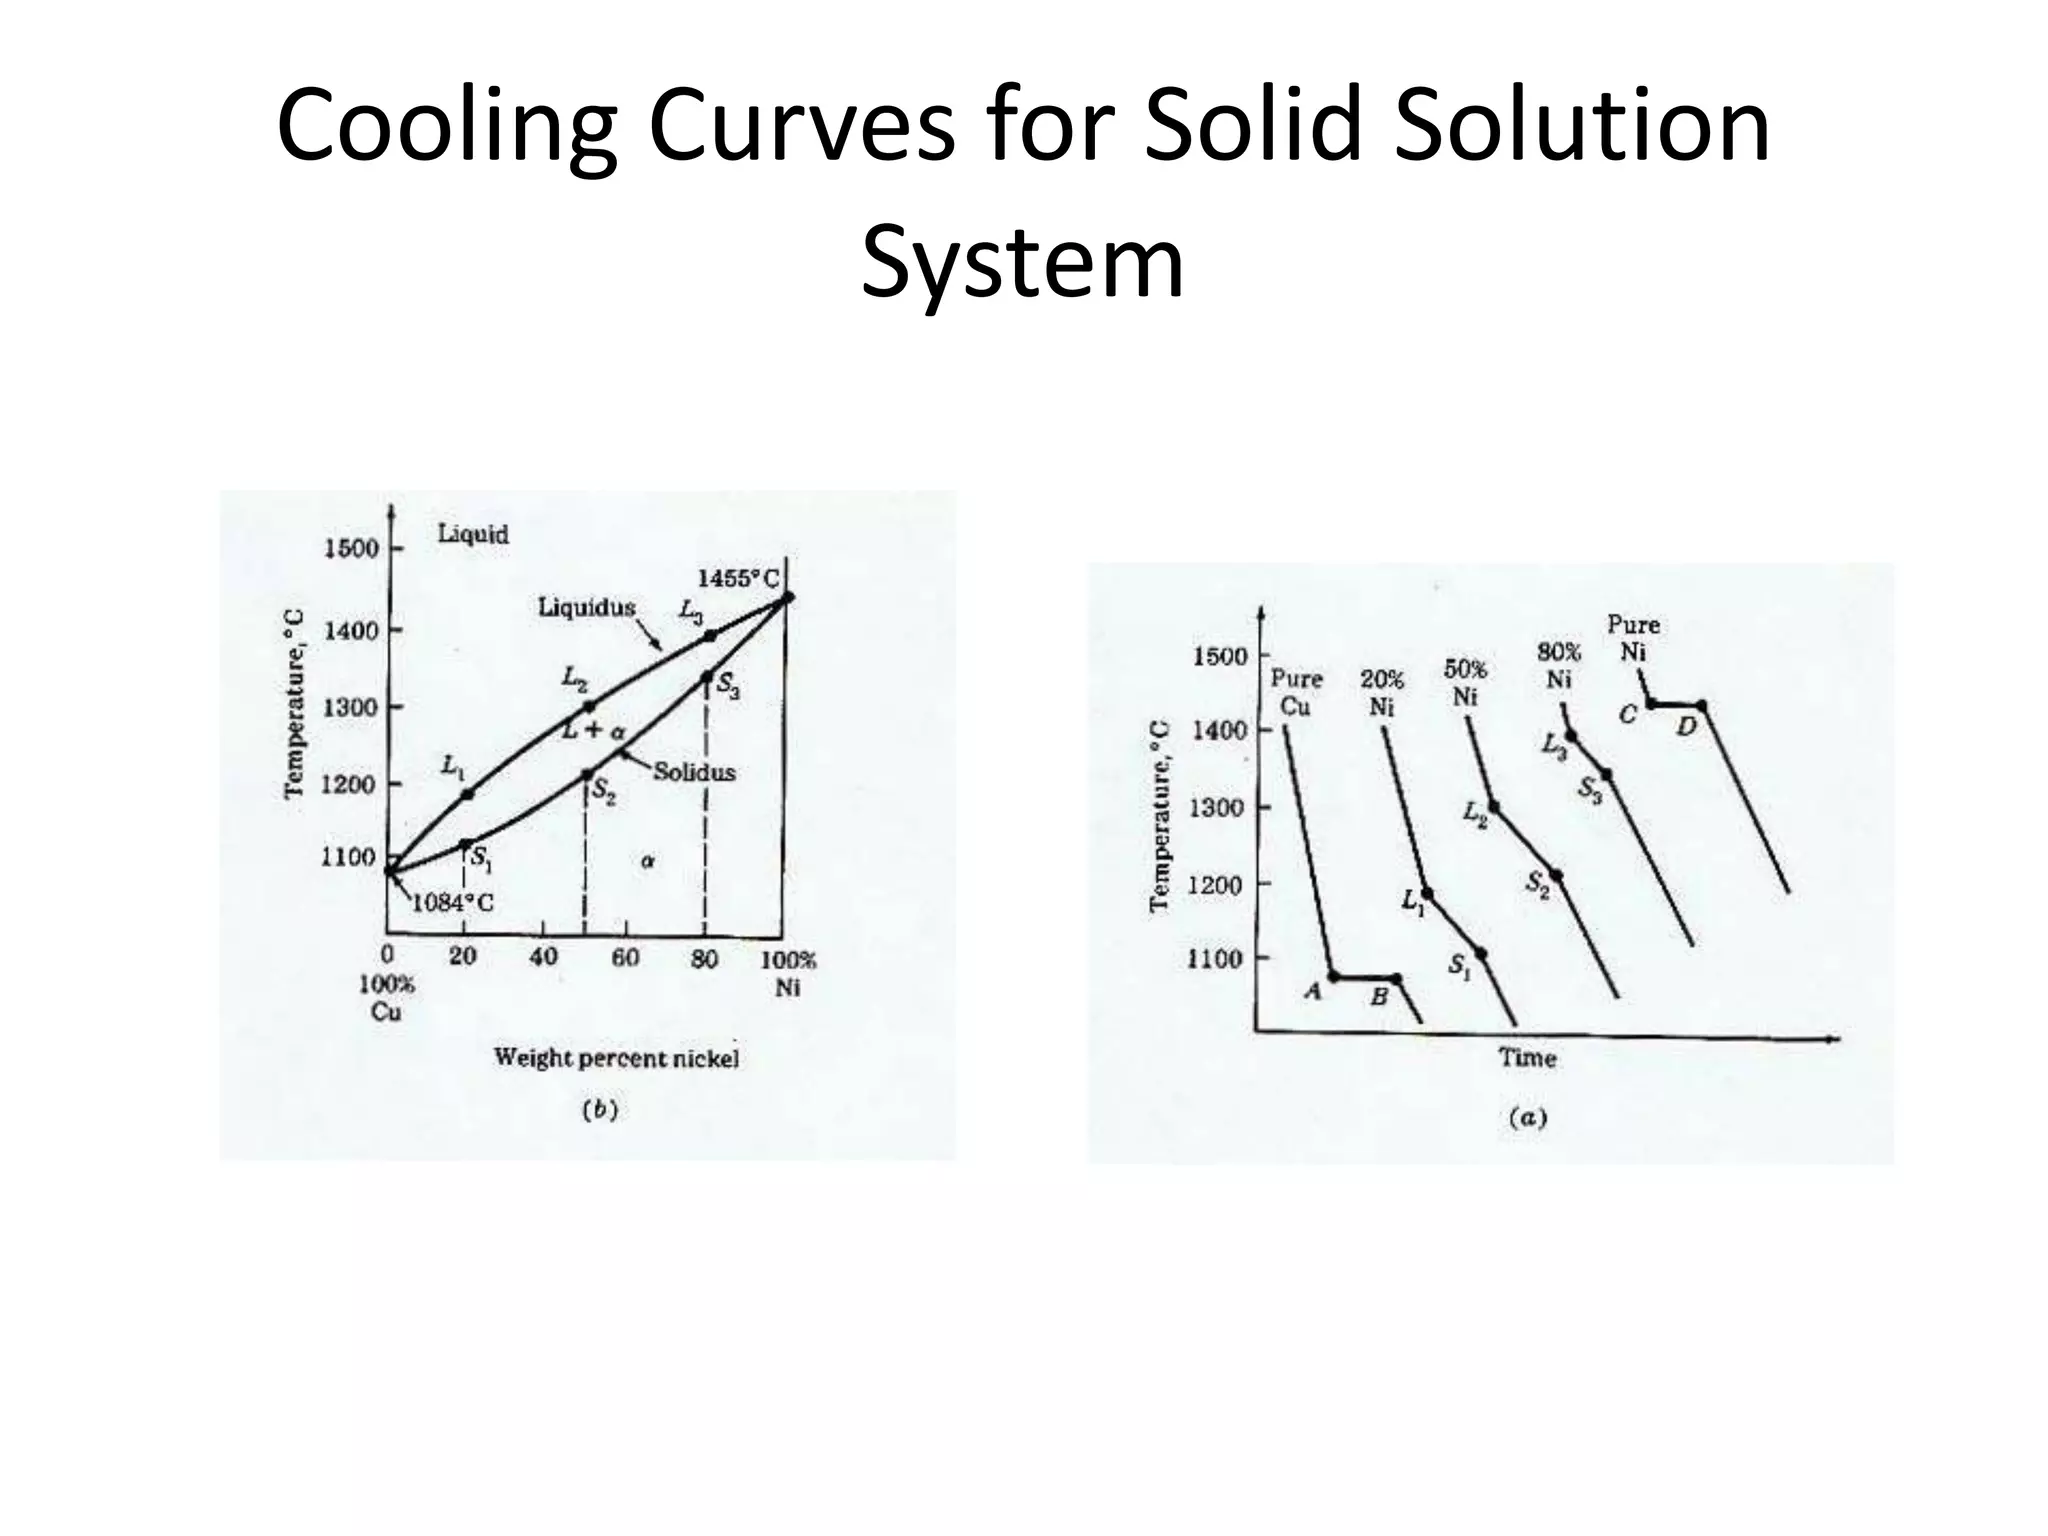
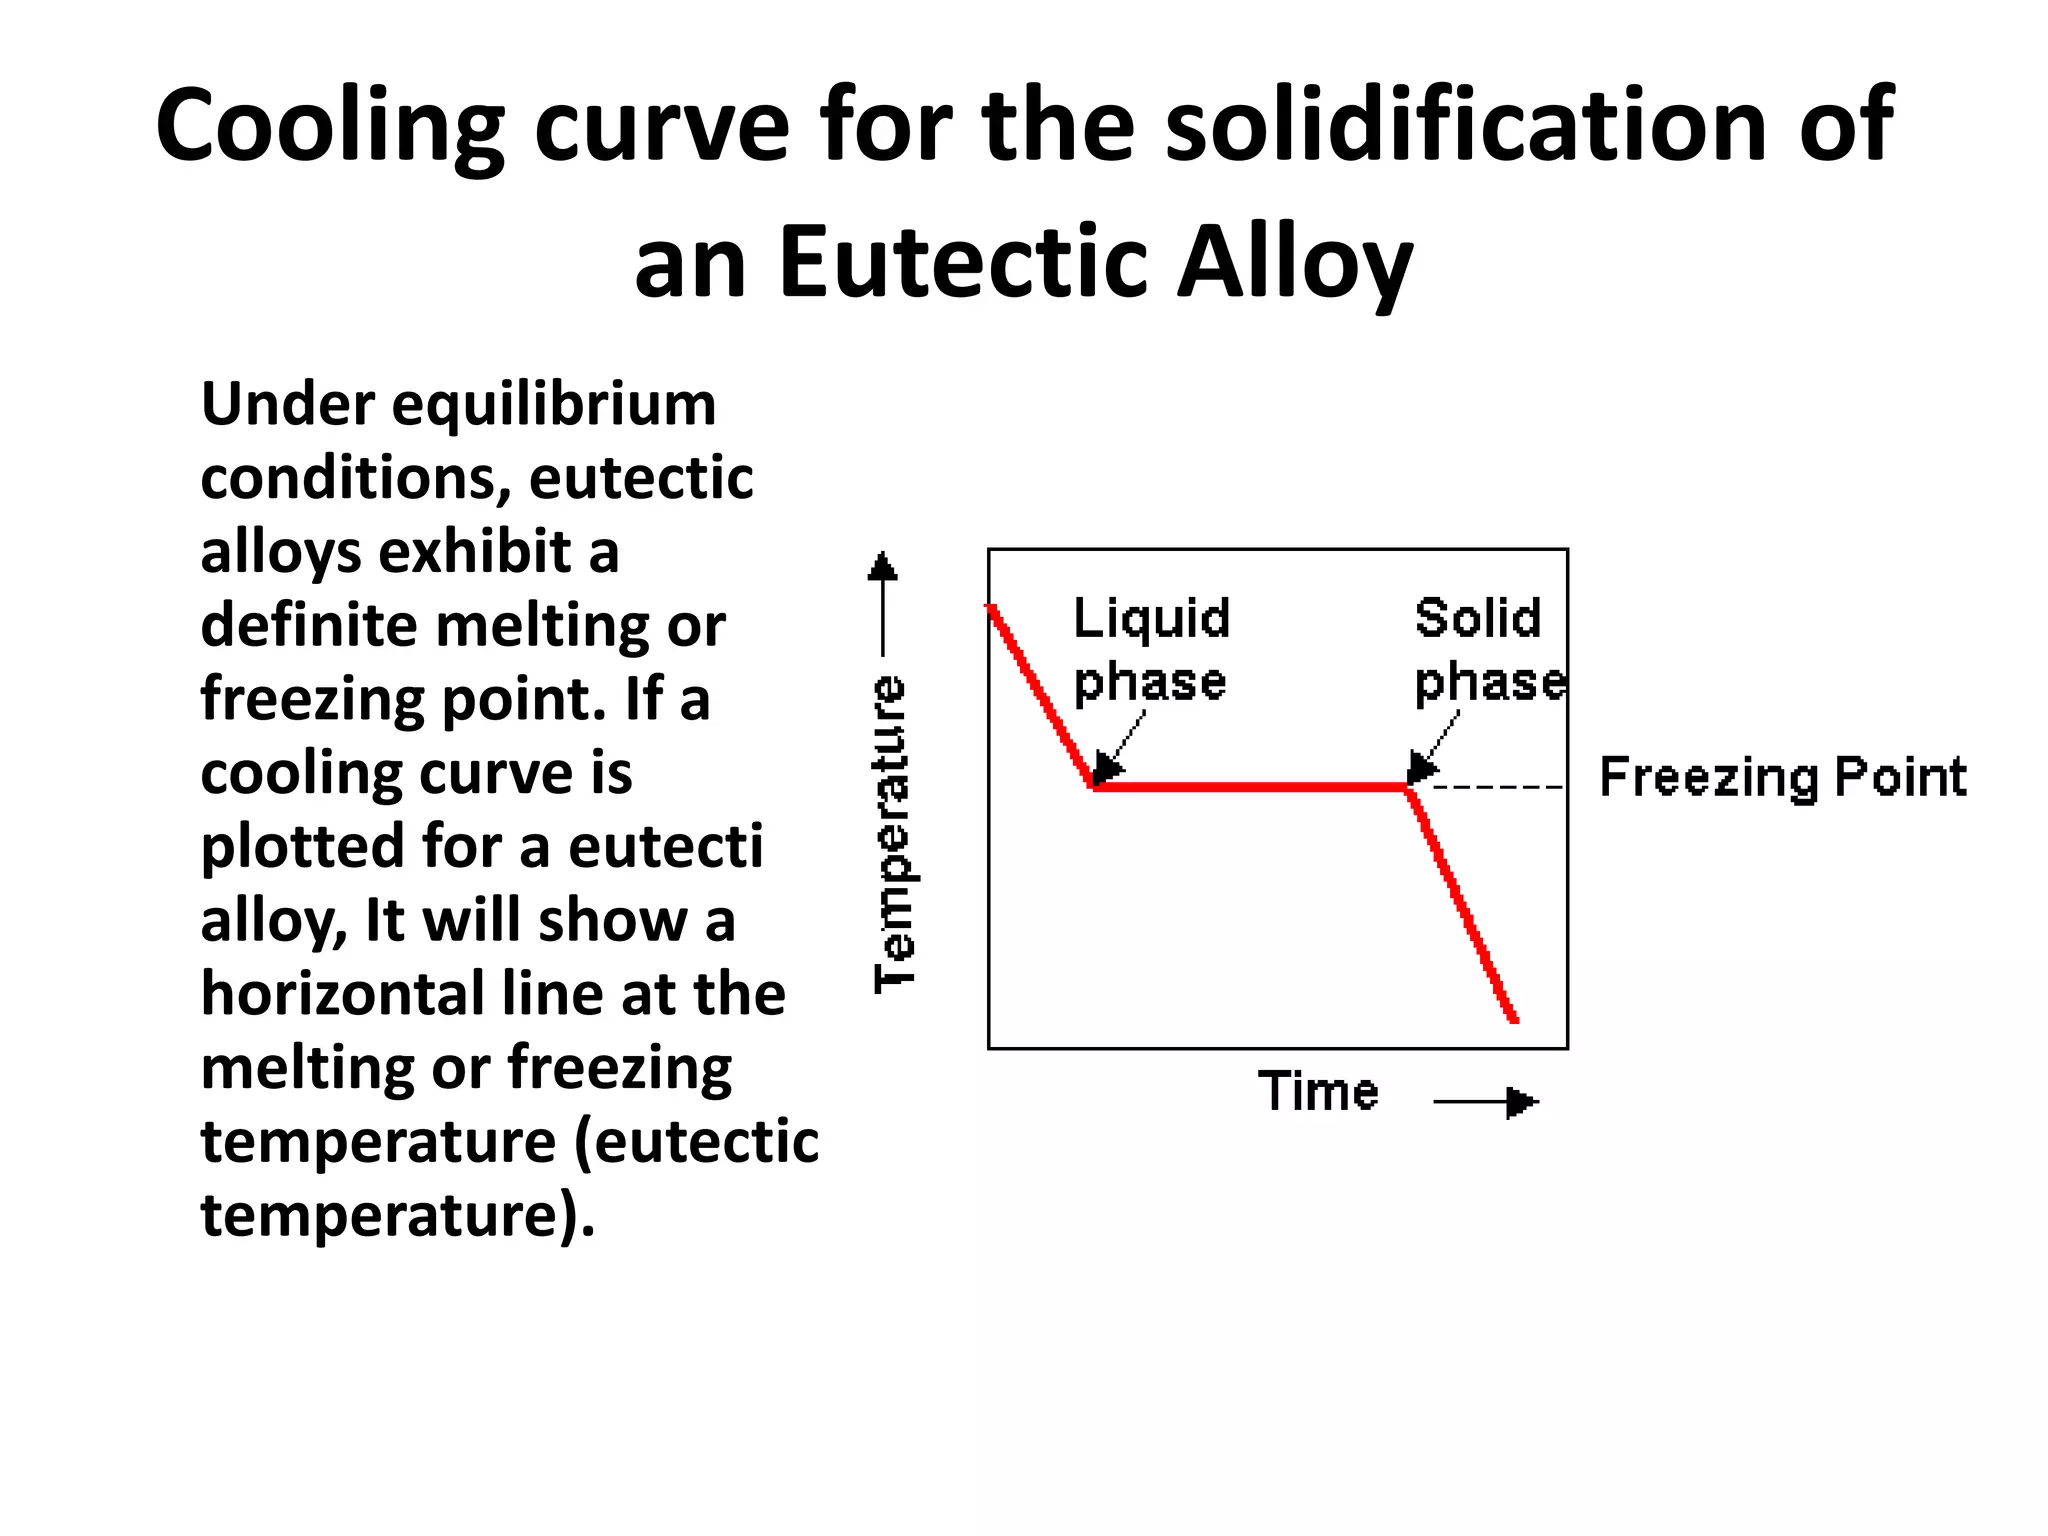


Cooling curves plot the temperature changes that occur as a material cools over its entire temperature range. For pure metals, the cooling curve shows a horizontal line at the freezing/melting temperature. For alloys, cooling curves are used to determine initial and final phase change temperatures, which are then used to construct phase diagrams. Different alloy compositions produce different cooling curve shapes, allowing identification of pure metals, solid solutions, and eutectic compositions.


![Coded Agents – with UiPath SDK + LangGraph [Virtual Hands-on Workshop]](https://cdn.slidesharecdn.com/ss_thumbnails/codedagentsdeck-251215155422-5497c599-thumbnail.jpg?width=640&height=640&fit=bounds)


