Downloaded 655 times


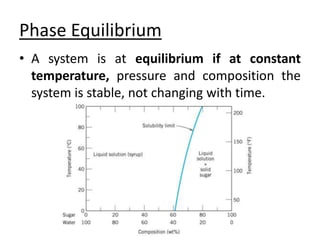
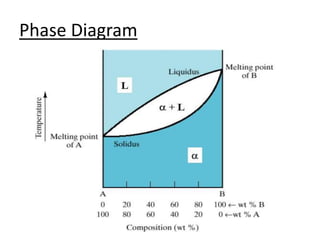
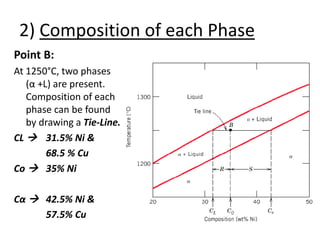
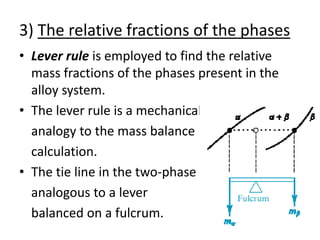
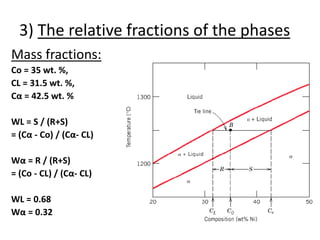
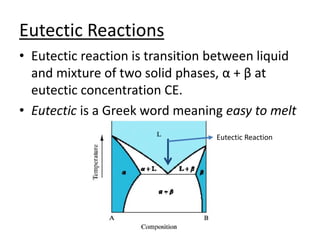
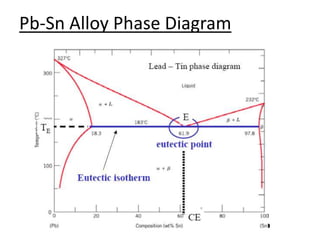
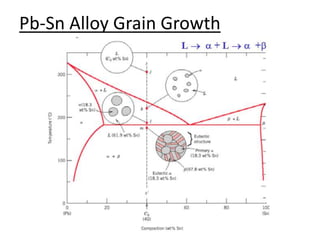
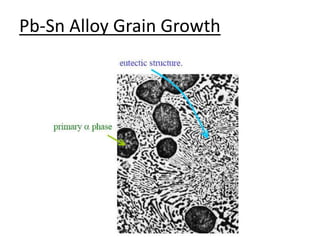
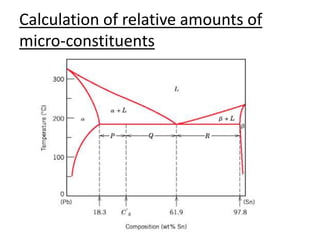
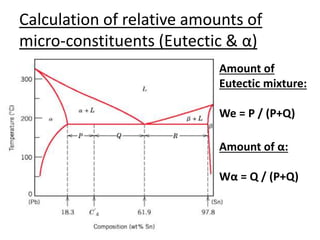
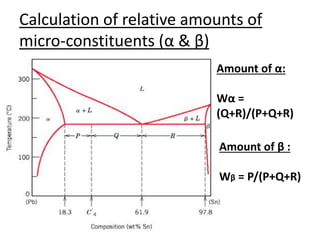
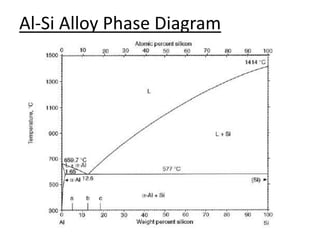
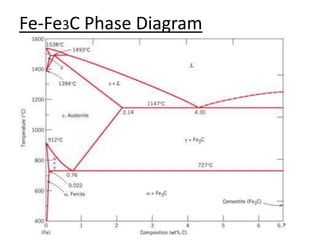
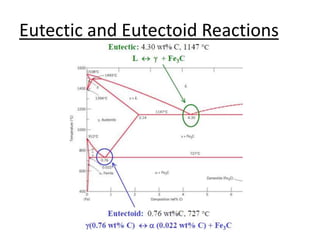

This document provides an overview of phase diagrams and key concepts related to phase diagrams, including: - Common components of phase diagrams like phases, solubility limits, and microstructure. - How to interpret phase diagrams to determine phases present, phase compositions, and relative amounts. - Common reactions shown on phase diagrams like eutectic, eutectoid, and peritectic reactions. - Examples of specific binary alloy phase diagrams like Cu-Ni, Pb-Sn, Al-Si, and Fe-Fe3C. - How to use phase diagrams to understand alloy microstructure and properties.