Download as PDF, PPTX
![[2]
[3]
[4]
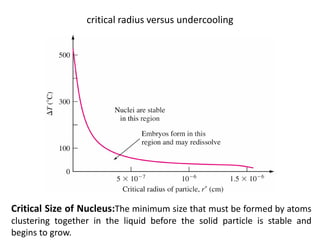
r*
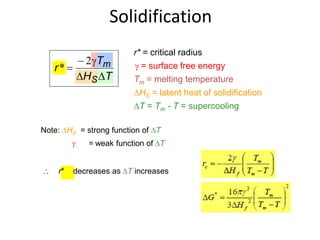
Heat of fusion ∆Hf (energy release upon solidification)
And
Tm-T= Super cooling
Tm= Melting Temp.](https://image.slidesharecdn.com/unit-3-ksr-170821160310/85/Unit-3-k-srinivasulureddy-MMS-metallurgy-material-science-snist-30-320.jpg)
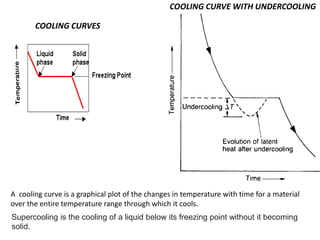
![HETEROGENEOUS NUCLEATION
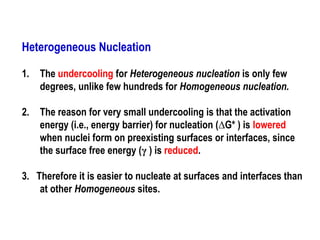
Heterogeneous Nucleation
1. Consider the nucleation of a solid from liquid, on a flat surface.
2. Assume that both liquid and solid phases “wet” this flat surface; that is both
of these phases spread out and cover the surface.
3. Interfacial energies: γSL = Solid/Liquid; γIL = Liquid/surface;
γSI = Solid /surface.
4. Taking surface tension force balance: γIL = γSI + γSL cos θ [12]](https://image.slidesharecdn.com/unit-3-ksr-170821160310/85/Unit-3-k-srinivasulureddy-MMS-metallurgy-material-science-snist-35-320.jpg)
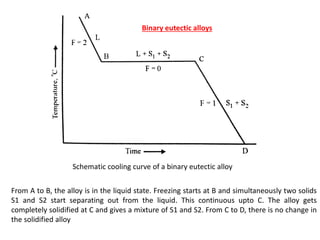
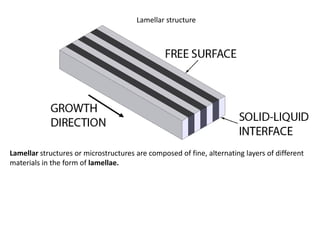
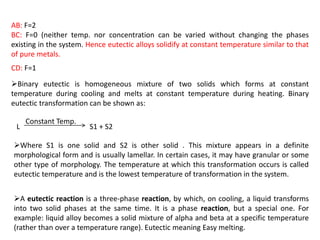
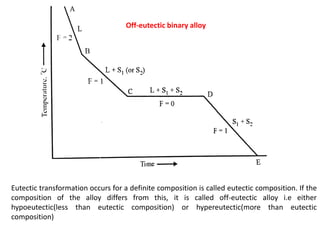
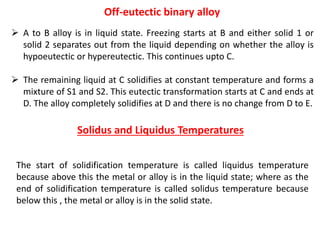
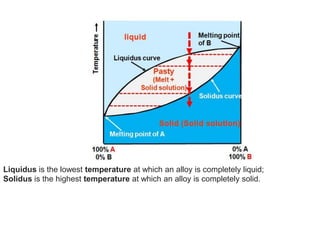
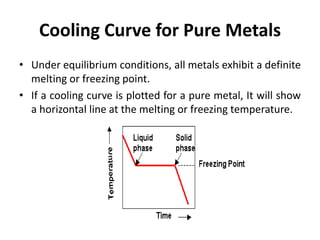
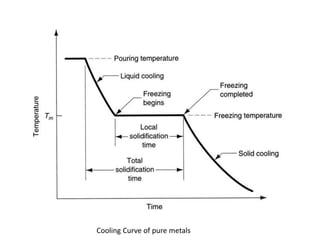


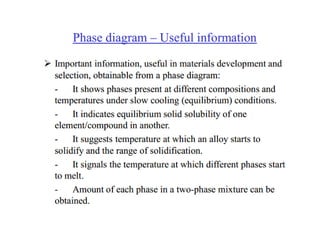
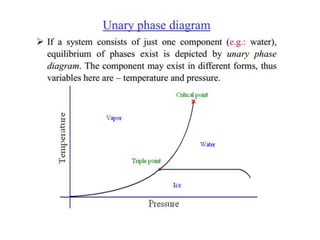
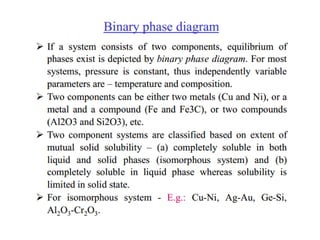
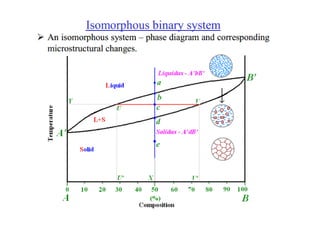
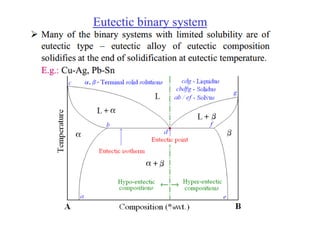
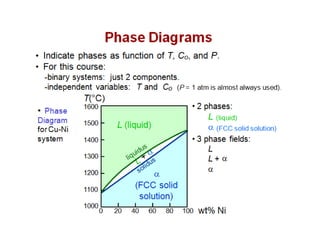
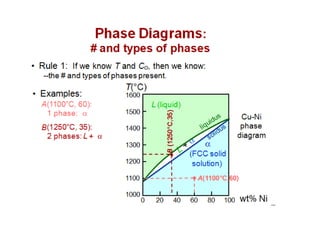
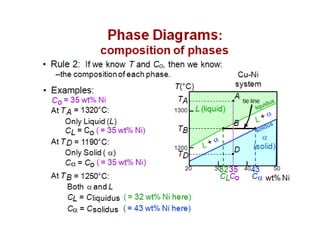
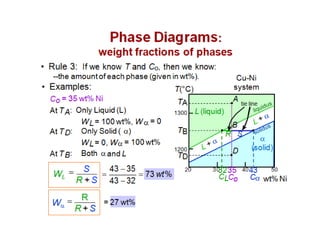
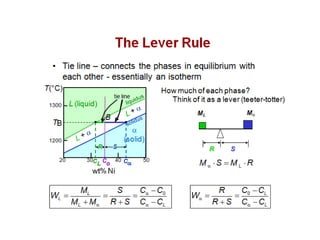
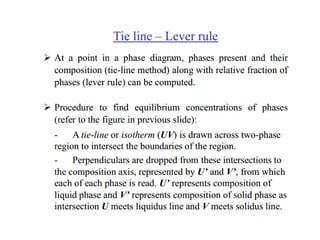
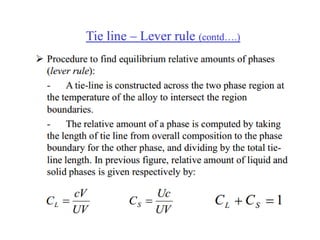

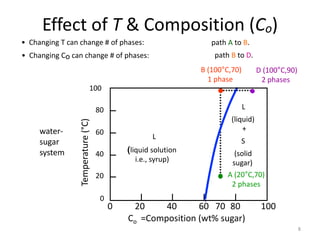
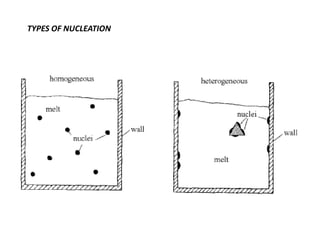
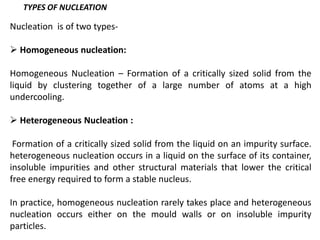
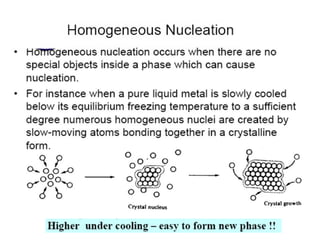
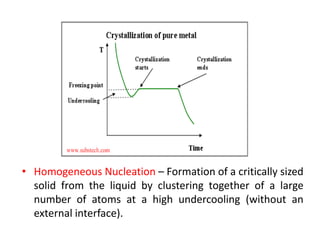
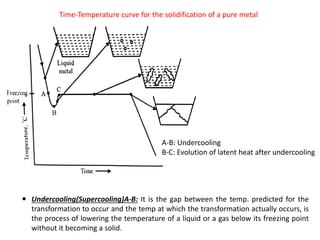
The document discusses the solidification of metals and binary alloys, covering concepts such as nucleation, grain growth, and directional solidification. It explains phase transformations, phase diagrams, solubility limits, and the processes of both homogeneous and heterogeneous nucleation, emphasizing their importance in influencing the microstructure of metals. Additionally, it explores the applications of various non-ferrous alloys and the impact of heat treatment on their properties.