This document provides an introduction to phase diagrams and phase equilibria. It defines key terms like system, phase, variables, components, alloys, and solid solutions. It describes Gibbs phase rule and how it relates the number of phases, components, and degrees of freedom in a system. It explains Gibbs free energy and how it indicates the thermodynamic stability of phases. It also discusses cooling curves for pure metals, binary solid solutions, eutectic alloys, and off-eutectic alloys. Hume-Rothery rules for solid solubility and interpreting phase diagrams are also summarized.
Iron – Carbon Diagram is also known as Iron – Carbon Phase Diagram or Iron – Carbon Equilibrium diagram or Iron – Iron Carbide diagram or Fe-Fe3C diagram
phase transition (or phase change) is most commonly used to describe transitions between solid, liquid and gaseous states of matter, and, in rare cases, plasma.
The process of transformation of a substance from liquid to solid state in which the crystal lattice forms and crystals appear.
•Volume shrinkage or volume contraction
Phase diagrams for Different Alloy
By
P.SENTHAMARAIKANNAN,
ASSISTANT PROFESSOR ,
DEPARTMENT OF MECHANICAL ENGINEERING,
KAMARAJ COLLEGE OF ENGINEERING AND TECHNOLOGY,
VIRUDHUNAGAR, TAMILNADU,
INDIA
14 Types of Corrosion explained in an awesome manner
Update 26 June 2019: I have enabled the Download option and now everyone can download the "Types of corrosions" PPT and reuse the slides :) I wish I have done this earlier.
Follow my blogs at https://www.geekdashboard.com/
THE PHASE RULE
phase rule
degree of freedom in mixture
one component system
two component system
pressure temperature diagram sulfur hydrogen
eutectic eutectoid mixture
Phase equilibrium studies of impure CO2 systems to underpin developments of CCS technologies - presentation by Jie Ke in the Effects of Impurities on CO2 Properties session at the UKCCSRC Cardiff Biannual Meeting, 10-11 September 2014
TTT curves and CCT curves relation with fatigueSeela Sainath
in this file all failures of materials and how to overcome if the metal bearing sudden load that is fatigue and what are the reasons of failures are discussed here.
This document is about phases and phase diagram's interpretation. It includes information regarding compositional quantity, each phase quantity, overall composition, etc. It also tells about how to read a phasor diagram along with information regarding various components of these kinds of diagrams.
Constitution of alloys – Solid solutions, substitutional and interstitial – phase diagrams, Isomorphous, eutectic, eutectoid, peritectic, and peritectoid reactions, Iron – carbon equilibrium diagram. Classification of steel and cast Iron microstructure, properties and application.
Saudi Arabia stands as a titan in the global energy landscape, renowned for its abundant oil and gas resources. It's the largest exporter of petroleum and holds some of the world's most significant reserves. Let's delve into the top 10 oil and gas projects shaping Saudi Arabia's energy future in 2024.
Student information management system project report ii.pdfKamal Acharya
Our project explains about the student management. This project mainly explains the various actions related to student details. This project shows some ease in adding, editing and deleting the student details. It also provides a less time consuming process for viewing, adding, editing and deleting the marks of the students.
Hierarchical Digital Twin of a Naval Power SystemKerry Sado
A hierarchical digital twin of a Naval DC power system has been developed and experimentally verified. Similar to other state-of-the-art digital twins, this technology creates a digital replica of the physical system executed in real-time or faster, which can modify hardware controls. However, its advantage stems from distributing computational efforts by utilizing a hierarchical structure composed of lower-level digital twin blocks and a higher-level system digital twin. Each digital twin block is associated with a physical subsystem of the hardware and communicates with a singular system digital twin, which creates a system-level response. By extracting information from each level of the hierarchy, power system controls of the hardware were reconfigured autonomously. This hierarchical digital twin development offers several advantages over other digital twins, particularly in the field of naval power systems. The hierarchical structure allows for greater computational efficiency and scalability while the ability to autonomously reconfigure hardware controls offers increased flexibility and responsiveness. The hierarchical decomposition and models utilized were well aligned with the physical twin, as indicated by the maximum deviations between the developed digital twin hierarchy and the hardware.
Water scarcity is the lack of fresh water resources to meet the standard water demand. There are two type of water scarcity. One is physical. The other is economic water scarcity.
Sachpazis:Terzaghi Bearing Capacity Estimation in simple terms with Calculati...Dr.Costas Sachpazis
Terzaghi's soil bearing capacity theory, developed by Karl Terzaghi, is a fundamental principle in geotechnical engineering used to determine the bearing capacity of shallow foundations. This theory provides a method to calculate the ultimate bearing capacity of soil, which is the maximum load per unit area that the soil can support without undergoing shear failure. The Calculation HTML Code included.
Welcome to WIPAC Monthly the magazine brought to you by the LinkedIn Group Water Industry Process Automation & Control.
In this month's edition, along with this month's industry news to celebrate the 13 years since the group was created we have articles including
A case study of the used of Advanced Process Control at the Wastewater Treatment works at Lleida in Spain
A look back on an article on smart wastewater networks in order to see how the industry has measured up in the interim around the adoption of Digital Transformation in the Water Industry.
2. Introduction:
One of the most important objective of engineering
metallurgy is to determine properties of material.
The properties of material is a function of the microstructure
which depend on the overall composition and variable such as
pressure and temperature.
Hence to determine the phase present in the material system ,
an equilibrium or phase diagram is plotted.
Equilibrium diagram or phase diagram is a graphical
representation of various phase present in material system
at various temperature and composition point.
All the phase diagrams have temperature as the ordinate as the
ordinate(Y-axis) and percentage composition by weight as the
abscissa(X-axis)
3. Uses of equilibrium or phase diagram:
The equilibrium diagram is used to obtain following
information:
1. It shows the various phase present at different
composition and temperature.
2. It indicate solid solubility of one element in other.
3. It shows the temperature range over which solidification
or liquidification of material system occurs.
4. It indicate the temperature at which different phase start
to melt.
4. Basic Terms:
1. System: The substances that isolated and unaffected by their
surrounding are known as system.
It may be composition of solid, liquid , gases or the combinations
and may have metals and nonmetals separately or in any combination.
A system is capable of changing its composition, temperature,
pressure, density etc.
3. Phase: It is a physically and chemically composition of a
substance(system), separated from the other portion by a surface and
an interface. Each portion have different composition and properties.
In a equilibrium diagram, liquid is one phase and solid solution is
another phase.
3. Variables: A particular phase exists under various condition of
pressure and temperature and composition. These parameters are
known as the variables of the phase.
5. Basic Terms:
4. Component: These are the substances, element or chemical
compound whose presence is necessary and sufficient to make
a system. A pure metal is one component system whereas and
alloy of metals is a two-component(binary) system etc.
5. Alloy: It is a mixture of two or more elements having metallic
properties. In the mixture, metal is in the large proportion and
the other can be metal and non-metals.
6. GIBB’S PHASE RULE
Gibbs phase rule establishes the relationship
between the number of variable (F), the number of
element (C), and the number of phases(P). It is
expressed mathematically as follows:
P + F = C + 2 ……….(I)
Where, P = Number of phases in system
F = Number of variables that can be change
independently without effecting number of phases
C = Number of elements
2 = It represent any two variables amongst
temperature, pressure and composition
7. GIBB’S PHASE RULE
In general all equilibrium diagram studied at
constant pressure, hence Gibb’s phase rule is
modified to”
P + F = C + 1 ……….(II)
Phase rule helps to determine maximum
number of phase present in an alloy system
under equilibrium conditions at any point in
phase diagram.
The phase rule can also be used to determine
the degree of freedom that can be changed
8. GIBBS FREE ENERGY FOR THERMODYNAMIC
STABILITY OF PHASES
Gibb’s free energy for thermodynamic stability of
phases describes the amount of energy that released or
consumed when a phase is created from other phase.
Gibb’s free energy of formation ( Gf ) is relative
value allows us to compare energies of different
phases.
So by the conventions the value of Gf for pure
metal or element is assumed zero.
The phase having lowest value of Gibb’s phase
energy is a stable phase.
9. GIBBS FREE ENERGY FOR THERMODYNAMIC
STABILITY OF PHASES
Gibb’s free energy of any phase varies with the pressure
and temperature.
The fundamental relation between them is given as,
G = E + p V – T S
G = E + p V – T S
G= Gibb’s phase energy in J/mole
E= Internal energy in J/mole
P= Pressure in Pascal
V = volume in cm3/mole
T= Temperature in degree
S= Entropy is J/ deg-mole
10. GIBBS FREE ENERGY FOR THERMODYNAMIC
STABILITY OF PHASES
At high temperature phase with high entropy
are very stable because TS term in equation has
negative sign.
Similarly at high pressure, phase with high
volume are unstable because pV term has
positive sign.
The Gibb's free energy tells us whether a
reaction will takes place.
11. Solid solution and Compound
The element present in the alloy in the largest
portion is referred as base metal or parent metal or
solvent and the other elements are referred as
alloying element or solute.
Solid solution is a type of alloy in which the
atoms of alloying element are distributed in the
base metal and both have similar crystal structure.
The composition of alloying element may vary
but the structure should be similar to base metal.
12. Solid solution and Compound
Solid solution
Substitutional Interstitial
solid solution solid solution
Regular Random
Or Or
Ordered Disordered
13. 1) Substitutional solid solution
In substitutional solid solution, atoms of alloying
element occupy the atomic size of base metal.
They are further classified as:
(a) Regular or ordered substitutional solid solution:
()In this type, the substitution of atoms of
alloying element is in definite order in the base
metal matrix.
()Examples: Ni-Al solid solution below 400 C.
15. (b) Random or disordered substitutional solid
solution:
In this type, substitution of alloying elements is in
any random order in the base metal matrix.
Example: Alpha brass
Copper solvent
Zinc solute
16. (2) Interstitial solid solution:
In Interstitial solid solution, the atoms of alloying elements
occupy the interstitial sites of base metal.
This type of solution is formed when atomic size of alloying
element is much smaller compared to that of the base metal.
Example: Fe-C
Iron (solvent)
Carbon (solute)
17. Hume - Rothery’s Rules for Solid Solubility
Solid solution is an alloy of two or more
element wherein the atomic crystal structure of
alloying element (solute) is same as that of the
base metal matrix (solvent).
The solubility limit of the solute in the solvent
( of the alloying element in base metal matrix)
is governed by certain factors.
These governing factors are known as Hume-
Rothery’s rules for solid solubility.
These governing factor are as follows.
18. Hume - Rothery’s Rules for Solid Solubility
1. Atomic size:
.Alloying elements having similar atomic size as that of the
base metal matrix have better solid solubility.
. For a favorable solid solution formation, the difference of
atomic size of solute and solvent should be less than 15 %.
2. Chemical affinity:
.Element having lower chemical affinity have greater solid
solubility.
.Element having higher chemical affinity have the tendency
of formation of compound and hence restrict formation of
solid solution.
. In general, the alloy elements located closer in the periodic
table have higher solid solubility.
19. Hume - Rothery’s Rules for Solid Solubility
3. Relative valency:
Metals having lower valency have more solubility
for metals having higher valency.
Hence, for better solubility, the base metal
selected should be one that has lower valency as
compared to that of alloying elements.
4. Crystal structure:
As mentioned earlier, solid solution is an alloy of
element having similar crystal structure.
Difference in crystal structure limits the solid
solubility of elements.
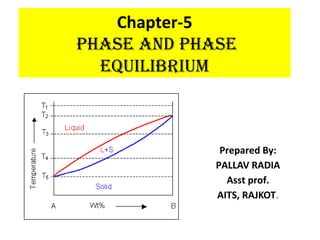
20. Cooling Curves
cooling curve is the graphical plot of phases
of element on temperature v/s time.
The resulting phase during solidification is
different for various alloy composition.
The most common coolingcurves are:
1. For pure metals
2. For binary solid solution(alloy)
3. For eutectic binary alloy
4. For off-eutectic binary alloy
22. Region AB represent liquid state, solidification starts
at B and continue until C, region CD represent solid
state.
Application of Gibb’s phase rule in various regions:
(1) Region AB
P + F = C + 1
1 + F = 1 + 1
Therefore, F = 1
Thus F = 1 means that only one variable i.e
temperature can be varied without changing the liquid
phase of the system.
23. (2) Region BC
P + F = C + 1
2 + F = 1 + 1
Therefore, F = 0
Thus F = 0 means that no variable amongst temperature and
pressure can be varied with out changing the Liquid + Solid phase of
system. If the temperature is increased the metal goes into liquid
state and if the temperature is lowered it goes into solid state.
(3) Region CD
P + F = C + 1
1 + F = 1 + 1
Therefore, F = 1
Thus F = 1 means that only one variable i.e temperature can be
varied without changing solid phase of system.
25. Region AB represent liquid state, solidification starts
at B and continue until C, region CD represent solid
state.
Application of Gibb’s phase rule in various regions:
(1) Region AB
P + F = C + 1
1 + F = 2 + 1
Therefore, F = 2
Thus F = 2 means any two variables temperature and
composition can be varied without effecting liquid
phase of the system.
26. (2) Region BC
P + F = C + 1
2 + F = 2 + 1
Therefore, F = 1
Thus F = 1 means that only one variable i.e temperature can
be varied without changing Liquid + Solid phase of system.
(3) Region CD
P + F = C + 1
1 + F = 2 + 1
Therefore, F = 2
Thus F = 2 means any two variables temperature and
composition can be varied without effecting solid phase of
the system.
27. 3.Cooling Curves for Eutectic binary alloy
L
F=2
Temperature c L+s1+s2
F=0
S1+S2
F=1
Time
28. Eutectic alloy is the one that undergoes eutectic reaction during
cooling.
Eutectic reaction can be stated as:
Liquid1 Constant Temperature Solid1 + Solid2
Thus, eutectic alloy when cooled forms two different solid phases.
Fig. shows typically cooling curve for binary eutectic alloy.
A binary eutectic alloy thus has two element which are completely
soluble in liquid state but entirely insoluble in the solid state.
Region AB represent liquid state, solidification starts at B and continue
until C, region CD represent solid state containing.
29. Application of Gibb’s phase rule in various regions:
(1) Region AB
P + F = C + 1
1 + F = 2 + 1
Therefore, F = 2
Thus F = 2 means any two variables temperature and composition can be varied
without effecting liquid phase of the system.
(2) Region BC
P + F = C + 1
3 + F = 2 + 1
Therefore, F = 0
Thus F = 0 means that no variable amongst temperature and pressure can be
varied with out changing the Liquid + Solid phase of system.
If the temperature is increased the metal goes into liquid state and if the
temperature is lowered it goes into solid state.
30. (3) Region CD
P + F = C + 1
2 + F = 2 + 1
Therefore, F = 1
Thus F = 1 means that only one variable i.e temperature
can be varied without changing solid state of system.
31. 4.Cooling Curves for off-Eutectic binary alloy
L
F=2 L+S1(or S2)
F=1
Temperature c L+s1+s2
F=0
S1+S2
F=1
Time
32. Eutectic reaction occurs for a definite composition and definite
temperature.
In the composition of alloy differs from the eutectic composition, it is
referred as off-eutectic alloy.
Off-eutectic alloys with composition less than eutecti composition are
called hypo-eutectic alloys and those with composition more than
eutectic composition are called hyper-eutectic alloys.
During cooling of off-eutectic alloy, either of the two solids separate out
earlier depending on whether the alloy is hypo or hyper eutectic alloy.
The pre-separated solid referred as pro-eutectic phase.
Fig. shows typically cooling curve for off-eutectic binary alloy.
Region AB represent liquid state, solidification starts at B , region BC
represent solidification either or, region CD represent solidification of
both and, region DE represent solid state of entire system.
33. Application of Gibb’s phase rule in various regions:
(1) Region AB
P + F = C + 1
1 + F = 2 + 1
Therefore, F = 2
Thus F = 2 means any two variables temperature and composition can be varied
without effecting liquid phase of the system.
(2) Region BC
In this region, either or start separating out by solidification.
P + F = C + 1
2 + F = 2 + 1
Therefore, F = 1
Thus F = 1 means that only one variable i.e temperature can be varied without the
solid state of the system.
34. (3) Region CD
In this region, the other starts separating out by solidification
P + F = C + 1
3 + F = 2 + 1
Therefore, F = 0
Thus F = 0 means that no variable amongst temperature and
composition can varied without changing the Liquid + Solid
state of the system.
(4) Region DE
P + F = C + 1
2 + F = 2 + 1
Therefore, F = 1
Thus F = 1 means that only one variable i.e temperature can
be varied without changing the Solid state of the system.
36. – Two metals of binary solid solution system are mixed in different portions,
melted and then cooled, and a cooling curve is constructed for each
composition.
– The phase diagram shows two distinct phases; one is liquid metal solution and
the other is solid solution.
– Liquidus is that line
– Above which the alloy is in liquid state
– Where solidification starts
– Solidus is that
– Below which the alloy is in solid state, and
– Where the solidification completes.
– If in a phase diagram, for each changes of phase, adequate time is allowed for
the change to complete so that phase change takes place under equilibrium
conditions, the phase diagram will be known as equilibrium phase diagram.
– Generally, equilibrium conditions are not attained during the solidification of
weld and casting, that results in porous, cored material which is usually of very
inhomogeneous composition.
37. • Coring or Dendritic Segregation:
– Coring or segregation is the non-uniform distribution of
constituents in a metal.
– Usually a concentration of certain constituents and/or impurities,
arising during freezing and generally instant throughout
subsequent operations, is known as segregation.
– A cored structure arises from a compositional gradient produced
within crystals of a solid solutions by progressive freezing.
Dendrites of a copper-tin alloy Ag-26%Sn-5%Cu : Cooled quickly after casting
38. • Interpretation of phase diagram
Following the three useful conclusions are the rules necessary for
interpreting phase diagram.
Rule -1 : Prediction of phases
Rule -2 : Phase Composition
Rule -3 : Lever arm principle
39. • Rule -1 : Prediction of phase
– Form a phase diagram, specific information cab be obtained only if
a temperature and a composition are specified.
– For example, the state of the alloy of composition 30% bismuth
can be determined only with reference to a certain temp.
– Thus when this alloy is at 1200°F, point 1 located and when it is at
900°F and 600°F, points 2 and 3 are located respectively.
– The next step is to determine the phase or phases present at
points number 1,2 and 3.
– Point -1 : with 30% Bi-70%Sb alloy at 1200°F, only one phase, i.e.,
the liquid solution is present.
– Point -2 : with the same alloy, but 900°F, two phases are present,
i.e., liquid solution and solid solution.
– Point -3 : with the same alloy, but 600°F, only one phase, i.e., the
solid solution is present.
40. • Rule -2 : Phase Composition
– To find out the composition of phases which are stable at given
temp. (say 900°F), draw a horizontal line, OP at the given temp.
– The projections of the intersections of the isothermal line with
the solidus and liquidus respectively, give the compositions of the
solid and liquid, which co-exist in equilibrium at the temp.
– Liquid phase (point – P) has the composition roughly 62%
bismuth.
– Solid phase (point - O) has the composition roughly 14% bismuth.
41. • Rule -3 : Lever Arm Principle
– Beside indicating the number of phases and phase composition the phase
diagram also tells the proportion of co-existing phases at any given temp.
– To determine the relative amount of two phases, erect an ordinate at a
point (say 30% Bi) on the composition scale which give the total or overall
composition of the alloy.
42. – The intersection of this composition vertical (AL) and a given
isothermal line OP (i.e., point M) is the fulcrum of a simple lever
system and OM and MP are two lever arms, The relative lengths
of the lever arms multiplied by the amounts of the phase present
must balance.
– the amount of a given phase multiplied by its lever arm is equal
to the amount of the other phase multiplied by its (i.e., other)
lever arm This is called the lever rule.
– It can also be seen that the proportion of solid corresponds to the
length of the segment adjacent to liquidus line, whereas the
fraction of liquid corresponds to the length of segment adjacent
to the solidus line. The isotherm (line OMP) can be considered as
a tie line, since it joins the composition of two phases in
equilibrium at a specific temperature.
– The lever rule or principle may be expressed mathematically as:
43. 1) Say at point “Q” in (Liquid + Solid) region in a
phase diagram, a line passing through point “Q”
and parallel to the base is drawn. The line
intersects the liquidus and solidus at points P
and R respectively. Can you determine %Solid at
point Q if PR is 6 cm and QR is 2.4 cm in length?
If answer is YES, determine % Solid and if NO,
justify your answer.
44. • CLASSIFICATION OF EQUILIBRIUM DIAGRAMS
– An equilibrium diagram has been defined as a plot of the com-position of
phases as a function of temperature in any alloy system under equilibrium
conditions.
– Equilibrium diagrams may be classified according to the relation of the
components in the liquid and solid states as follows:
– Components completely soluble in the liquid state,
1. and also completely soluble in the solid state,
2. but partly soluble in the solid state (EUTECTIC REACTION).
3. but insoluble in the solid state (EUTECTIC REACTION).
4. The PERITECTIC Reaction
– Components partially soluble in the liquid state,
1. but completely soluble in the solid state.
2. and partly soluble in the solid state.
– Components completely insoluble in the liquid state and completely insoluble in
the solid state.
– A study of these diagrams will illustrate basic principles which may be
applied to understand and interpret more complex alloy systems
45. • TWO METALS COMPLETELY SOLUBLE IN THE LIQUID AND
SOLID STATES
– A system that illustrates an equilibrium diagram in which there is
complete solubility in the liquid and solid states is that of the Antimony-
Bismuth system.
– Examples of other such systems are Ni-Cu, Au-Ag, Cr-Mo and W-Mo.
– Since the two metals (such as Sb and Bi or Ni and Cu, etc.) are completely
soluble in the solid state, the only type of solid phase formed will be a
substitutional solid solution.
– the equilibrium diagram consists of two lines only— the liquidus and
solidus.
– Above the liquidus there Is a uniform liquid solution for any alloy in the
series, while below the solidus there is a single solid solution of any alloy.
– Between the liquidus and solidus, both liquid and solid solutions co-exist.
46. – Consider an alloy containing 30% Bismuth and 70% Antimony .As the liquid
alloy cools, the freezing starts at about 1080°F (582°C) (liquidus line).
– The composition of the solid formed and liquid at any point say 2(M) can be
found from the equilibrium diagram as explained under section.
– As cooling continues, a stage (i.e., point N) reaches when the whole mass is
solid and further cooling will bring the solid to the room temperature.
47. – Actually the solidification of a liquid alloy of this type consists of
two processes:
I. a) Formation of crystals in the melt (at say point S),
b) Growth of crystals (just as at point M).
II. Homogenization of the composition in various parts of each
crystal
a) By diffusion between core and encasement.
b) By diffusion between core and melt.
48. • EUTECTIC SYSTEM
– In an eutectic reaction, when a liquid solution of fixed composi-
tion, solidifies at a constant temperature, forms a mixture of two or
more solid phases without an intermediate pasty stage. This
process reverses on heating.
– In eutectic system, there is always a specific alloy, known as
eutectic composition, that freezes at a lower temperature than all
other compositions.
– At the eutectic temperature, two solids form simultaneously from a
single liquid phase.
– The eutectic temperature and composition determine a point on
the phase diagram called the eutectic point.
49. – Binary alloy eutectic system can be classed as:
1. One in which, two metals are completely soluble in the liquid
state but are insoluble in each other in the solid state.
2. two metals are completely soluble in the liquid state but are
partly soluble in each other in the solid state.
50. 1. Two metals completely soluble in the liquid state but
completely insoluble in the solid state.
– Technically, no two metals are completely insoluble in each
other. However, in some cases the solubility is so restricted that
for practical purposes they may be considered insoluble.
51.
52. • Alloy-3: 80% Cd and 20% Bismuth.
– As the temperature falls to T1, crystal nuclei of pure Cd begin to
form. Since pure Cd is deposited, it follows that the liquid
becomes richer in Bi; the composition of liquid move s to left 3’
and as indicated by the diagram, no further Cd deposits until
temperature falls to T2.
– At T2 more Cd is deposited and dendrites begin to develop from
the already formed nuclei.
– The growth of the Cd dendrites, on the one hand, and the
consequent enrichment of the remaining liquid in Bi, on the
other, continues until the temperature has fallen to 140°C, the
eutectic temperature in this case.
– The remaining liquid then contains 40% Cd and 60% Bi, the
eutectic composition.
53. • Alloy-1: 20% Cd and 80% Bi
– Contrary to alloy 3, in this case crystal of pure Bi form first, enriching
the melt with Cd.
– The composition of the melt (or liquid) moves to right until Ultimately
the point E is reached and the remaining liquid solidi-fies as eutectic
(40% Cd and 60% Bi).
• Alloy-2: 40% Cd and 60% Bi (eutectic alloy)
– No solidification occurs until the melt reaches the eutectic
temperature (140°)
– At the eutectic temperature, the two pure metals crystallize together
to give a characteristically line aggregate known as eutectic.
– Eutectic consists of alternate layers of Cd and Bi which form at the
eutectic temperature (140°C in this case).
54. EX. The following data is for Pb-Sn alloy system : (Lead-Tin Solder)
Melting point of lead (Pb) - 327ºC
Melting point of Tin (Sn) - 232ºC
Eutectic alloy is formed at 183ºC with 62% Sn –38% Pb
Maximum solid solubility of tin in lead at 183ºC –19%
Maximum solid solubility of lead in tin at 183ºC –3%
Maximum solubility of tin and lead at room temperature is negligible.
(1) Draw the phase diagram with the help of above data and label all
the points, lines and regions on it.
(2) For 70%Pb – 30%Sn alloy composition, determine the amounts of
proeutectic and eutectic constituents at room temperature.
55. 2. Two metals completely soluble in the liquid state, but only
partly soluble in the solid state
56. – Since most metals show some solubility for each other in the solid
state, this type is the most common and, therefore, the most
common alloy system.
– Metals such as Pb-Sn and Pb-Sb are partly soluble in each other in
the solid state.
– Fig. shows the Tin-Lead equilibrium diagram with micro-structures
(of course) obtained under non-equilibrium condition of
solidification.
I. Tin will dissolve up to maximum of 2.6% Pb at the temperature,
forming the solid solution α.
II. Lead will dissolve up to a maximum of (100-80.5) i.e. 19 .5% tin at
the eutectic temperature, giving the solid solution β.
III. Slope of BA and CD indicate that the solubility of Pb in Sn (α) and
that of Sn in Pb (β) decrease as temperature falls
–.Consider an alloy of composition Z (70% Pb-30% Sn). As the melt
temperature falls to T1, dendrites of composition Y will deposit.
57. – The alloy solidifies as a solid solution until at 183°C, the last layer of
solid to form is of composition C (80.5% Pb-19.5% Sn).
– The remaining liquid which has the eutectic composition (38% Pb-62%
Sn) then solidifies by depositing, in the form of a eutectic, i.e.,
alternate layers of α and β, of compositions B and C respectively.
– If cooled slowly to room temperature the compositions of the solid
solutions α and β will follow the line BA and CD, i.e., α will become
progressively poorer in lead and β in tin.
– Take another alloy of composition Z' (95% Pb-5% Sn). When cooled
slowly, solidification starts at R and is complete at P, the resultant
solid being a homogeneous single phase, the β solid solution.
– As the alloy cools, the solvus line is reached at point Q. The β solution
is now saturated in tin. Below this temperature, under conditions of
slow cooling, the excess tin must come out of solution. Since tin is
soluble in lead, the precipitate does not come out as the pure metal
tin, but rather the α solid solution.
59. – It is the reaction that occurs during the solidification of some
alloys where the liquid phase reacts with a solid phase to give a
solid phase of different structure.
– Assuming very slow rates of cooling, the peritectic reaction will
occur only in those Pt-Ag alloys that Contain between 12 and 69%
silver (Ag).
– Consider a liquid (melt) of composition Z, i.e., containing 25% Ag.
Solidification commences at T1 and dendrites of α, initially of
composition W, begin forming.
– Selective crystallization of α continues down to Tp, the peritectic
temperature; when the alloy reaches. this temperature, it is
composed of solid α-dendrites of composition B and liquid of
composition D in the proportion α : liquid = RD : RB.
60. • Eutectoid Transformation:
– Eutectoid reaction is an isothermal reversible reaction in which a
solid phase (usually solid solution) is converted into two or more
intimately mixed solids on cooling, the number of solids formed
being the same as the number of component in the system.