Downloaded 100 times

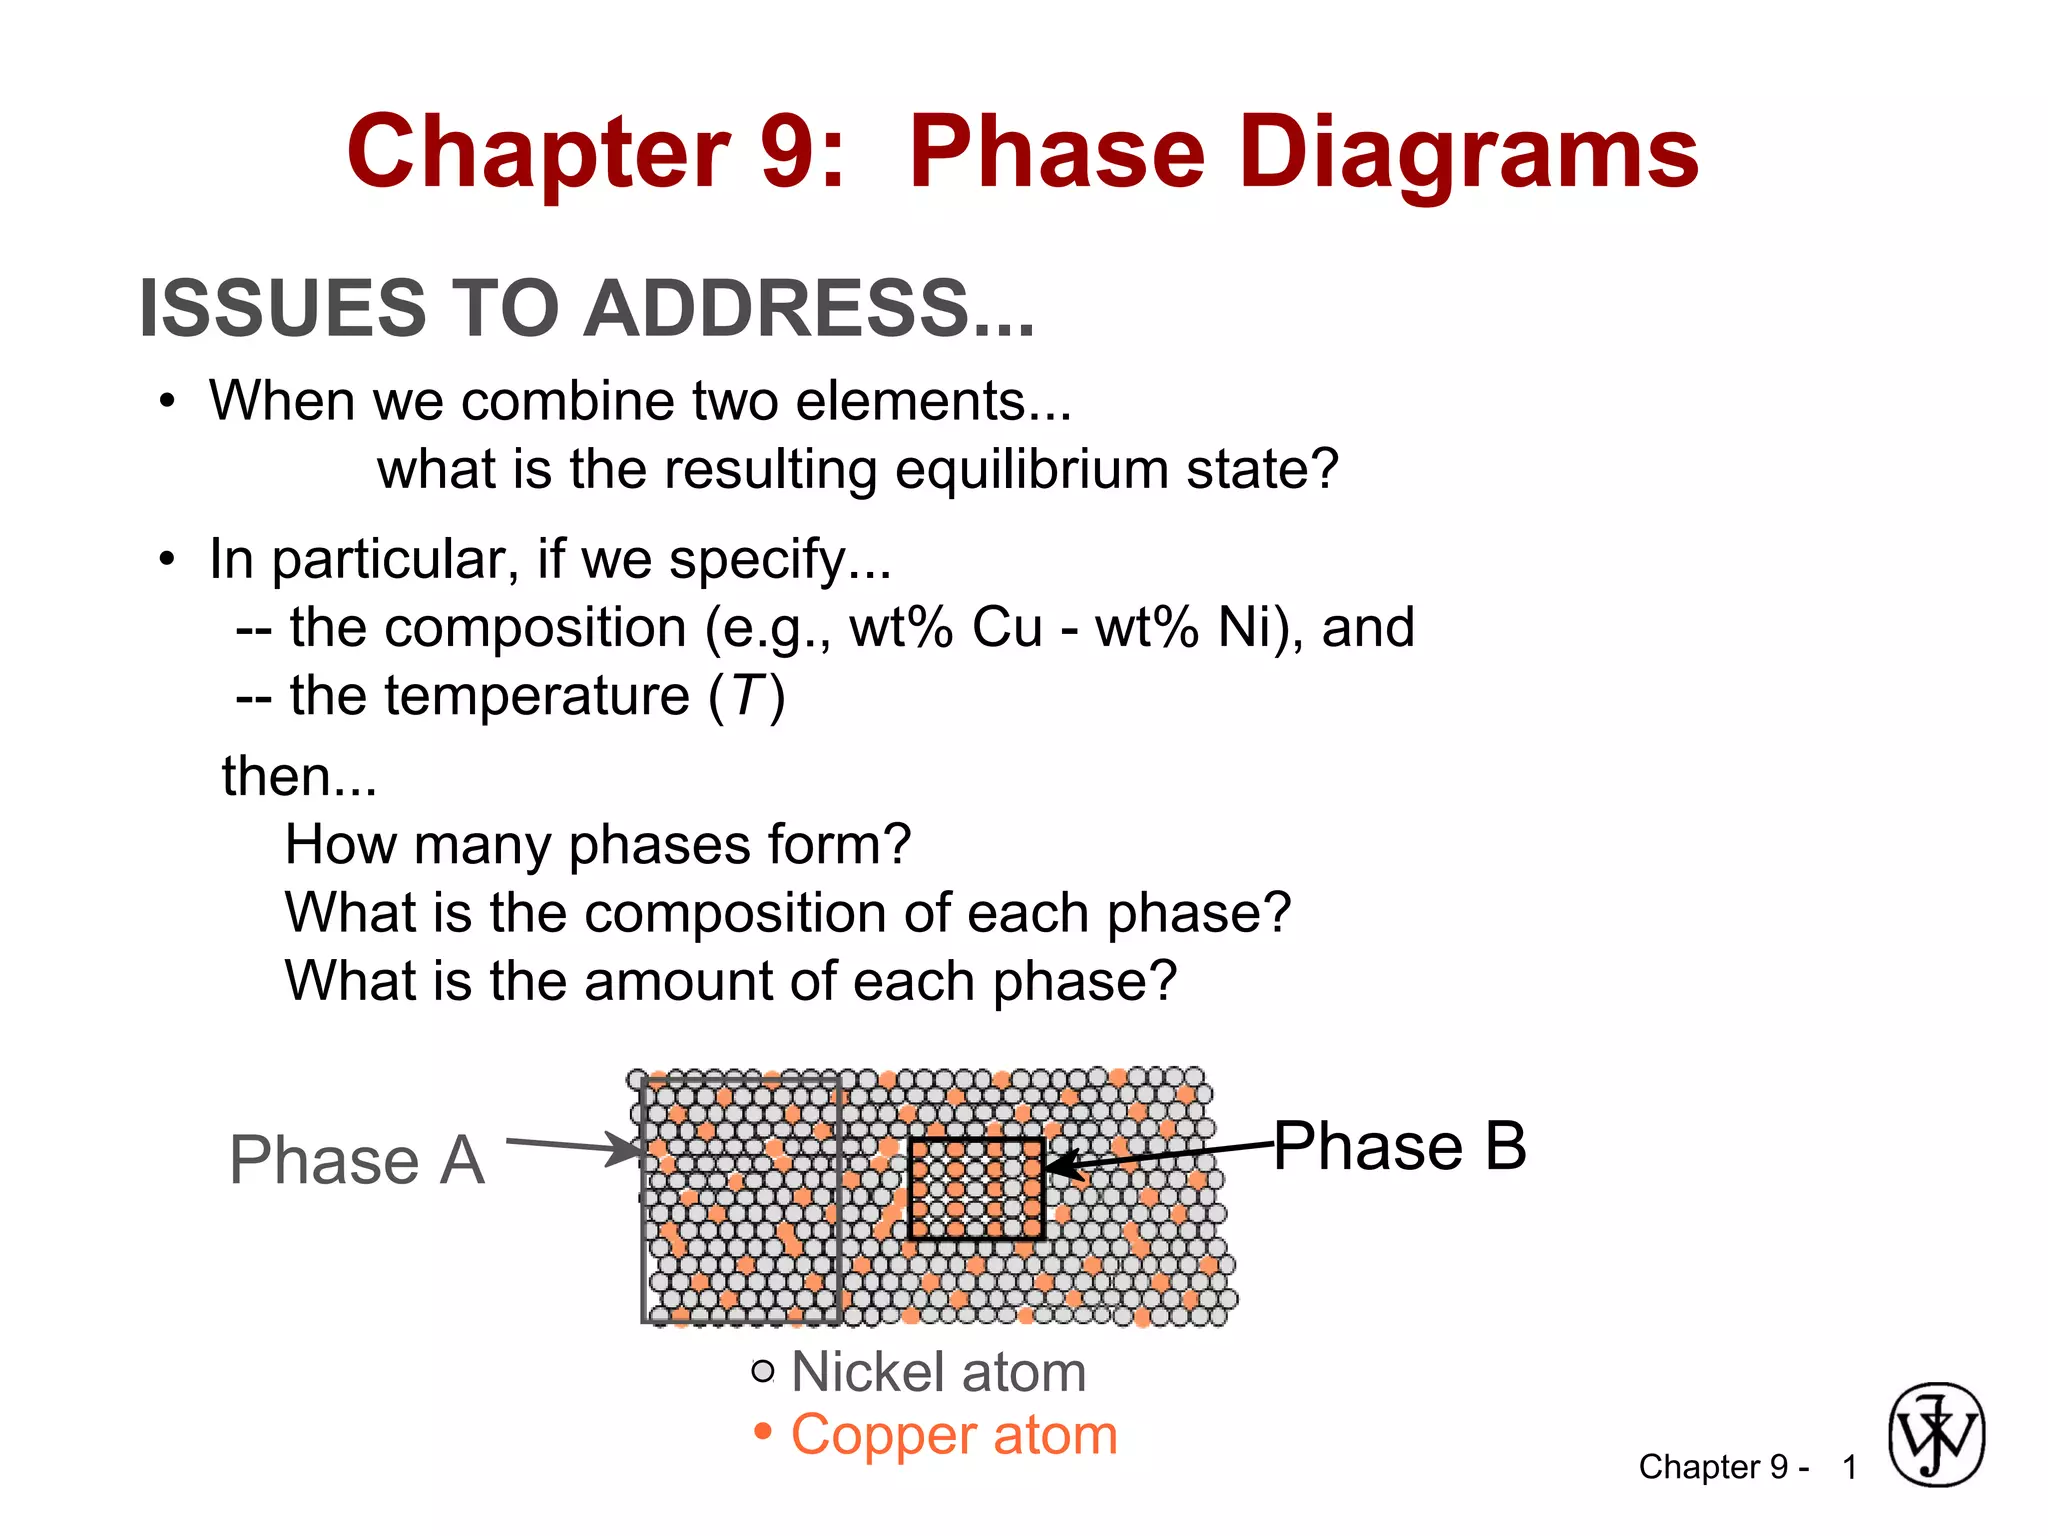
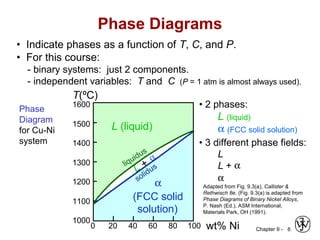
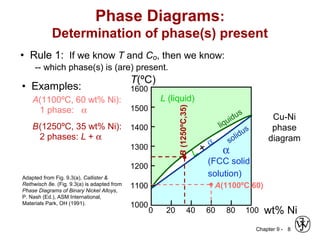
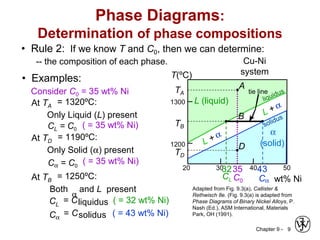
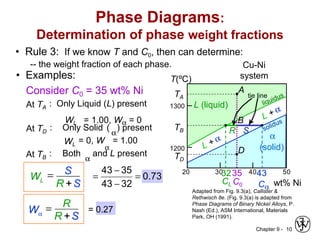
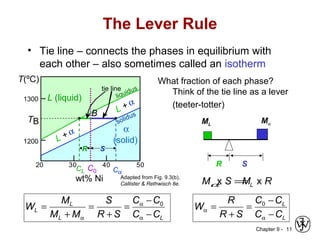
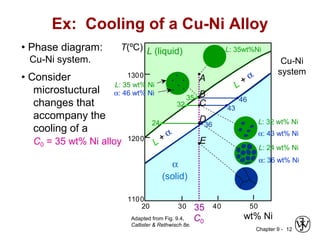
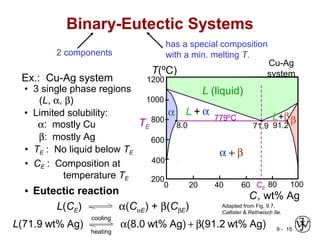
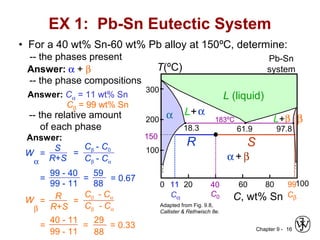
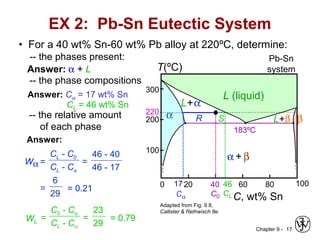
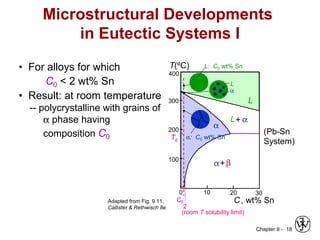
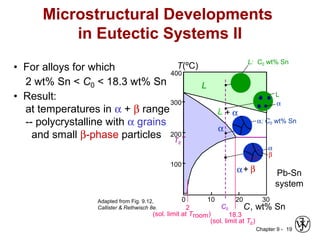
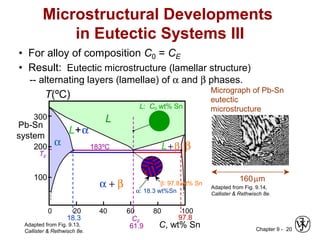
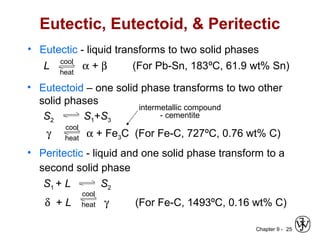
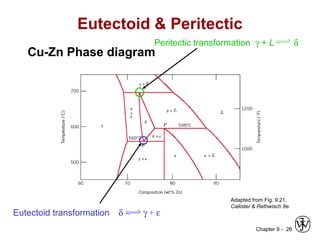
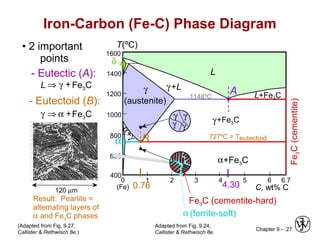
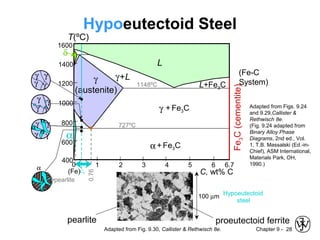
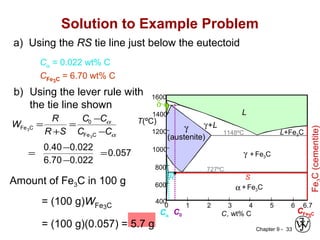
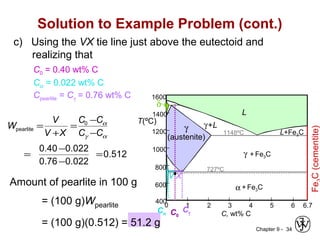
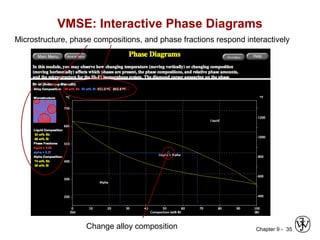

This document discusses phase diagrams and microstructures in binary alloy systems. It begins by outlining key questions that can be addressed using phase diagrams, such as the phases present at a given temperature and composition. It then provides examples of using a Cu-Ni phase diagram to determine phase compositions and fractions. The document discusses eutectic systems and uses a Pb-Sn phase diagram to solve examples determining phase properties. It concludes by describing microstructures that form in the Pb-Sn system depending on alloy composition.


![Ch07[1]](https://cdn.slidesharecdn.com/ss_thumbnails/ch071-141226001133-conversion-gate01-thumbnail.jpg?width=640&height=640&fit=bounds)


![10[1].Phase Diagrams.ppt](https://cdn.slidesharecdn.com/ss_thumbnails/101-221009051328-479a8439-thumbnail.jpg?width=640&height=640&fit=bounds)


