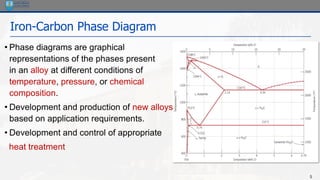
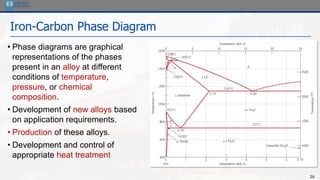
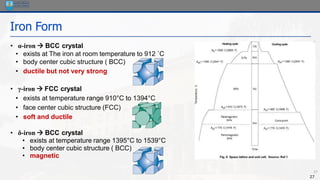
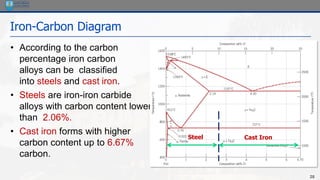
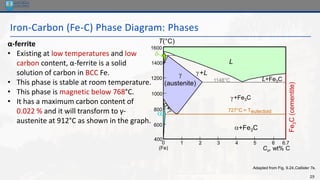
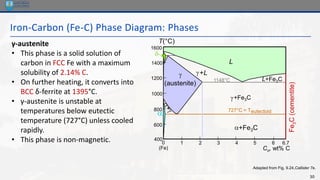
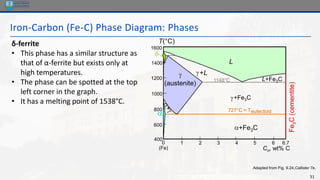
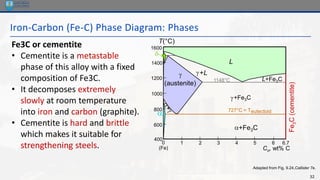
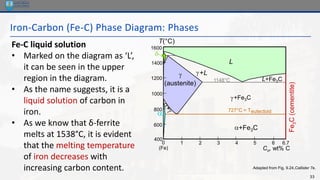
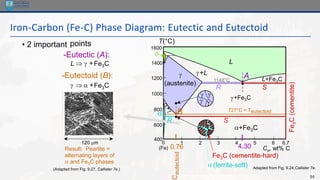
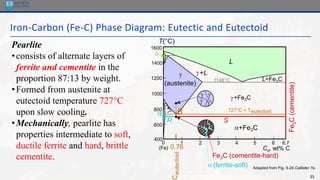
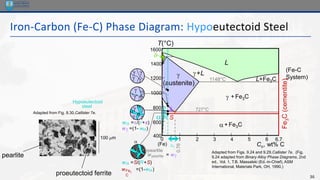
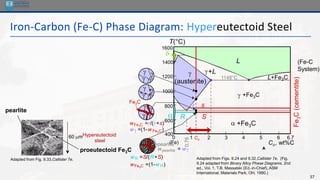
SlideShare a Scribd company logo
MEC121
Manufacturing
Technology
Iron-Carbon Diagram
Dr. Dalia Nabil
2
Intended Learning Outcomes
• Revise phase diagrams
• Understand the Iron-Carbon phase diagram
• Understand the effect of adding or increasing carbon % to Iron.
2
3
Contents
• Introduction
• Phase Diagram Revision
•Solubility limits
•Binary systems
•Binary Eutectic systems
• Iron-Carbon Phase Diagram
4
Steel making
5
Iron-Carbon Phase Diagram
• Phase diagrams are graphical
representations of the phases present
in an alloy at different conditions of
temperature, pressure, or chemical
composition.
• Development and production of new alloys
based on application requirements.
• Development and control of appropriate
heat treatment
6
Contents
• Introduction
• Phase Diagram Revision
•Solubility limits
•Binary systems
•Binary Eutectic systems
• Iron-Carbon Phase Diagram
7
Solubility Limit
Solutions: solid solutions, single phase
Mixtures: more than one phase
Solubility Limit:
Max concentration for which only a single-phase solution
occurs.
Question: What is the solubility limit at 20°C?
Answer: 65 wt% sugar.
If Co < 65 wt% sugar: syrup
If Co > 65 wt% sugar: syrup + sugar.
65
Sucrose/Water Phase Diagram
Pure
Sugar
Temperature
(°C)
0 20 40 60 80 100
Co =Composition (wt% sugar)
L
(liquid solution
i.e., syrup)
Solubility
Limit L
(liquid)
+
S
(solid
sugar)
20
40
60
80
100
Pure
Water
Adapted from Fig. 9.1,
Callister 7e.
8
Effect of T & Composition (Co)
• Changing T can change # of phases:
Adapted from
Fig. 9.1,
Callister 7e.
D (100°C,90)
2 phases
B (100°C,70)
1 phase
path A to B.
• Changing Co can change # of phases: path B to D.
A (20°C,70)
2 phases
70 80 100
60
40
20
0
Temperature
(°C)
Co =Composition (wt% sugar)
L
(liquid solution
i.e., syrup)
20
100
40
60
80
0
L
(liquid)
+
S
(solid
sugar)
water-
sugar
system
9
Contents
• Introduction
• Phase Diagram Revision
•Solubility limits
•Binary systems
•Binary Eutectic systems
• Iron-Carbon Phase Diagram
10
Phase Diagrams: Binary Systems
• Indicate phases as function of T, Co, and P.
-binary systems: just 2 components.
-independent variables: T and Co (P = 1 atm is almost always used).
• Phase Diagram for Cu-Ni system
Adapted from Fig. 9.3(a), Callister 7e.
(Fig. 9.3(a) is adapted from Phase
Diagrams of Binary Nickel Alloys, P. Nash
(Ed.), ASM International, Materials Park,
OH (1991).
• 2 phases:
L (liquid)
a (FCC solid solution)
• 3 phase fields:
L
L + a
a
wt% Ni
20 40 60 80 100
0
1000
1100
1200
1300
1400
1500
1600
T(°C)
L (liquid)
a
(FCC solid
solution)
11
Phase Diagrams: Binary Systems
11
wt% Ni
20 40 60 80 100
0
1000
1100
1200
1300
1400
1500
1600
T(°C)
L (liquid)
a
(FCC solid
solution)
Cu-Ni
phase
diagram
• Rule 1: If we know T and Co, then we know:
--the # and types of phases present.
• Examples:
A(1100°C, 60):
1 phase: a
B(1250°C, 35):
2 phases: L + a
Adapted from Fig. 9.3(a), Callister 7e.
(Fig. 9.3(a) is adapted from Phase
Diagrams of Binary Nickel Alloys, P. Nash
(Ed.), ASM International, Materials Park,
OH, 1991).
B
(1250°C,35)
A(1100°C,60)
12
Phase Diagrams: Binary Phases
wt% Ni
20
1200
1300
T(°C)
L (liquid)
a
(solid)
30 40 50
Cu-Ni
system
• Rule 2: If we know T and Co, then we know:
--the composition of each phase.
• Examples:
TA
A
35
Co
32
CL
At TA = 1320°C:
Only Liquid (L)
CL = Co ( = 35 wt% Ni)
At TB = 1250°C:
Both a and L
CL = Cliquidus ( = 32 wt% Ni here)
Ca = Csolidus ( = 43 wt% Ni here)
At TD = 1190°C:
Only Solid ( a)
Ca = Co ( = 35 wt% Ni)
Co = 35 wt% Ni
Adapted from Fig. 9.3(b), Callister 7e.
(Fig. 9.3(b) is adapted from Phase Diagrams
of Binary Nickel Alloys, P. Nash (Ed.), ASM
International, Materials Park, OH, 1991.)
B
TB
D
TD
tie line
4
Ca
3
13
Phase Diagrams: Binary Systems
• Rule 3: If we know T and Co, then we know:
--the amount of each phase (given in wt%).
• Examples:
At TA: Only Liquid (L)
WL = 100 wt%, Wa = 0
At TD: Only Solid ( a)
WL = 0, Wa = 100 wt%
Co = 35 wt% Ni
Adapted from Fig. 9.3(b), Callister 7e.
(Fig. 9.3(b) is adapted from Phase Diagrams of
Binary Nickel Alloys, P. Nash (Ed.), ASM
International, Materials Park, OH, 1991.)
wt% Ni
20
1200
1300
T(°C)
L (liquid)
a
(solid)
30 40 50
Cu-Ni
system
TA
A
35
Co
32
CL
B
TB
D
TD
tie line
4
Ca
3
R S
At TB: Both a and L
%
73
32
43
35
43
wt
=
−
−
=
= 27 wt%
WL
= S
R +S
Wa
= R
R +S
14
Phase Diagrams: Binary Systems
wt% Ni
20
1200
1300
30 40 50
110 0
L (liquid)
a
(solid)
T(°C)
A
35
Co
L: 35wt%Ni
Cu-Ni
system
• Phase diagram:
Cu-Ni system.
• System is:
--binary
i.e., 2 components:
Cu and Ni.
--isomorphous
i.e., complete
solubility of one
component in
another; a phase
field extends from
0 to 100 wt% Ni.
Adapted from Fig. 9.4,
Callister 7e.
• Consider
Co = 35 wt%Ni.
46
35
43
32
a: 43 wt% Ni
L: 32 wt% Ni
L: 24 wt% Ni
a: 36 wt% Ni
B
a: 46 wt% Ni
L: 35 wt% Ni
C
D
E
24 36
15
Mechanical Properties: Cu-Ni System
• Effect of solid solution strengthening on:
--Tensile strength (TS) --Ductility (%EL)
--Peak as a function of Co --Min. as a function of Co
Adapted from Fig. 9.6(a), Callister 7e. Adapted from Fig. 9.6(b), Callister 7e.
Tensile
Strength
(MPa)
Composition, wt% Ni
Cu Ni
0 20 40 60 80 100
200
300
400
TS for
pure Ni
TS for pure Cu
Elongation
(%EL)
Composition, wt% Ni
Cu Ni
0 20 40 60 80 100
20
30
40
50
60
%EL for
pure Ni
%EL for pure Cu
16
Contents
• Introduction
• Phase Diagram Revision
•Solubility limits
•Binary systems
•Binary Eutectic systems
• Iron-Carbon Phase Diagram
17
Phase Diagrams: Binary-Eutectic Systems
: Min. melting TE
2 components
has a special composition
with a min. melting T.
Adapted from Fig. 9.7,
Callister 7e.
• Eutectic transition
L(CE) a(CaE) + (CE)
• 3 single phase regions
(L, a, )
• Limited solubility:
a: mostly Cu
: mostly Ag
• TE : No liquid below TE
• CE
composition
Ex.: Cu-Ag system
Cu-Ag
system
L (liquid)
a L + a
L+
a + 
Co , wt% Ag
20 40 60 80 100
0
200
1200
T(°C)
400
600
800
1000
CE
TE 8.0 71.9 91.2
779°C
18
Phase Diagrams: Binary-Eutectic Systems
L+a
L+
a + 
200
T(°C)
18.3
C, wt% Sn
20 60 80 100
0
300
100
L (liquid)
a 183°C
61.9 97.8

• For a 40 wt% Sn-60 wt% Pb alloy at 150°C, find...
--the phases present:
Pb-Sn
system
a + 
--compositions of phases:
CO = 40 wt% Sn
--the relative amount
of each phase:
150
40
Co
11
Ca
99
C
S
R
Ca = 11 wt% Sn
C = 99 wt% Sn
Wa=
C - CO
C - Ca
=
99 - 40
99 - 11
=
59
88
= 67 wt%
S
R+S
=
W =
CO - Ca
C - Ca
=
R
R+S
=
29
88
= 33 wt%
=
40 - 11
99 - 11
Adapted from Fig. 9.8,
Callister 7e.
EX: Pb-Sn Eutectic System (1)
19
EX: Pb-Sn Eutectic System (2)
L+
a + 
200
T(°C)
C, wt% Sn
20 60 80 100
0
300
100
L (liquid)
a 
L+a
183°C
• For a 40 wt% Sn-60 wt% Pb alloy at 200°C, find...
--the phases present: Pb-Sn
system
Adapted from Fig. 9.8,
Callister 7e.
a + L
--compositions of phases:
CO = 40 wt% Sn
--the relative amount
of each phase:
Wa =
CL - CO
CL - Ca
=
46 - 40
46 - 17
=
6
29
= 21 wt%
WL =
CO - Ca
CL - Ca
=
23
29
= 79 wt%
40
Co
46
CL
17
Ca
220
S
R
Ca = 17 wt% Sn
CL = 46 wt% Sn
20
Microstructures in Eutectic Systems
• Co = CE
• Result: Eutectic microstructure (lamellar structure)
--alternating layers (lamellae) of a and  crystals.
Adapted from Fig. 9.13,
Callister 7e.
Adapted from Fig. 9.14, Callister 7e.
160m
Micrograph of Pb-Sn
eutectic
microstructure
Pb-Sn
system
L+
a + 
200
T(°C)
C, wt% Sn
20 60 80 100
0
300
100
L
a 
L+a
183°C
40
TE
18.3
a: 18.3 wt%Sn
97.8
: 97.8 wt% Sn
CE
61.9
L: Co wt% Sn
Microstructures in Eutectic Systems:
21
Lamellar Eutectic Structure
Adapted from Figs. 9.14 & 9.15, Callister
7e.
22
Hypoeutectic & Hypereutectic
L+a
L+
a + 
200
Co, wt% Sn
20 60 80 100
0
300
100
L
a 
TE
40
(Pb-Sn
System)
Adapted from Fig. 9.8,
Callister 7e. (Fig. 9.8
adapted from Binary Phase
Diagrams, 2nd ed., Vol. 3,
T.B. Massalski (Editor-in-
Chief), ASM International,
Materials Park, OH, 1990.)
160 m
eutectic micro-constituent
hypereutectic: (illustration only)






Adapted from Fig. 9.17,
Callister 7e. (Illustration
only)
(Figs. 9.14 and 9.17
from Metals
Handbook, 9th ed.,
Vol. 9,
Metallography and
Microstructures,
American Society for
Metals, Materials
Park, OH, 1985.)
175 m
a
a
a
a
a
a
hypoeutectic: Co = 50 wt% Sn
T(°C)
61.9
eutectic
eutectic: Co =61.9wt% Sn
23
Eutectoid & Peritectic
Adapted from
Fig. 9.21, Callister 7e.
Eutectoid transition   + 
Peritectic transition  + L 
• Eutectoid - solid phase in equation
with two solid phases
S2 S1+S3
• Peritectic - liquid + solid 1 → solid 2
S1 + L S2
• Eutectic - liquid in equilibrium with two solids
L a + 
cool
heat
Cu-Zn Phase diagram
24
Contents
• Introduction
• Phase Diagram Revision
•Solubility limits
•Binary systems
•Binary Eutectic systems
• Iron-Carbon Phase Diagram
25
Steel making
2
26
Iron-Carbon Phase Diagram
• Phase diagrams are graphical
representations of the phases
present in an alloy at different
conditions of temperature,
pressure, or chemical
composition.
• Development of new alloys based
on application requirements.
• Production of these alloys.
• Development and control of
appropriate heat treatment
27
Iron Form
• α-iron → BCC crystal
• exists at The iron at room temperature to 912 ˚C
• body center cubic structure ( BCC)
• ductile but not very strong
• γ-iron → FCC crystal
• exists at temperature range 910°C to 1394°C
• face center cubic structure (FCC)
• soft and ductile
• δ-iron → BCC crystal
• exists at temperature range 1395°C to 1539°C
• body center cubic structure ( BCC)
• magnetic
27
28
Iron-Carbon Diagram
• According to the carbon
percentage iron carbon
alloys can be classified
into steels and cast iron.
• Steels are iron-iron carbide
alloys with carbon content lower
than 2.06%.
• Cast iron forms with higher
carbon content up to 6.67%
carbon.
Cast Iron
Steel
29
Iron-Carbon (Fe-C) Phase Diagram: Phases
Adapted from Fig. 9.24,Callister 7e.
Fe
3
C
(cementite)
1600
1400
1200
1000
800
600
400
0 1 2 3 4 5 6 6.7
L

(austenite)
+L
+Fe3C
a+Fe3C
L+Fe3C

(Fe) Co, wt% C
1148°C
T(°C)
a 727°C = Teutectoid
α-ferrite
• Existing at low temperatures and low
carbon content, α-ferrite is a solid
solution of carbon in BCC Fe.
• This phase is stable at room temperature.
• This phase is magnetic below 768°C.
• It has a maximum carbon content of
0.022 % and it will transform to γ-
austenite at 912°C as shown in the graph.
30
Iron-Carbon (Fe-C) Phase Diagram: Phases
Adapted from Fig. 9.24,Callister 7e.
Fe
3
C
(cementite)
1600
1400
1200
1000
800
600
400
0 1 2 3 4 5 6 6.7
L

(austenite)
+L
+Fe3C
a+Fe3C
L+Fe3C

(Fe) Co, wt% C
1148°C
T(°C)
a 727°C = Teutectoid
γ-austenite
• This phase is a solid solution of
carbon in FCC Fe with a maximum
solubility of 2.14% C.
• On further heating, it converts into
BCC δ-ferrite at 1395°C.
• γ-austenite is unstable at
temperatures below eutectic
temperature (727°C) unless cooled
rapidly.
• This phase is non-magnetic.
31
Iron-Carbon (Fe-C) Phase Diagram: Phases
Adapted from Fig. 9.24,Callister 7e.
Fe
3
C
(cementite)
1600
1400
1200
1000
800
600
400
0 1 2 3 4 5 6 6.7
L

(austenite)
+L
+Fe3C
a+Fe3C
L+Fe3C

(Fe) Co, wt% C
1148°C
T(°C)
a 727°C = Teutectoid
δ-ferrite
• This phase has a similar structure as
that of α-ferrite but exists only at
high temperatures.
• The phase can be spotted at the top
left corner in the graph.
• It has a melting point of 1538°C.
32
Iron-Carbon (Fe-C) Phase Diagram: Phases
Adapted from Fig. 9.24,Callister 7e.
Fe
3
C
(cementite)
1600
1400
1200
1000
800
600
400
0 1 2 3 4 5 6 6.7
L

(austenite)
+L
+Fe3C
a+Fe3C
L+Fe3C

(Fe) Co, wt% C
1148°C
T(°C)
a 727°C = Teutectoid
Fe3C or cementite
• Cementite is a metastable
phase of this alloy with a fixed
composition of Fe3C.
• It decomposes extremely
slowly at room temperature
into iron and carbon (graphite).
• Cementite is hard and brittle
which makes it suitable for
strengthening steels.
33
Iron-Carbon (Fe-C) Phase Diagram: Phases
Adapted from Fig. 9.24,Callister 7e.
Fe
3
C
(cementite)
1600
1400
1200
1000
800
600
400
0 1 2 3 4 5 6 6.7
L

(austenite)
+L
+Fe3C
a+Fe3C
L+Fe3C

(Fe) Co, wt% C
1148°C
T(°C)
a 727°C = Teutectoid
Fe-C liquid solution
• Marked on the diagram as ‘L’,
it can be seen in the upper
region in the diagram.
• As the name suggests, it is a
liquid solution of carbon in
iron.
• As we know that δ-ferrite
melts at 1538°C, it is evident
that the melting temperature
of iron decreases with
increasing carbon content.
34
Iron-Carbon (Fe-C) Phase Diagram: Eutectic and Eutectoid
• 2 important points
-Eutectoid (B):
  a +Fe3C
-Eutectic (A):
L   +Fe3C
Adapted from Fig. 9.24,Callister 7e.
Fe
3
C
(cementite)
1600
1400
1200
1000
800
600
400
0 1 2 3 4 5 6 6.7
L

(austenite)
+L
+Fe3C
a+Fe3C
L+Fe3C

(Fe) Co, wt% C
1148°C
T(°C)
a 727°C = Teutectoid
A
S
R
4.30
Result: Pearlite =
alternating layers of
a and Fe3C phases
120 m
(Adapted from Fig. 9.27, Callister 7e.)
 


R S
0.76
C
eutectoid
B
Fe3C (cementite-hard)
a (ferrite-soft)
35
Iron-Carbon (Fe-C) Phase Diagram: Eutectic and Eutectoid
Adapted from Fig. 9.24,Callister 7e.
Fe
3
C
(cementite)
1600
1400
1200
1000
800
600
400
0 1 2 3 4 5 6 6.7
L

(austenite)
+L
+Fe3C
a+Fe3C
L+Fe3C

(Fe) Co, wt% C
1148°C
T(°C)
a 727°C = Teutectoid
 


R S
0.76
C
eutectoid
B
Fe3C (cementite-hard)
a (ferrite-soft)
Pearlite
•consists of alternate layers of
ferrite and cementite in the
proportion 87:13 by weight.
•Formed from austenite at
eutectoid temperature 727°C
upon slow cooling.
•Mechanically, pearlite has
properties intermediate to soft,
ductile ferrite and hard, brittle
cementite.
36
Iron-Carbon (Fe-C) Phase Diagram: Hypoeutectoid Steel
Adapted from Figs. 9.24 and 9.29,Callister 7e. (Fig.
9.24 adapted from Binary Alloy Phase Diagrams, 2nd
ed., Vol. 1, T.B. Massalski (Ed.-in-Chief), ASM
International, Materials Park, OH, 1990.)
Fe
3
C
(cementite)
1600
1400
1200
1000
800
600
400
0 1 2 3 4 5 6 6.7
L

(austenite)
+L
 +Fe3C
a+Fe3C
L+Fe3C

(Fe) Co, wt% C
1148°C
T(°C)
a
727°C
(Fe-C
System)
C0
0.76
Adapted from Fig. 9.30,Callister 7e.
proeutectoid ferrite
pearlite
100 m
Hypoeutectoid
steel
R S
a
wa =S/(R+S)
wFe3
C
=(1-wa)
wpearlite = w
pearlite
r s
wa =s/(r+s)
w =(1- wa)

 

a
a
a


 
 


37
Iron-Carbon (Fe-C) Phase Diagram: Hypereutectoid Steel
Fe
3
C
(cementite)
1600
1400
1200
1000
800
600
400
0 1 2 3 4 5 6 6.7
L

(austenite)
+L
 +Fe3C
a +Fe3C
L+Fe3C

(Fe) Co, wt%C
1148°C
T(°C)
a
Adapted from Figs. 9.24 and 9.32,Callister 7e. (Fig.
9.24 adapted from Binary Alloy Phase Diagrams, 2nd
ed., Vol. 1, T.B. Massalski (Ed.-in-Chief), ASM
International, Materials Park, OH, 1990.)
(Fe-C
System)
0.76
Co
Adapted from Fig. 9.33,Callister 7e.
proeutectoid Fe3C
60 mHypereutectoid
steel
pearlite
R S
wa =S/(R+S)
wFe3C =(1-wa)
wpearlite = w
pearlite
s
r
wFe3C =r/(r+s)
w =(1-wFe3C)
Fe3C


 


 


 
38
Mechanical Behavior of Fe-C Alloys
• Cementite is harder
phase and more brittle
than ferrite .
• increasing cementite
fraction therefore
makes harder, less
ductile material
39
Alloying Steel with More Elements
• Teutectoid changes: • Ceutectoid changes:
Adapted from Fig. 9.34,Callister 7e. (Fig. 9.34
from Edgar C. Bain, Functions of the Alloying
Elements in Steel, American Society for Metals,
1939, p. 127.)
Adapted from Fig. 9.35,Callister 7e. (Fig. 9.35
from Edgar C. Bain, Functions of the Alloying
Elements in Steel, American Society for Metals,
1939, p. 127.)
T
Eutectoid
(°C)
wt. % of alloying elements
Ti
Ni
Mo
Si
W
Cr
Mn
wt. % of alloying elements
C
eutectoid
(wt%C)
Ni
Ti
Cr
Si
Mn
W
Mo
Solved Example
41
41
Solved Example
For a 99.6 wt% Fe-0.40 wt% C at a temperature just below the
eutectoid, determine the following
a) composition of Fe3C and ferrite (a)
b) the amount of carbide (cementite) in grams that forms per 100 g of
steel
c) the amount of pearlite and proeutectoid ferrite (a)
42
Solved Example
Solution:
g
3
.
94
g
5.7
C
Fe
g
7
.
5
100
022
.
0
7
.
6
022
.
0
4
.
0
100
x
C
Fe
C
Fe
3
C
Fe
3
3
3
=
a
=
=
−
−
=
−
−
=
a
+ a
a
x
C
C
C
Co
b) the amount of carbide
(cementite) in grams that
forms per 100 g of steel
a) composition of Fe3C and ferrite (a)
CO = 0.40 wt% C
Ca = 0.022 wt% C
CFe C = 6.70 wt% C
3
Fe
3
C
(cementite)
1600
1400
1200
1000
800
600
400
0 1 2 3 4 5 6 6.7
L

(austenite)
+L
 + Fe3C
a+ Fe3C
L+Fe3C

Co, wt% C
1148°C
T(°C)
727°C
CO
R S
CFe C
3
Ca
43
Solved Example
c. the amount of pearlite and proeutectoid ferrite (a)
note: amount of pearlite = amount of  just above TE
Co = 0.40 wt% C
Ca = 0.022 wt% C
Cpearlite = C = 0.76 wt% C

 + a
=
Co −Ca
C −Ca
x 100 = 51.2 g
pearlite = 51.2 g
proeutectoid a = 48.8 g
Fe
3
C
(cementite)
1600
1400
1200
1000
800
600
400
0 1 2 3 4 5 6 6.7
L

(austenite)
+L
 + Fe3C
a+ Fe3C
L+Fe3C

Co, wt% C
1148°C
T(°C)
727°C
CO
R S
C
Ca
Thank you

More Related Content

Similar to 02-MEC121-Lecture 3-Iron-Carbon phase diagram .pdf

Chapter 9 phase diagrams 1
Chapter 9 phase diagrams 1Chapter 9 phase diagrams 1
Chapter 9 phase diagrams 1Meelu Qazi
 
EMM - Unit 1.pptx
EMM - Unit 1.pptxEMM - Unit 1.pptx
EMM - Unit 1.pptx
vignesh589621
 
EM.pptx
EM.pptxEM.pptx
EM.pptx
vignesh589621
 
Electroloysis. tpack at kibasila sec school
Electroloysis. tpack at kibasila sec schoolElectroloysis. tpack at kibasila sec school
Electroloysis. tpack at kibasila sec school
Ayoub Kafyulilo
 
8 diagrama de fases aula
8 diagrama de fases aula8 diagrama de fases aula
8 diagrama de fases aula
Rafael Thomas
 
CONSTITUTION OF ALLOYS
CONSTITUTION OF ALLOYSCONSTITUTION OF ALLOYS
CONSTITUTION OF ALLOYS
Muthukumar V
 
Phase Behaviour and EoS Modelling of the Carbon Dioxide-Hydrogen System, Mart...
Phase Behaviour and EoS Modelling of the Carbon Dioxide-Hydrogen System, Mart...Phase Behaviour and EoS Modelling of the Carbon Dioxide-Hydrogen System, Mart...
Phase Behaviour and EoS Modelling of the Carbon Dioxide-Hydrogen System, Mart...
UK Carbon Capture and Storage Research Centre
 
Thermoelectric and magnetic properties of Ca3Co4-xCuxO9+ δ with x = 0.00, 0.0...
Thermoelectric and magnetic properties of Ca3Co4-xCuxO9+ δ with x = 0.00, 0.0...Thermoelectric and magnetic properties of Ca3Co4-xCuxO9+ δ with x = 0.00, 0.0...
Thermoelectric and magnetic properties of Ca3Co4-xCuxO9+ δ with x = 0.00, 0.0...Chih-Ju Lin
 
10[1].Phase Diagrams.ppt
10[1].Phase Diagrams.ppt10[1].Phase Diagrams.ppt
10[1].Phase Diagrams.ppt
Vipul Saxena
 
Class 1 binary phase diagrams
Class 1 binary phase diagramsClass 1 binary phase diagrams
Class 1 binary phase diagrams
NeelKhant1
 
Master Thesis Total Oxidation Over Cu Based Catalysts
Master Thesis  Total Oxidation Over Cu Based CatalystsMaster Thesis  Total Oxidation Over Cu Based Catalysts
Master Thesis Total Oxidation Over Cu Based Catalysts
albotamor
 
Phase diagram and equilibrium diagram
Phase diagram and equilibrium diagramPhase diagram and equilibrium diagram
Phase diagram and equilibrium diagram
adi000055
 
Electrochemistry.pdf
Electrochemistry.pdfElectrochemistry.pdf
Electrochemistry.pdf
Syed Mazhar Shah
 
Microteaching PPT.pptx
Microteaching PPT.pptxMicroteaching PPT.pptx
Microteaching PPT.pptx
gurubeesmart
 
IA on effect of concentration of KOH on the rate of hydrogen production, betw...
IA on effect of concentration of KOH on the rate of hydrogen production, betw...IA on effect of concentration of KOH on the rate of hydrogen production, betw...
IA on effect of concentration of KOH on the rate of hydrogen production, betw...
Lawrence kok
 
Two Component System
Two Component SystemTwo Component System

Similar to 02-MEC121-Lecture 3-Iron-Carbon phase diagram .pdf (20)

Phy351 ch 5
Phy351 ch 5Phy351 ch 5
Phy351 ch 5
 
Phy351 ch 5
Phy351 ch 5Phy351 ch 5
Phy351 ch 5
 
Chapter 9 phase diagrams 1
Chapter 9 phase diagrams 1Chapter 9 phase diagrams 1
Chapter 9 phase diagrams 1
 
EMM - Unit 1.pptx
EMM - Unit 1.pptxEMM - Unit 1.pptx
EMM - Unit 1.pptx
 
EM.pptx
EM.pptxEM.pptx
EM.pptx
 
MOP063
MOP063MOP063
MOP063
 
Electroloysis. tpack at kibasila sec school
Electroloysis. tpack at kibasila sec schoolElectroloysis. tpack at kibasila sec school
Electroloysis. tpack at kibasila sec school
 
8 diagrama de fases aula
8 diagrama de fases aula8 diagrama de fases aula
8 diagrama de fases aula
 
CONSTITUTION OF ALLOYS
CONSTITUTION OF ALLOYSCONSTITUTION OF ALLOYS
CONSTITUTION OF ALLOYS
 
Phase Behaviour and EoS Modelling of the Carbon Dioxide-Hydrogen System, Mart...
Phase Behaviour and EoS Modelling of the Carbon Dioxide-Hydrogen System, Mart...Phase Behaviour and EoS Modelling of the Carbon Dioxide-Hydrogen System, Mart...
Phase Behaviour and EoS Modelling of the Carbon Dioxide-Hydrogen System, Mart...
 
Thermoelectric and magnetic properties of Ca3Co4-xCuxO9+ δ with x = 0.00, 0.0...
Thermoelectric and magnetic properties of Ca3Co4-xCuxO9+ δ with x = 0.00, 0.0...Thermoelectric and magnetic properties of Ca3Co4-xCuxO9+ δ with x = 0.00, 0.0...
Thermoelectric and magnetic properties of Ca3Co4-xCuxO9+ δ with x = 0.00, 0.0...
 
10[1].Phase Diagrams.ppt
10[1].Phase Diagrams.ppt10[1].Phase Diagrams.ppt
10[1].Phase Diagrams.ppt
 
Class 1 binary phase diagrams
Class 1 binary phase diagramsClass 1 binary phase diagrams
Class 1 binary phase diagrams
 
Master Thesis Total Oxidation Over Cu Based Catalysts
Master Thesis  Total Oxidation Over Cu Based CatalystsMaster Thesis  Total Oxidation Over Cu Based Catalysts
Master Thesis Total Oxidation Over Cu Based Catalysts
 
Phase diagram and equilibrium diagram
Phase diagram and equilibrium diagramPhase diagram and equilibrium diagram
Phase diagram and equilibrium diagram
 
Chap1,part2
Chap1,part2Chap1,part2
Chap1,part2
 
Electrochemistry.pdf
Electrochemistry.pdfElectrochemistry.pdf
Electrochemistry.pdf
 
Microteaching PPT.pptx
Microteaching PPT.pptxMicroteaching PPT.pptx
Microteaching PPT.pptx
 
IA on effect of concentration of KOH on the rate of hydrogen production, betw...
IA on effect of concentration of KOH on the rate of hydrogen production, betw...IA on effect of concentration of KOH on the rate of hydrogen production, betw...
IA on effect of concentration of KOH on the rate of hydrogen production, betw...
 
Two Component System
Two Component SystemTwo Component System
Two Component System
 

Recently uploaded

6th International Conference on Machine Learning & Applications (CMLA 2024)
6th International Conference on Machine Learning & Applications (CMLA 2024)6th International Conference on Machine Learning & Applications (CMLA 2024)
6th International Conference on Machine Learning & Applications (CMLA 2024)
ClaraZara1
 
MCQ Soil mechanics questions (Soil shear strength).pdf
MCQ Soil mechanics questions (Soil shear strength).pdfMCQ Soil mechanics questions (Soil shear strength).pdf
MCQ Soil mechanics questions (Soil shear strength).pdf
Osamah Alsalih
 
一比一原版(Otago毕业证)奥塔哥大学毕业证成绩单如何办理
一比一原版(Otago毕业证)奥塔哥大学毕业证成绩单如何办理一比一原版(Otago毕业证)奥塔哥大学毕业证成绩单如何办理
一比一原版(Otago毕业证)奥塔哥大学毕业证成绩单如何办理
dxobcob
 
Technical Drawings introduction to drawing of prisms
Technical Drawings introduction to drawing of prismsTechnical Drawings introduction to drawing of prisms
Technical Drawings introduction to drawing of prisms
heavyhaig
 
NO1 Uk best vashikaran specialist in delhi vashikaran baba near me online vas...
NO1 Uk best vashikaran specialist in delhi vashikaran baba near me online vas...NO1 Uk best vashikaran specialist in delhi vashikaran baba near me online vas...
NO1 Uk best vashikaran specialist in delhi vashikaran baba near me online vas...
Amil Baba Dawood bangali
 
Unbalanced Three Phase Systems and circuits.pptx
Unbalanced Three Phase Systems and circuits.pptxUnbalanced Three Phase Systems and circuits.pptx
Unbalanced Three Phase Systems and circuits.pptx
ChristineTorrepenida1
 
Understanding Inductive Bias in Machine Learning
Understanding Inductive Bias in Machine LearningUnderstanding Inductive Bias in Machine Learning
Understanding Inductive Bias in Machine Learning
SUTEJAS
 
An Approach to Detecting Writing Styles Based on Clustering Techniques
An Approach to Detecting Writing Styles Based on Clustering TechniquesAn Approach to Detecting Writing Styles Based on Clustering Techniques
An Approach to Detecting Writing Styles Based on Clustering Techniques
ambekarshweta25
 
Design and Analysis of Algorithms-DP,Backtracking,Graphs,B&B
Design and Analysis of Algorithms-DP,Backtracking,Graphs,B&BDesign and Analysis of Algorithms-DP,Backtracking,Graphs,B&B
Design and Analysis of Algorithms-DP,Backtracking,Graphs,B&B
Sreedhar Chowdam
 
Water billing management system project report.pdf
Water billing management system project report.pdfWater billing management system project report.pdf
Water billing management system project report.pdf
Kamal Acharya
 
Modelagem de um CSTR com reação endotermica.pdf
Modelagem de um CSTR com reação endotermica.pdfModelagem de um CSTR com reação endotermica.pdf
Modelagem de um CSTR com reação endotermica.pdf
camseq
 
一比一原版(IIT毕业证)伊利诺伊理工大学毕业证成绩单专业办理
一比一原版(IIT毕业证)伊利诺伊理工大学毕业证成绩单专业办理一比一原版(IIT毕业证)伊利诺伊理工大学毕业证成绩单专业办理
一比一原版(IIT毕业证)伊利诺伊理工大学毕业证成绩单专业办理
zwunae
 
Heap Sort (SS).ppt FOR ENGINEERING GRADUATES, BCA, MCA, MTECH, BSC STUDENTS
Heap Sort (SS).ppt FOR ENGINEERING GRADUATES, BCA, MCA, MTECH, BSC STUDENTSHeap Sort (SS).ppt FOR ENGINEERING GRADUATES, BCA, MCA, MTECH, BSC STUDENTS
Heap Sort (SS).ppt FOR ENGINEERING GRADUATES, BCA, MCA, MTECH, BSC STUDENTS
Soumen Santra
 
Sachpazis:Terzaghi Bearing Capacity Estimation in simple terms with Calculati...
Sachpazis:Terzaghi Bearing Capacity Estimation in simple terms with Calculati...Sachpazis:Terzaghi Bearing Capacity Estimation in simple terms with Calculati...
Sachpazis:Terzaghi Bearing Capacity Estimation in simple terms with Calculati...
Dr.Costas Sachpazis
 
Governing Equations for Fundamental Aerodynamics_Anderson2010.pdf
Governing Equations for Fundamental Aerodynamics_Anderson2010.pdfGoverning Equations for Fundamental Aerodynamics_Anderson2010.pdf
Governing Equations for Fundamental Aerodynamics_Anderson2010.pdf
WENKENLI1
 
Industrial Training at Shahjalal Fertilizer Company Limited (SFCL)
Industrial Training at Shahjalal Fertilizer Company Limited (SFCL)Industrial Training at Shahjalal Fertilizer Company Limited (SFCL)
Industrial Training at Shahjalal Fertilizer Company Limited (SFCL)
MdTanvirMahtab2
 
Top 10 Oil and Gas Projects in Saudi Arabia 2024.pdf
Top 10 Oil and Gas Projects in Saudi Arabia 2024.pdfTop 10 Oil and Gas Projects in Saudi Arabia 2024.pdf
Top 10 Oil and Gas Projects in Saudi Arabia 2024.pdf
Teleport Manpower Consultant
 
basic-wireline-operations-course-mahmoud-f-radwan.pdf
basic-wireline-operations-course-mahmoud-f-radwan.pdfbasic-wireline-operations-course-mahmoud-f-radwan.pdf
basic-wireline-operations-course-mahmoud-f-radwan.pdf
NidhalKahouli2
 
Nuclear Power Economics and Structuring 2024
Nuclear Power Economics and Structuring 2024Nuclear Power Economics and Structuring 2024
Nuclear Power Economics and Structuring 2024
Massimo Talia
 
Tutorial for 16S rRNA Gene Analysis with QIIME2.pdf
Tutorial for 16S rRNA Gene Analysis with QIIME2.pdfTutorial for 16S rRNA Gene Analysis with QIIME2.pdf
Tutorial for 16S rRNA Gene Analysis with QIIME2.pdf
aqil azizi
 

Recently uploaded (20)

6th International Conference on Machine Learning & Applications (CMLA 2024)
6th International Conference on Machine Learning & Applications (CMLA 2024)6th International Conference on Machine Learning & Applications (CMLA 2024)
6th International Conference on Machine Learning & Applications (CMLA 2024)
 
MCQ Soil mechanics questions (Soil shear strength).pdf
MCQ Soil mechanics questions (Soil shear strength).pdfMCQ Soil mechanics questions (Soil shear strength).pdf
MCQ Soil mechanics questions (Soil shear strength).pdf
 
一比一原版(Otago毕业证)奥塔哥大学毕业证成绩单如何办理
一比一原版(Otago毕业证)奥塔哥大学毕业证成绩单如何办理一比一原版(Otago毕业证)奥塔哥大学毕业证成绩单如何办理
一比一原版(Otago毕业证)奥塔哥大学毕业证成绩单如何办理
 
Technical Drawings introduction to drawing of prisms
Technical Drawings introduction to drawing of prismsTechnical Drawings introduction to drawing of prisms
Technical Drawings introduction to drawing of prisms
 
NO1 Uk best vashikaran specialist in delhi vashikaran baba near me online vas...
NO1 Uk best vashikaran specialist in delhi vashikaran baba near me online vas...NO1 Uk best vashikaran specialist in delhi vashikaran baba near me online vas...
NO1 Uk best vashikaran specialist in delhi vashikaran baba near me online vas...
 
Unbalanced Three Phase Systems and circuits.pptx
Unbalanced Three Phase Systems and circuits.pptxUnbalanced Three Phase Systems and circuits.pptx
Unbalanced Three Phase Systems and circuits.pptx
 
Understanding Inductive Bias in Machine Learning
Understanding Inductive Bias in Machine LearningUnderstanding Inductive Bias in Machine Learning
Understanding Inductive Bias in Machine Learning
 
An Approach to Detecting Writing Styles Based on Clustering Techniques
An Approach to Detecting Writing Styles Based on Clustering TechniquesAn Approach to Detecting Writing Styles Based on Clustering Techniques
An Approach to Detecting Writing Styles Based on Clustering Techniques
 
Design and Analysis of Algorithms-DP,Backtracking,Graphs,B&B
Design and Analysis of Algorithms-DP,Backtracking,Graphs,B&BDesign and Analysis of Algorithms-DP,Backtracking,Graphs,B&B
Design and Analysis of Algorithms-DP,Backtracking,Graphs,B&B
 
Water billing management system project report.pdf
Water billing management system project report.pdfWater billing management system project report.pdf
Water billing management system project report.pdf
 
Modelagem de um CSTR com reação endotermica.pdf
Modelagem de um CSTR com reação endotermica.pdfModelagem de um CSTR com reação endotermica.pdf
Modelagem de um CSTR com reação endotermica.pdf
 
一比一原版(IIT毕业证)伊利诺伊理工大学毕业证成绩单专业办理
一比一原版(IIT毕业证)伊利诺伊理工大学毕业证成绩单专业办理一比一原版(IIT毕业证)伊利诺伊理工大学毕业证成绩单专业办理
一比一原版(IIT毕业证)伊利诺伊理工大学毕业证成绩单专业办理
 
Heap Sort (SS).ppt FOR ENGINEERING GRADUATES, BCA, MCA, MTECH, BSC STUDENTS
Heap Sort (SS).ppt FOR ENGINEERING GRADUATES, BCA, MCA, MTECH, BSC STUDENTSHeap Sort (SS).ppt FOR ENGINEERING GRADUATES, BCA, MCA, MTECH, BSC STUDENTS
Heap Sort (SS).ppt FOR ENGINEERING GRADUATES, BCA, MCA, MTECH, BSC STUDENTS
 
Sachpazis:Terzaghi Bearing Capacity Estimation in simple terms with Calculati...
Sachpazis:Terzaghi Bearing Capacity Estimation in simple terms with Calculati...Sachpazis:Terzaghi Bearing Capacity Estimation in simple terms with Calculati...
Sachpazis:Terzaghi Bearing Capacity Estimation in simple terms with Calculati...
 
Governing Equations for Fundamental Aerodynamics_Anderson2010.pdf
Governing Equations for Fundamental Aerodynamics_Anderson2010.pdfGoverning Equations for Fundamental Aerodynamics_Anderson2010.pdf
Governing Equations for Fundamental Aerodynamics_Anderson2010.pdf
 
Industrial Training at Shahjalal Fertilizer Company Limited (SFCL)
Industrial Training at Shahjalal Fertilizer Company Limited (SFCL)Industrial Training at Shahjalal Fertilizer Company Limited (SFCL)
Industrial Training at Shahjalal Fertilizer Company Limited (SFCL)
 
Top 10 Oil and Gas Projects in Saudi Arabia 2024.pdf
Top 10 Oil and Gas Projects in Saudi Arabia 2024.pdfTop 10 Oil and Gas Projects in Saudi Arabia 2024.pdf
Top 10 Oil and Gas Projects in Saudi Arabia 2024.pdf
 
basic-wireline-operations-course-mahmoud-f-radwan.pdf
basic-wireline-operations-course-mahmoud-f-radwan.pdfbasic-wireline-operations-course-mahmoud-f-radwan.pdf
basic-wireline-operations-course-mahmoud-f-radwan.pdf
 
Nuclear Power Economics and Structuring 2024
Nuclear Power Economics and Structuring 2024Nuclear Power Economics and Structuring 2024
Nuclear Power Economics and Structuring 2024
 
Tutorial for 16S rRNA Gene Analysis with QIIME2.pdf
Tutorial for 16S rRNA Gene Analysis with QIIME2.pdfTutorial for 16S rRNA Gene Analysis with QIIME2.pdf
Tutorial for 16S rRNA Gene Analysis with QIIME2.pdf
 

02-MEC121-Lecture 3-Iron-Carbon phase diagram .pdf

  • 2. 2 Intended Learning Outcomes • Revise phase diagrams • Understand the Iron-Carbon phase diagram • Understand the effect of adding or increasing carbon % to Iron. 2
  • 3. 3 Contents • Introduction • Phase Diagram Revision •Solubility limits •Binary systems •Binary Eutectic systems • Iron-Carbon Phase Diagram
  • 5. 5 Iron-Carbon Phase Diagram • Phase diagrams are graphical representations of the phases present in an alloy at different conditions of temperature, pressure, or chemical composition. • Development and production of new alloys based on application requirements. • Development and control of appropriate heat treatment
  • 6. 6 Contents • Introduction • Phase Diagram Revision •Solubility limits •Binary systems •Binary Eutectic systems • Iron-Carbon Phase Diagram
  • 7. 7 Solubility Limit Solutions: solid solutions, single phase Mixtures: more than one phase Solubility Limit: Max concentration for which only a single-phase solution occurs. Question: What is the solubility limit at 20°C? Answer: 65 wt% sugar. If Co < 65 wt% sugar: syrup If Co > 65 wt% sugar: syrup + sugar. 65 Sucrose/Water Phase Diagram Pure Sugar Temperature (°C) 0 20 40 60 80 100 Co =Composition (wt% sugar) L (liquid solution i.e., syrup) Solubility Limit L (liquid) + S (solid sugar) 20 40 60 80 100 Pure Water Adapted from Fig. 9.1, Callister 7e.
  • 8. 8 Effect of T & Composition (Co) • Changing T can change # of phases: Adapted from Fig. 9.1, Callister 7e. D (100°C,90) 2 phases B (100°C,70) 1 phase path A to B. • Changing Co can change # of phases: path B to D. A (20°C,70) 2 phases 70 80 100 60 40 20 0 Temperature (°C) Co =Composition (wt% sugar) L (liquid solution i.e., syrup) 20 100 40 60 80 0 L (liquid) + S (solid sugar) water- sugar system
  • 9. 9 Contents • Introduction • Phase Diagram Revision •Solubility limits •Binary systems •Binary Eutectic systems • Iron-Carbon Phase Diagram
  • 10. 10 Phase Diagrams: Binary Systems • Indicate phases as function of T, Co, and P. -binary systems: just 2 components. -independent variables: T and Co (P = 1 atm is almost always used). • Phase Diagram for Cu-Ni system Adapted from Fig. 9.3(a), Callister 7e. (Fig. 9.3(a) is adapted from Phase Diagrams of Binary Nickel Alloys, P. Nash (Ed.), ASM International, Materials Park, OH (1991). • 2 phases: L (liquid) a (FCC solid solution) • 3 phase fields: L L + a a wt% Ni 20 40 60 80 100 0 1000 1100 1200 1300 1400 1500 1600 T(°C) L (liquid) a (FCC solid solution)
  • 11. 11 Phase Diagrams: Binary Systems 11 wt% Ni 20 40 60 80 100 0 1000 1100 1200 1300 1400 1500 1600 T(°C) L (liquid) a (FCC solid solution) Cu-Ni phase diagram • Rule 1: If we know T and Co, then we know: --the # and types of phases present. • Examples: A(1100°C, 60): 1 phase: a B(1250°C, 35): 2 phases: L + a Adapted from Fig. 9.3(a), Callister 7e. (Fig. 9.3(a) is adapted from Phase Diagrams of Binary Nickel Alloys, P. Nash (Ed.), ASM International, Materials Park, OH, 1991). B (1250°C,35) A(1100°C,60)
  • 12. 12 Phase Diagrams: Binary Phases wt% Ni 20 1200 1300 T(°C) L (liquid) a (solid) 30 40 50 Cu-Ni system • Rule 2: If we know T and Co, then we know: --the composition of each phase. • Examples: TA A 35 Co 32 CL At TA = 1320°C: Only Liquid (L) CL = Co ( = 35 wt% Ni) At TB = 1250°C: Both a and L CL = Cliquidus ( = 32 wt% Ni here) Ca = Csolidus ( = 43 wt% Ni here) At TD = 1190°C: Only Solid ( a) Ca = Co ( = 35 wt% Ni) Co = 35 wt% Ni Adapted from Fig. 9.3(b), Callister 7e. (Fig. 9.3(b) is adapted from Phase Diagrams of Binary Nickel Alloys, P. Nash (Ed.), ASM International, Materials Park, OH, 1991.) B TB D TD tie line 4 Ca 3
  • 13. 13 Phase Diagrams: Binary Systems • Rule 3: If we know T and Co, then we know: --the amount of each phase (given in wt%). • Examples: At TA: Only Liquid (L) WL = 100 wt%, Wa = 0 At TD: Only Solid ( a) WL = 0, Wa = 100 wt% Co = 35 wt% Ni Adapted from Fig. 9.3(b), Callister 7e. (Fig. 9.3(b) is adapted from Phase Diagrams of Binary Nickel Alloys, P. Nash (Ed.), ASM International, Materials Park, OH, 1991.) wt% Ni 20 1200 1300 T(°C) L (liquid) a (solid) 30 40 50 Cu-Ni system TA A 35 Co 32 CL B TB D TD tie line 4 Ca 3 R S At TB: Both a and L % 73 32 43 35 43 wt = − − = = 27 wt% WL = S R +S Wa = R R +S
  • 14. 14 Phase Diagrams: Binary Systems wt% Ni 20 1200 1300 30 40 50 110 0 L (liquid) a (solid) T(°C) A 35 Co L: 35wt%Ni Cu-Ni system • Phase diagram: Cu-Ni system. • System is: --binary i.e., 2 components: Cu and Ni. --isomorphous i.e., complete solubility of one component in another; a phase field extends from 0 to 100 wt% Ni. Adapted from Fig. 9.4, Callister 7e. • Consider Co = 35 wt%Ni. 46 35 43 32 a: 43 wt% Ni L: 32 wt% Ni L: 24 wt% Ni a: 36 wt% Ni B a: 46 wt% Ni L: 35 wt% Ni C D E 24 36
  • 15. 15 Mechanical Properties: Cu-Ni System • Effect of solid solution strengthening on: --Tensile strength (TS) --Ductility (%EL) --Peak as a function of Co --Min. as a function of Co Adapted from Fig. 9.6(a), Callister 7e. Adapted from Fig. 9.6(b), Callister 7e. Tensile Strength (MPa) Composition, wt% Ni Cu Ni 0 20 40 60 80 100 200 300 400 TS for pure Ni TS for pure Cu Elongation (%EL) Composition, wt% Ni Cu Ni 0 20 40 60 80 100 20 30 40 50 60 %EL for pure Ni %EL for pure Cu
  • 16. 16 Contents • Introduction • Phase Diagram Revision •Solubility limits •Binary systems •Binary Eutectic systems • Iron-Carbon Phase Diagram
  • 17. 17 Phase Diagrams: Binary-Eutectic Systems : Min. melting TE 2 components has a special composition with a min. melting T. Adapted from Fig. 9.7, Callister 7e. • Eutectic transition L(CE) a(CaE) + (CE) • 3 single phase regions (L, a, ) • Limited solubility: a: mostly Cu : mostly Ag • TE : No liquid below TE • CE composition Ex.: Cu-Ag system Cu-Ag system L (liquid) a L + a L+ a +  Co , wt% Ag 20 40 60 80 100 0 200 1200 T(°C) 400 600 800 1000 CE TE 8.0 71.9 91.2 779°C
  • 18. 18 Phase Diagrams: Binary-Eutectic Systems L+a L+ a +  200 T(°C) 18.3 C, wt% Sn 20 60 80 100 0 300 100 L (liquid) a 183°C 61.9 97.8  • For a 40 wt% Sn-60 wt% Pb alloy at 150°C, find... --the phases present: Pb-Sn system a +  --compositions of phases: CO = 40 wt% Sn --the relative amount of each phase: 150 40 Co 11 Ca 99 C S R Ca = 11 wt% Sn C = 99 wt% Sn Wa= C - CO C - Ca = 99 - 40 99 - 11 = 59 88 = 67 wt% S R+S = W = CO - Ca C - Ca = R R+S = 29 88 = 33 wt% = 40 - 11 99 - 11 Adapted from Fig. 9.8, Callister 7e. EX: Pb-Sn Eutectic System (1)
  • 19. 19 EX: Pb-Sn Eutectic System (2) L+ a +  200 T(°C) C, wt% Sn 20 60 80 100 0 300 100 L (liquid) a  L+a 183°C • For a 40 wt% Sn-60 wt% Pb alloy at 200°C, find... --the phases present: Pb-Sn system Adapted from Fig. 9.8, Callister 7e. a + L --compositions of phases: CO = 40 wt% Sn --the relative amount of each phase: Wa = CL - CO CL - Ca = 46 - 40 46 - 17 = 6 29 = 21 wt% WL = CO - Ca CL - Ca = 23 29 = 79 wt% 40 Co 46 CL 17 Ca 220 S R Ca = 17 wt% Sn CL = 46 wt% Sn
  • 20. 20 Microstructures in Eutectic Systems • Co = CE • Result: Eutectic microstructure (lamellar structure) --alternating layers (lamellae) of a and  crystals. Adapted from Fig. 9.13, Callister 7e. Adapted from Fig. 9.14, Callister 7e. 160m Micrograph of Pb-Sn eutectic microstructure Pb-Sn system L+ a +  200 T(°C) C, wt% Sn 20 60 80 100 0 300 100 L a  L+a 183°C 40 TE 18.3 a: 18.3 wt%Sn 97.8 : 97.8 wt% Sn CE 61.9 L: Co wt% Sn Microstructures in Eutectic Systems:
  • 21. 21 Lamellar Eutectic Structure Adapted from Figs. 9.14 & 9.15, Callister 7e.
  • 22. 22 Hypoeutectic & Hypereutectic L+a L+ a +  200 Co, wt% Sn 20 60 80 100 0 300 100 L a  TE 40 (Pb-Sn System) Adapted from Fig. 9.8, Callister 7e. (Fig. 9.8 adapted from Binary Phase Diagrams, 2nd ed., Vol. 3, T.B. Massalski (Editor-in- Chief), ASM International, Materials Park, OH, 1990.) 160 m eutectic micro-constituent hypereutectic: (illustration only)       Adapted from Fig. 9.17, Callister 7e. (Illustration only) (Figs. 9.14 and 9.17 from Metals Handbook, 9th ed., Vol. 9, Metallography and Microstructures, American Society for Metals, Materials Park, OH, 1985.) 175 m a a a a a a hypoeutectic: Co = 50 wt% Sn T(°C) 61.9 eutectic eutectic: Co =61.9wt% Sn
  • 23. 23 Eutectoid & Peritectic Adapted from Fig. 9.21, Callister 7e. Eutectoid transition   +  Peritectic transition  + L  • Eutectoid - solid phase in equation with two solid phases S2 S1+S3 • Peritectic - liquid + solid 1 → solid 2 S1 + L S2 • Eutectic - liquid in equilibrium with two solids L a +  cool heat Cu-Zn Phase diagram
  • 24. 24 Contents • Introduction • Phase Diagram Revision •Solubility limits •Binary systems •Binary Eutectic systems • Iron-Carbon Phase Diagram
  • 26. 26 Iron-Carbon Phase Diagram • Phase diagrams are graphical representations of the phases present in an alloy at different conditions of temperature, pressure, or chemical composition. • Development of new alloys based on application requirements. • Production of these alloys. • Development and control of appropriate heat treatment
  • 27. 27 Iron Form • α-iron → BCC crystal • exists at The iron at room temperature to 912 ˚C • body center cubic structure ( BCC) • ductile but not very strong • γ-iron → FCC crystal • exists at temperature range 910°C to 1394°C • face center cubic structure (FCC) • soft and ductile • δ-iron → BCC crystal • exists at temperature range 1395°C to 1539°C • body center cubic structure ( BCC) • magnetic 27
  • 28. 28 Iron-Carbon Diagram • According to the carbon percentage iron carbon alloys can be classified into steels and cast iron. • Steels are iron-iron carbide alloys with carbon content lower than 2.06%. • Cast iron forms with higher carbon content up to 6.67% carbon. Cast Iron Steel
  • 29. 29 Iron-Carbon (Fe-C) Phase Diagram: Phases Adapted from Fig. 9.24,Callister 7e. Fe 3 C (cementite) 1600 1400 1200 1000 800 600 400 0 1 2 3 4 5 6 6.7 L  (austenite) +L +Fe3C a+Fe3C L+Fe3C  (Fe) Co, wt% C 1148°C T(°C) a 727°C = Teutectoid α-ferrite • Existing at low temperatures and low carbon content, α-ferrite is a solid solution of carbon in BCC Fe. • This phase is stable at room temperature. • This phase is magnetic below 768°C. • It has a maximum carbon content of 0.022 % and it will transform to γ- austenite at 912°C as shown in the graph.
  • 30. 30 Iron-Carbon (Fe-C) Phase Diagram: Phases Adapted from Fig. 9.24,Callister 7e. Fe 3 C (cementite) 1600 1400 1200 1000 800 600 400 0 1 2 3 4 5 6 6.7 L  (austenite) +L +Fe3C a+Fe3C L+Fe3C  (Fe) Co, wt% C 1148°C T(°C) a 727°C = Teutectoid γ-austenite • This phase is a solid solution of carbon in FCC Fe with a maximum solubility of 2.14% C. • On further heating, it converts into BCC δ-ferrite at 1395°C. • γ-austenite is unstable at temperatures below eutectic temperature (727°C) unless cooled rapidly. • This phase is non-magnetic.
  • 31. 31 Iron-Carbon (Fe-C) Phase Diagram: Phases Adapted from Fig. 9.24,Callister 7e. Fe 3 C (cementite) 1600 1400 1200 1000 800 600 400 0 1 2 3 4 5 6 6.7 L  (austenite) +L +Fe3C a+Fe3C L+Fe3C  (Fe) Co, wt% C 1148°C T(°C) a 727°C = Teutectoid δ-ferrite • This phase has a similar structure as that of α-ferrite but exists only at high temperatures. • The phase can be spotted at the top left corner in the graph. • It has a melting point of 1538°C.
  • 32. 32 Iron-Carbon (Fe-C) Phase Diagram: Phases Adapted from Fig. 9.24,Callister 7e. Fe 3 C (cementite) 1600 1400 1200 1000 800 600 400 0 1 2 3 4 5 6 6.7 L  (austenite) +L +Fe3C a+Fe3C L+Fe3C  (Fe) Co, wt% C 1148°C T(°C) a 727°C = Teutectoid Fe3C or cementite • Cementite is a metastable phase of this alloy with a fixed composition of Fe3C. • It decomposes extremely slowly at room temperature into iron and carbon (graphite). • Cementite is hard and brittle which makes it suitable for strengthening steels.
  • 33. 33 Iron-Carbon (Fe-C) Phase Diagram: Phases Adapted from Fig. 9.24,Callister 7e. Fe 3 C (cementite) 1600 1400 1200 1000 800 600 400 0 1 2 3 4 5 6 6.7 L  (austenite) +L +Fe3C a+Fe3C L+Fe3C  (Fe) Co, wt% C 1148°C T(°C) a 727°C = Teutectoid Fe-C liquid solution • Marked on the diagram as ‘L’, it can be seen in the upper region in the diagram. • As the name suggests, it is a liquid solution of carbon in iron. • As we know that δ-ferrite melts at 1538°C, it is evident that the melting temperature of iron decreases with increasing carbon content.
  • 34. 34 Iron-Carbon (Fe-C) Phase Diagram: Eutectic and Eutectoid • 2 important points -Eutectoid (B):   a +Fe3C -Eutectic (A): L   +Fe3C Adapted from Fig. 9.24,Callister 7e. Fe 3 C (cementite) 1600 1400 1200 1000 800 600 400 0 1 2 3 4 5 6 6.7 L  (austenite) +L +Fe3C a+Fe3C L+Fe3C  (Fe) Co, wt% C 1148°C T(°C) a 727°C = Teutectoid A S R 4.30 Result: Pearlite = alternating layers of a and Fe3C phases 120 m (Adapted from Fig. 9.27, Callister 7e.)     R S 0.76 C eutectoid B Fe3C (cementite-hard) a (ferrite-soft)
  • 35. 35 Iron-Carbon (Fe-C) Phase Diagram: Eutectic and Eutectoid Adapted from Fig. 9.24,Callister 7e. Fe 3 C (cementite) 1600 1400 1200 1000 800 600 400 0 1 2 3 4 5 6 6.7 L  (austenite) +L +Fe3C a+Fe3C L+Fe3C  (Fe) Co, wt% C 1148°C T(°C) a 727°C = Teutectoid     R S 0.76 C eutectoid B Fe3C (cementite-hard) a (ferrite-soft) Pearlite •consists of alternate layers of ferrite and cementite in the proportion 87:13 by weight. •Formed from austenite at eutectoid temperature 727°C upon slow cooling. •Mechanically, pearlite has properties intermediate to soft, ductile ferrite and hard, brittle cementite.
  • 36. 36 Iron-Carbon (Fe-C) Phase Diagram: Hypoeutectoid Steel Adapted from Figs. 9.24 and 9.29,Callister 7e. (Fig. 9.24 adapted from Binary Alloy Phase Diagrams, 2nd ed., Vol. 1, T.B. Massalski (Ed.-in-Chief), ASM International, Materials Park, OH, 1990.) Fe 3 C (cementite) 1600 1400 1200 1000 800 600 400 0 1 2 3 4 5 6 6.7 L  (austenite) +L  +Fe3C a+Fe3C L+Fe3C  (Fe) Co, wt% C 1148°C T(°C) a 727°C (Fe-C System) C0 0.76 Adapted from Fig. 9.30,Callister 7e. proeutectoid ferrite pearlite 100 m Hypoeutectoid steel R S a wa =S/(R+S) wFe3 C =(1-wa) wpearlite = w pearlite r s wa =s/(r+s) w =(1- wa)     a a a        
  • 37. 37 Iron-Carbon (Fe-C) Phase Diagram: Hypereutectoid Steel Fe 3 C (cementite) 1600 1400 1200 1000 800 600 400 0 1 2 3 4 5 6 6.7 L  (austenite) +L  +Fe3C a +Fe3C L+Fe3C  (Fe) Co, wt%C 1148°C T(°C) a Adapted from Figs. 9.24 and 9.32,Callister 7e. (Fig. 9.24 adapted from Binary Alloy Phase Diagrams, 2nd ed., Vol. 1, T.B. Massalski (Ed.-in-Chief), ASM International, Materials Park, OH, 1990.) (Fe-C System) 0.76 Co Adapted from Fig. 9.33,Callister 7e. proeutectoid Fe3C 60 mHypereutectoid steel pearlite R S wa =S/(R+S) wFe3C =(1-wa) wpearlite = w pearlite s r wFe3C =r/(r+s) w =(1-wFe3C) Fe3C            
  • 38. 38 Mechanical Behavior of Fe-C Alloys • Cementite is harder phase and more brittle than ferrite . • increasing cementite fraction therefore makes harder, less ductile material
  • 39. 39 Alloying Steel with More Elements • Teutectoid changes: • Ceutectoid changes: Adapted from Fig. 9.34,Callister 7e. (Fig. 9.34 from Edgar C. Bain, Functions of the Alloying Elements in Steel, American Society for Metals, 1939, p. 127.) Adapted from Fig. 9.35,Callister 7e. (Fig. 9.35 from Edgar C. Bain, Functions of the Alloying Elements in Steel, American Society for Metals, 1939, p. 127.) T Eutectoid (°C) wt. % of alloying elements Ti Ni Mo Si W Cr Mn wt. % of alloying elements C eutectoid (wt%C) Ni Ti Cr Si Mn W Mo
  • 41. 41 41 Solved Example For a 99.6 wt% Fe-0.40 wt% C at a temperature just below the eutectoid, determine the following a) composition of Fe3C and ferrite (a) b) the amount of carbide (cementite) in grams that forms per 100 g of steel c) the amount of pearlite and proeutectoid ferrite (a)
  • 42. 42 Solved Example Solution: g 3 . 94 g 5.7 C Fe g 7 . 5 100 022 . 0 7 . 6 022 . 0 4 . 0 100 x C Fe C Fe 3 C Fe 3 3 3 = a = = − − = − − = a + a a x C C C Co b) the amount of carbide (cementite) in grams that forms per 100 g of steel a) composition of Fe3C and ferrite (a) CO = 0.40 wt% C Ca = 0.022 wt% C CFe C = 6.70 wt% C 3 Fe 3 C (cementite) 1600 1400 1200 1000 800 600 400 0 1 2 3 4 5 6 6.7 L  (austenite) +L  + Fe3C a+ Fe3C L+Fe3C  Co, wt% C 1148°C T(°C) 727°C CO R S CFe C 3 Ca
  • 43. 43 Solved Example c. the amount of pearlite and proeutectoid ferrite (a) note: amount of pearlite = amount of  just above TE Co = 0.40 wt% C Ca = 0.022 wt% C Cpearlite = C = 0.76 wt% C   + a = Co −Ca C −Ca x 100 = 51.2 g pearlite = 51.2 g proeutectoid a = 48.8 g Fe 3 C (cementite) 1600 1400 1200 1000 800 600 400 0 1 2 3 4 5 6 6.7 L  (austenite) +L  + Fe3C a+ Fe3C L+Fe3C  Co, wt% C 1148°C T(°C) 727°C CO R S C Ca