Downloaded 257 times


![When the substrate concentration becomes large
enough to force the equilibrium to form completely
all ES the second step in the reaction becomes rate
limiting because no more ES can be made and the
enzyme-substrate complex is at its maximum value.
ES
P
2k
dt
d
v
[ES] is the difference between the
rates of ES formation minus the
rates of its disappearance.
ESESSE
ES
211 kkk
dt
d
1](https://image.slidesharecdn.com/enzymecatalysis-140330114116-phpapp01/85/Enzyme-Kinetics-4-320.jpg)


![ESEE T 3
Combining 1 + 2 + 3
ESkkSES-Ek 21-T1
SEkSkkkES T1121-
SK
SE
ES T
M
1
21-
k
kk
KM
rearranging
Divide by k1 and solve for [ES] Where](https://image.slidesharecdn.com/enzymecatalysis-140330114116-phpapp01/85/Enzyme-Kinetics-7-320.jpg)


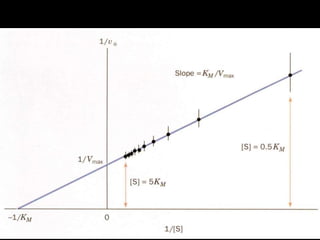
![Lineweaver-Burk plot: slope = KM/Vmax,
1/vo intercept is equal to 1/Vmax
the extrapolated x intercept is equal to -1/KM
For small errors in at low [S] leads to large errors in 1/vo
T
max
E
V
catk
kcat is how many reactions an
enzyme can catalyze per second
The turnover number](https://image.slidesharecdn.com/enzymecatalysis-140330114116-phpapp01/85/Enzyme-Kinetics-14-320.jpg)
![For Michaelis -Menton kinetics k2= kcat
When [S] << KM very little ES is formed and [E] = [E]T
and
SE
K
k
SE
K
k
M
cat
T
M
2
ov
Kcat/KM is a measure of catalytic efficiency](https://image.slidesharecdn.com/enzymecatalysis-140330114116-phpapp01/85/Enzyme-Kinetics-15-320.jpg)
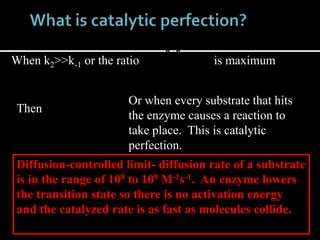


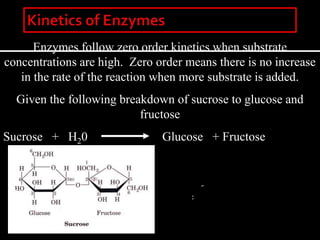
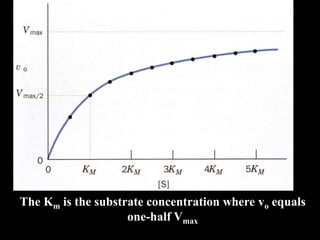
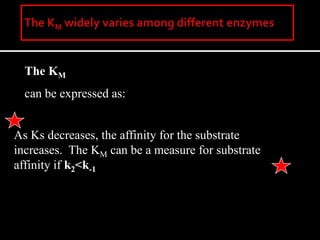
This document discusses enzyme kinetics and inhibition. It notes that enzymes follow zero-order kinetics at high substrate concentrations, meaning the reaction rate does not increase with more substrate. It then describes Michaelis-Menten kinetics using the rate equation and defines terms like KM and Vmax. KM is the substrate concentration at half the maximum rate and is a measure of substrate affinity. Different types of inhibition are also summarized, including competitive, uncompetitive, and mixed inhibition and how they affect the Michaelis-Menten equation and Lineweaver-Burk plots.


