Downloaded 2,443 times
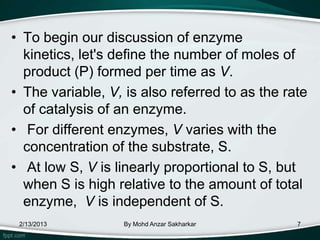
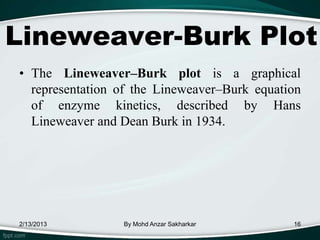
![The velocity equation can be
derived following method:
• The rates of formation and breakdown of
the E - S complex are given in terms of
known quantities:
o The rate of formation of E-S =
(with the assumption that [P] =0)
o The rate of breakdown of E-S =
=
2/13/2013 By Mohd Anzar Sakharkar 11](https://image.slidesharecdn.com/enzymefinal-130213013631-phpapp01/85/Enzyme-kinetics-11-320.jpg)
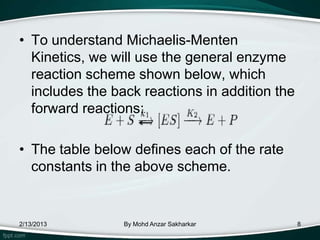
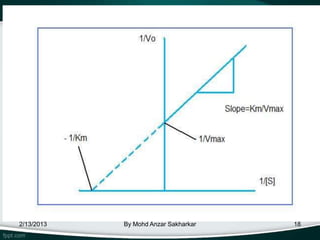
![• At steady state,
=
Therefore, rate of formation of E-S = rate of breakdown of E-S
So,
Dividing through by k1: [E] [S] = [E-S]
Substituting with kM:
kM =
2/13/2013 By Mohd Anzar Sakharkar 12](https://image.slidesharecdn.com/enzymefinal-130213013631-phpapp01/85/Enzyme-kinetics-12-320.jpg)
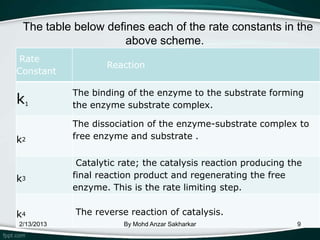
![• Substituting [EF] with [ET]-[ES]:
ET = [ES] + [EF]
([ET] - [ES]) [S] = kM [ES]
[ET] [S] -[ES][S] = kM [ES]
[ET] [S] = [ES] [S] + kM [ES]
[ET] [S] = [ES] ([S] + kM)
• Solving for [ES]: [ES] =
2/13/2013 By Mohd Anzar Sakharkar 14](https://image.slidesharecdn.com/enzymefinal-130213013631-phpapp01/85/Enzyme-kinetics-14-320.jpg)
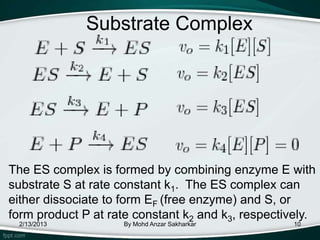
![• The rate equation from the rate limiting step is:
Vo = = k2[ES]
Multiplying both sides of the equation by k2:
k2 [ES] =
Vo =
When S>>KM, vo is approximately equal to k2[ET]. When
the [S] great, most of the enzyme is found in the bound
state ([ES]) and Vo = Vmax
We can then substitue k2[ET] with Vmax to get the Michaelis
Menten Kinetic Equation:
2/13/2013 vo = By Mohd Anzar Sakharkar 15](https://image.slidesharecdn.com/enzymefinal-130213013631-phpapp01/85/Enzyme-kinetics-15-320.jpg)
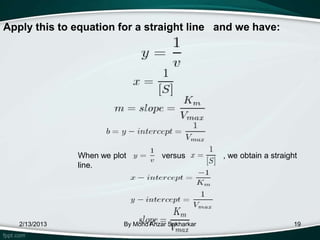
![Derivation
• The plot provides a useful graphical method for
analysis of the Michaelis-Menten equation:
• Taking the reciprocal gives
Km is the Michaelis–Menten constant
[S] is the
substrate concentration
V is the reaction velocity (the reaction
rate)
2/13/2013 By Mohd Anzar Sakharkar the maximum reaction velocity
Vmax is 17](https://image.slidesharecdn.com/enzymefinal-130213013631-phpapp01/85/Enzyme-kinetics-17-320.jpg)
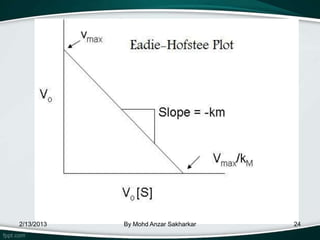
![Eadie–Hofstee diagram
• Eadie–Hofstee diagram is a graphical
representation of enzyme kinetics in
which reaction velocity is plotted as
a function of the velocity
vs. substrate concentration ratio:
V =reaction velocity
Km = Michaelis–Menten constant
[S] = substrate concentration
Vmax = maximum reaction velocity.
2/13/2013 By Mohd Anzar Sakharkar 21](https://image.slidesharecdn.com/enzymefinal-130213013631-phpapp01/85/Enzyme-kinetics-21-320.jpg)
![• A plot of v vs v/[S] will yield Vmax as the y-
intercept, Vmax/Km as the x-intercept, and Km as the
negative slope.
• Like other techniques that linearize the Michaelis–
Menten equation, the Eadie-Hofstee plot was used
historically for rapid identification of important kinetic
terms like Km and Vmax, but has been superseded
by nonlinear regression methods that are significantly
more accurate and no longer computationally
inaccessible.
• It is also more robust against error-prone data than
the Lineweaver–Burk plot, particularly because it
gives equal weight to data points in any range of
substrate concentration or reaction velocity.
• Both plots remain useful as a means to present data
graphically.
2/13/2013 By Mohd Anzar Sakharkar 23](https://image.slidesharecdn.com/enzymefinal-130213013631-phpapp01/85/Enzyme-kinetics-23-320.jpg)

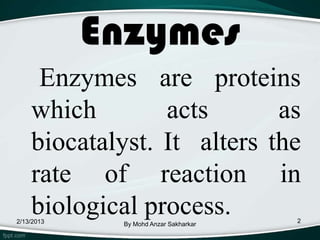
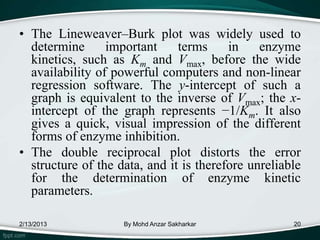
Enzymes are protein molecules that act as catalysts in biological processes, accelerating reactions by lowering their activation energy. Enzyme kinetics is the study of chemical reactions catalyzed by enzymes and how varying conditions affect reaction rates. The Michaelis-Menten model describes reaction rates in terms of the enzyme-substrate binding affinity (Km) and maximum reaction rate (Vmax). Graphical representations like Lineweaver-Burk and Eadie-Hofstee plots can determine these parameters from experimental data.