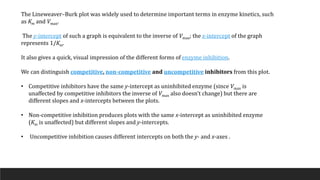
The document discusses the Michaelis-Menten equation, which was devised in 1913 to explain the relationship between reaction velocity and substrate concentration in enzyme-catalyzed reactions. It is based on the assumption that the enzyme and substrate form a reversible enzyme-substrate complex in the initial step of the reaction. The Michaelis constant Km represents the substrate concentration at which the reaction velocity is half of its maximum value Vmax and can be used to measure the enzyme's affinity for the substrate. The Lineweaver-Burk plot is also described as a way to determine Km and Vmax values graphically from experimental data.
![𝐄 + 𝐒 𝐄𝐒 𝐄 + 𝐏
Rate of formation of ES = k1[E][S].
Rate of consumption of ES = k-1[ES] + k2 [ES]
In the steady state, k-1[ES] + k2 [ES] = k1[E][S]
(k-1 + k2) [ES] = k1[E][S]
(k-1 + k2)/k1 = [E][S]/[ES]
The equilibrium constant (Km) is usually called Michaelis constant
Km = (k-1 + k2)/k1
[E] = [E]total - [ES]
Km = ([E]total - [ES]) [S]/[ES]
K1
K_1
K2](https://image.slidesharecdn.com/michaelismentenreaction-221225051702-5c37d31e/85/Michaelis-Menten-Reaction-6-320.jpg)
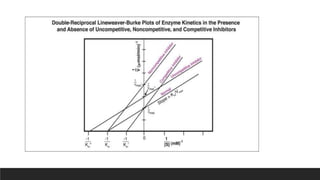
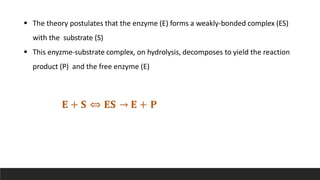
![Factor [ES] from the left-hand terms:
[ES](Km + [S]) = [E]total [S]
finally, divide both sides by (Km + [S]):
[ES] = [E]total [S]/(Km + [S])
V = k2 [E]total [S]/(Km + [S])
( Vmax = k2 [E]total)
𝑽 =
𝑽𝒎𝒂𝒙[𝑺]
𝑲𝒎+[𝑺]](https://image.slidesharecdn.com/michaelismentenreaction-221225051702-5c37d31e/85/Michaelis-Menten-Reaction-7-320.jpg)
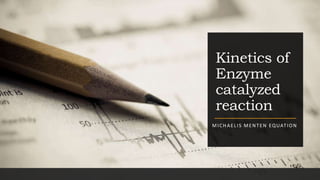
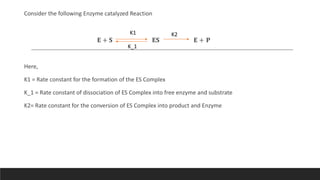
![The Reaction Velocity Vs Substrate concentration graph gives a parabolic plot.
The plot provides a useful graphical method for analysis of the Michaelis–Menten equation, as it is
difficult to determine precisely the Vmax of an enzyme-catalysed reaction:
The slope of this plot;
𝟏
𝑽
=
𝑲𝒎 + [𝑺]
𝑽𝒎𝒂𝒙[𝑺]
=
𝑲𝒎
𝑽𝒎𝒂𝒙
𝟏
[𝑺]
+
𝟏
𝑽𝒎𝒂𝒙
𝑽 =
𝑽𝒎𝒂𝒙[𝑺]
𝑲𝒎 + [𝑺]](https://image.slidesharecdn.com/michaelismentenreaction-221225051702-5c37d31e/85/Michaelis-Menten-Reaction-9-320.jpg)
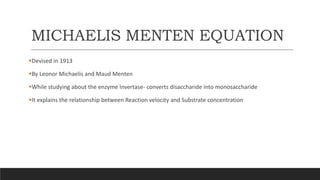
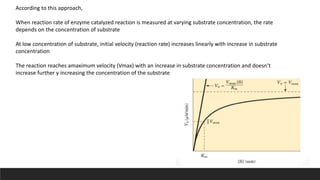
![𝑽 =
𝑽𝒎𝒂𝒙[𝑺]
𝑲𝒎+[𝑺]
V =Velocity/Speed of reaction
Vmax = Max. Velocity of reaction
S =Substrate concentration
Km= Michaelis Menten Constant
• This can be used to calculate Km after experimentally determining the reaction rates at various
substrate concentrations](https://image.slidesharecdn.com/michaelismentenreaction-221225051702-5c37d31e/85/Michaelis-Menten-Reaction-10-320.jpg)
![ At low concentration of substrate, Km >> [S]
V= Vm [S]
Km
the rate is of 1st order, depends on the [S]
At high concentration of substrate, Km << [S]
V= Vm
The rate is zero order
The value of Km can also be obtained from the plot.
When Km = [S], then
V= Vm/ 2](https://image.slidesharecdn.com/michaelismentenreaction-221225051702-5c37d31e/85/Michaelis-Menten-Reaction-11-320.jpg)
![Significance of value of Km
Km value is used as a measure of an enzyme’s affinity for its substrate.
The lower the Km value the higher the enzyme’s affinity for the substrate and vice versa
It provides an idea of the strength of binding of the substrate to the enzyme molecule.
The lower the Km value the more tightly bound the substrate is to the enzyme for the reaction to
be catalyzed and vice versa.
The value indicates the lowest concentration of the substrate [S] the enzyme can
recognize before reaction catalysis can occur.](https://image.slidesharecdn.com/michaelismentenreaction-221225051702-5c37d31e/85/Michaelis-Menten-Reaction-13-320.jpg)
![• An enzyme's Km describes- the substrate concentration at which half the enzyme's active sites are
occupied by substrate
• Km value is also used as a measure of the substrate concentration [S] when the reaction rate half
maximal velocity (50%). i.e Km = [S] at ½ Vmax.](https://image.slidesharecdn.com/michaelismentenreaction-221225051702-5c37d31e/85/Michaelis-Menten-Reaction-14-320.jpg)
![Lineweaver Burk Plot
It is very difficult to determine Vm directly from a plot of V against [S]
Thus the Michaelis Menten equation can be rearranged to give convenient representation.
The plot between 1/V and 1/[S] is known as Lineweaver-Burk Plot](https://image.slidesharecdn.com/michaelismentenreaction-221225051702-5c37d31e/85/Michaelis-Menten-Reaction-16-320.jpg)