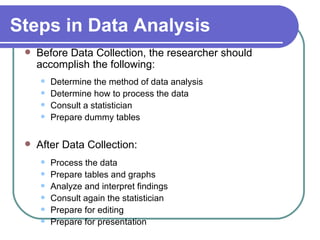
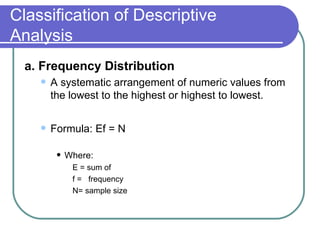
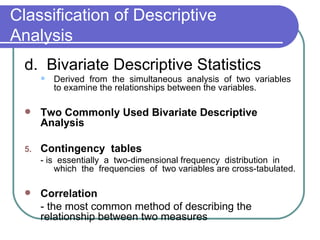
SlideShare a Scribd company logo
1 of 38
Data Analysis and
Presentation
PLANNING FOR DATA
ANALYSIS
Data Analysis

    The purpose

        To answer the research questions and to
         help determine the trends and
         relationships among the variables.
Steps in Data Analysis
    Before Data Collection, the researcher should
     accomplish the following:
        Determine the method of data analysis
        Determine how to process the data
        Consult a statistician
        Prepare dummy tables

    After Data Collection:
        Process the data
        Prepare tables and graphs
        Analyze and interpret findings
        Consult again the statistician
        Prepare for editing
        Prepare for presentation
Classification of Descriptive
Analysis

Kinds of Data Analysis

   1. Descriptive Analysis
   2. Inferential Analysis
1. Descriptive Analysis
    refers to the description of the data from a
     particular sample;

    hence the conclusion must refer only to the sample.

    In other words, these summarize the data and
     describe sample characteristics.

    Descriptive Statistics
       are numerical values obtained from the sample that
        gives meaning to the data collected.
Classification of Descriptive
Analysis
  a. Frequency Distribution
       A systematic arrangement of numeric values from
        the lowest to the highest or highest to lowest.

       Formula: Ef = N

            Where:
              E = sum of
              f = frequency
              N= sample size
Classification of Descriptive
Analysis
 b. Measure of Central Tendency
         A statistical index that describes the average of the set
          values.

    Kinds of Averages
     1. Mode - a numeric value in a distribution that occurs most frequently.

    2. Median - an index of average position in a distribution of numbers.

    3. Mean - the point on the score scale that is equal to the sum of the scores
     divided by the total number of scores.

    Formula:
                                              Where:
                X=    Σ___
                                              X = the mean
                      n                       Σ = the sum of
                                              X = each individual raw score
                                              n = the number of cases
Classification of Descriptive
Analysis
  c. Measure of Variability

       Statistics that concern the degree to
        which the scores in a distribution are
        different from or similar to each other.
Two Commonly Used Measures of
Variability
 1. Range
        - the distance between the highest score and the
     lowest score in a distribution.

 Example:
    The range for learning center A 500 (750 - 250) and the range
       for learning center is about 300 (650 - 350)

 2. Standard Deviation
     - the most commonly used measure of variability
     that indicates the average to which the scores
     deviate from the mean.
Classification of Descriptive
Analysis
  d. Bivariate Descriptive Statistics
          Derived from the simultaneous analysis of two variables
           to examine the relationships between the variables.

      Two Commonly Used Bivariate Descriptive
       Analysis

  5.   Contingency tables
       - is essentially a two-dimensional frequency distribution in
           which the frequencies of two variables are cross-tabulated.

      Correlation
       - the most common method of describing the
       relationship between two measures
Classification of Descriptive
Analysis

Kinds of Data Analysis

   1. Descriptive Analysis
   2. Inferential Analysis
2. Inferential Analysis
    The use of statistical tests, either to test for
      significant relationships among variables or to
     find statistical support for the hypotheses.

    Inferential Statistics
        are numerical values that enable the researcher to
         draw conclusion about a population based on the
         characteristics of a population sample.
        This is based on the laws of probability.
Level of Significance

    An important factor in determining the
     representativeness of the sample population and the
     degree to which the chance affects the findings.

    The level of significance is a numerical value selected
     by the researcher before data collection to indicate the
     probability of erroneous findings being accepted as
     true.

    This value is represented typically as 0.01 or 0.05.
     (Massey,1991)
   Uses of Inferential Analysis

       Cited some statistical test for inferential analysis.

1. t-test
    is used to examine the difference between the means of two
    independent groups.

2. Analysis of Variance (ANOVA) - is used to test the significance
    of differences between means of two or more groups.

3. Chi-square - this is used to test hypotheses about the
    proportion of elements that fall into various cells of a
    contingency table.
   Hypothesis - Testing Procedures
       The outcome of the study perhaps may
        retain, revise or reject the hypothesis and
        this determines the acceptability of
        hypotheses and the theory from which it
        was derived.
   Steps in testing hypothesis:

       Determine the test statistics to be used
       Establish the level of significance
       Select a one-tailed or two-tailed test
       Compute a test statistic
       Calculate the degrees of freedom
       Obtain a tabled value for statistical test
       Compare the test statistics to the tabled value
   Presentation of Findings
       Findings are presented in different forms such as:


1. Narrative or textual form
       This is composed of summary of findings, direct quotations
        and implications of the study.


2. Tables
       Tables are used to present a clear and organized data.
       This is utilized for easy analysis and interpretation of data.
   The parts of tabular data are presented in the
    following:
       Rows - horizontal entries (indicates the outcome
        or the dependent variable)

       Columns - vertical entries (indicates the cause
        or the independent variable)

       Cells - are boxes where rows and columns
        intersect.
   Parts of Table Columns


            COLUMN


    ROW     CELL
   Interpretation of Data
       After analysis of data and the appropriate statistical
        procedure, the next chapter of the research paper
        is to present the interpretation of the data, which is
        the final step of research process.


   The three areas:
       Summary of Findings
       Conclusions
       Recommendations
   Summary of Findings
       This portion summarizes the result of data
        analysis from chapter


4. The best thing is to review the stated
  problem and tie up with the result of your
  data analysis.
   Conclusions

       A conclusion is drawn from the summary of
        findings.

       focuses on the answers to the problem
        including the outcome of the hypotheses
        whether it is rejected or accepted.
   Recommendations
       This is based on the result of the
        conclusions

       The main goal is geared toward
        improvement or development
THE FINAL RESEARCH
OUTPUT
   Writing the Final Output
       The researcher should know not only the
        parts in research process but also the forms
        and style in writing the research proposal
        and the research paper
The Format of Writing the
Study
Preliminary Pages
 1. Title page/ Title of the Study
     - is a phrase that describes the research study.
     - It should not be too long or too short as well as
     too vague and general.

 2. Acknowledgement Page
     - is a section wherein the researcher expresses his
     deep gratitude for those persons who assisted and
     helped him to make the study a successful one.
3. Table of Contents
   - from the word itself, it contains all the parts of the
   research paper including the pages.

4. List of Tables
   - this follows the table of content and indicates the title
   of the tables in the research paper.

5. List of Figures
   - is composed of paradigms, diagrams, graphs and
   charts or flowcharts.
Main Body
Main Body
  Chapter I. Introduction
  This section refers to:
       “What this study is all about” or “What
       makes the researcher interested in doing
       the study”.
      Purpose: to introduce the reader to the
       subject matter.
      The introduction serves as a springboard
       for the statement of the problem as stated
       by Dr. Barrientos-Tan.
   Chapter II. Review of Related Literature
   Chapter III. Research Design and
    Methodology
   Chapter IV. Analysis and Interpretation of Data
   Chapter V. Summary, Conclusions, and
    Recommendations Supplementary Pages
   Bibliography
   Appendix
Sample of Table of Contents
   Table of Contents
    Acknowledgment
    List of Tables
    List of Figures
    Chapter I The Problem and its Background
       Introduction
       Background of the Study
       Conceptual Framework/Theoretical
       Statement of the Problem
       Hypotheses
       Significance of the Study
       Scope and Delimitation of the Study
       Definition of Terms
   Chapter II           Review of Related Literature and Studies
        Literature (Foreign/Local)
        Studies (Foreign/Local)
        Justification of the Present Study
   Chapter III Research Design and Methodology
        Research Design
        Research Subject
        Instrumentation
        Data Gathering Procedure
        Statistical Treatment of Data
   Chapter IV Analysis and Interpretation of Data
   Chapter V Summary, Conclusion and Recommendations
   Bibliography
   Appendix
   Curriculum Vitae
Table of Contents
TABLE OF CONTENTS

    indicates all the contents of research
     paper and the page number for each
     section is placed at the right-hand
     margin.

    The page for the table of contents is
     usually written in Roman numeral and
     indicated at the bottom of the paper.
 List of Tables
 The caption should be exactly how it
  appears in the text.
 In numbering the tables, use Arabic
  numerals.

More Related Content

What's hot

Methods of data collection (research methodology)
Methods of data collection  (research methodology)Methods of data collection  (research methodology)
Methods of data collection (research methodology)Muhammed Konari
 
Literature review in research
Literature review in researchLiterature review in research
Literature review in researchNursing Path
 
Statistics in research
Statistics in researchStatistics in research
Statistics in researchBalaji P
 
Descriptive Statistics
Descriptive StatisticsDescriptive Statistics
Descriptive StatisticsCIToolkit
 
Analysis of data in research
Analysis of data in researchAnalysis of data in research
Analysis of data in researchAbhijeet Birari
 
Types of research
Types of researchTypes of research
Types of researchAshish Sahu
 
Simple random sampling
Simple random samplingSimple random sampling
Simple random samplingsuncil0071
 
What is statistics
What is statisticsWhat is statistics
What is statisticsRaj Teotia
 
Questionnaire and its Types
Questionnaire and its Types Questionnaire and its Types
Questionnaire and its Types Mumbai University
 
Bivariate analysis
Bivariate analysisBivariate analysis
Bivariate analysisariassam
 
Descriptive statistics
Descriptive statisticsDescriptive statistics
Descriptive statisticsSarfraz Ahmad
 
Inferential statistics.ppt
Inferential statistics.pptInferential statistics.ppt
Inferential statistics.pptNursing Path
 
Methods of data collection
Methods of data collection Methods of data collection
Methods of data collection PRIYAN SAKTHI
 

What's hot (20)

Data
DataData
Data
 
Research Design
Research DesignResearch Design
Research Design
 
Hypothesis Testing
Hypothesis TestingHypothesis Testing
Hypothesis Testing
 
Research design
Research designResearch design
Research design
 
Methods of data collection (research methodology)
Methods of data collection  (research methodology)Methods of data collection  (research methodology)
Methods of data collection (research methodology)
 
Quantitative Data analysis
Quantitative Data analysisQuantitative Data analysis
Quantitative Data analysis
 
Literature review in research
Literature review in researchLiterature review in research
Literature review in research
 
Statistics in research
Statistics in researchStatistics in research
Statistics in research
 
Descriptive Statistics
Descriptive StatisticsDescriptive Statistics
Descriptive Statistics
 
Inferential Statistics
Inferential StatisticsInferential Statistics
Inferential Statistics
 
Research gap
 Research gap Research gap
Research gap
 
Analysis of data in research
Analysis of data in researchAnalysis of data in research
Analysis of data in research
 
Types of research
Types of researchTypes of research
Types of research
 
Simple random sampling
Simple random samplingSimple random sampling
Simple random sampling
 
What is statistics
What is statisticsWhat is statistics
What is statistics
 
Questionnaire and its Types
Questionnaire and its Types Questionnaire and its Types
Questionnaire and its Types
 
Bivariate analysis
Bivariate analysisBivariate analysis
Bivariate analysis
 
Descriptive statistics
Descriptive statisticsDescriptive statistics
Descriptive statistics
 
Inferential statistics.ppt
Inferential statistics.pptInferential statistics.ppt
Inferential statistics.ppt
 
Methods of data collection
Methods of data collection Methods of data collection
Methods of data collection
 

Viewers also liked

Data analysis powerpoint
Data analysis powerpointData analysis powerpoint
Data analysis powerpointjamiebrandon
 
Data Analysis, Presentation and Interpretation of Data
Data Analysis, Presentation and Interpretation of DataData Analysis, Presentation and Interpretation of Data
Data Analysis, Presentation and Interpretation of DataRoqui Malijan
 
Data analysis powerpoint
Data analysis powerpointData analysis powerpoint
Data analysis powerpointSarah Hallum
 
Qualitative Data Analysis (Steps)
Qualitative Data Analysis (Steps)Qualitative Data Analysis (Steps)
Qualitative Data Analysis (Steps)guest7f1ad678
 
Chapter 4 PRESENTATION, ANALYSIS AND INTERPRETATION
Chapter 4 PRESENTATION, ANALYSIS AND INTERPRETATIONChapter 4 PRESENTATION, ANALYSIS AND INTERPRETATION
Chapter 4 PRESENTATION, ANALYSIS AND INTERPRETATIONLJ Villanueva
 
Data Preparation and Processing
Data Preparation and ProcessingData Preparation and Processing
Data Preparation and ProcessingMehul Gondaliya
 
Data analysis market research
Data analysis   market researchData analysis   market research
Data analysis market researchsachinudepurkar
 
Measurement and scaling techniques
Measurement  and  scaling  techniquesMeasurement  and  scaling  techniques
Measurement and scaling techniquesUjjwal 'Shanu'
 
steps in Questionnaire design
steps in Questionnaire designsteps in Questionnaire design
steps in Questionnaire designheena pathan
 
Sampling and Sample Types
Sampling  and Sample TypesSampling  and Sample Types
Sampling and Sample TypesDr. Sunil Kumar
 
Quantitative And Qualitative Research
Quantitative And Qualitative ResearchQuantitative And Qualitative Research
Quantitative And Qualitative Researchdoha07
 
Definition and types of research
Definition and types of researchDefinition and types of research
Definition and types of researchfadifm
 
Tools to Expedite Your Proposal, IRB, and Results Chapter
Tools to Expedite Your Proposal, IRB, and Results ChapterTools to Expedite Your Proposal, IRB, and Results Chapter
Tools to Expedite Your Proposal, IRB, and Results ChapterStatistics Solutions
 
Data analysis and Interpretation
Data analysis and InterpretationData analysis and Interpretation
Data analysis and InterpretationMehul Gondaliya
 

Viewers also liked (20)

Data analysis powerpoint
Data analysis powerpointData analysis powerpoint
Data analysis powerpoint
 
Qualitative data analysis
Qualitative data analysisQualitative data analysis
Qualitative data analysis
 
Data Analysis, Presentation and Interpretation of Data
Data Analysis, Presentation and Interpretation of DataData Analysis, Presentation and Interpretation of Data
Data Analysis, Presentation and Interpretation of Data
 
Presentation of data
Presentation of dataPresentation of data
Presentation of data
 
Chapter 4 presentation of data
Chapter 4 presentation of dataChapter 4 presentation of data
Chapter 4 presentation of data
 
Data analysis powerpoint
Data analysis powerpointData analysis powerpoint
Data analysis powerpoint
 
Qualitative Data Analysis (Steps)
Qualitative Data Analysis (Steps)Qualitative Data Analysis (Steps)
Qualitative Data Analysis (Steps)
 
Chapter 4 PRESENTATION, ANALYSIS AND INTERPRETATION
Chapter 4 PRESENTATION, ANALYSIS AND INTERPRETATIONChapter 4 PRESENTATION, ANALYSIS AND INTERPRETATION
Chapter 4 PRESENTATION, ANALYSIS AND INTERPRETATION
 
Data Preparation and Processing
Data Preparation and ProcessingData Preparation and Processing
Data Preparation and Processing
 
Data analysis market research
Data analysis   market researchData analysis   market research
Data analysis market research
 
Sampling
SamplingSampling
Sampling
 
Measurement and scaling techniques
Measurement  and  scaling  techniquesMeasurement  and  scaling  techniques
Measurement and scaling techniques
 
steps in Questionnaire design
steps in Questionnaire designsteps in Questionnaire design
steps in Questionnaire design
 
Sampling and Sample Types
Sampling  and Sample TypesSampling  and Sample Types
Sampling and Sample Types
 
Quantitative And Qualitative Research
Quantitative And Qualitative ResearchQuantitative And Qualitative Research
Quantitative And Qualitative Research
 
Definition and types of research
Definition and types of researchDefinition and types of research
Definition and types of research
 
Marketing research ppt
Marketing research pptMarketing research ppt
Marketing research ppt
 
Tools to Expedite Your Proposal, IRB, and Results Chapter
Tools to Expedite Your Proposal, IRB, and Results ChapterTools to Expedite Your Proposal, IRB, and Results Chapter
Tools to Expedite Your Proposal, IRB, and Results Chapter
 
Elective 2 -4 Human Resource Management 1
Elective 2 -4 Human Resource Management 1Elective 2 -4 Human Resource Management 1
Elective 2 -4 Human Resource Management 1
 
Data analysis and Interpretation
Data analysis and InterpretationData analysis and Interpretation
Data analysis and Interpretation
 

Similar to Chapter 10-DATA ANALYSIS & PRESENTATION

Data Analysis & Interpretation and Report Writing
Data Analysis & Interpretation and Report WritingData Analysis & Interpretation and Report Writing
Data Analysis & Interpretation and Report WritingSOMASUNDARAM T
 
Machine learning pre requisite
Machine learning pre requisiteMachine learning pre requisite
Machine learning pre requisiteRam Singh
 
Research Methodology
Research MethodologyResearch Methodology
Research Methodologysh_neha252
 
investigatory projct parts.ppt GRADE NIN
investigatory projct parts.ppt GRADE NINinvestigatory projct parts.ppt GRADE NIN
investigatory projct parts.ppt GRADE NINGoldwinFrankGuzman1
 
Student Research Session 4
Student Research Session 4Student Research Session 4
Student Research Session 4englishonecfl
 
Nursing Data Analysis.pptx
Nursing Data Analysis.pptxNursing Data Analysis.pptx
Nursing Data Analysis.pptxChinna Chadayan
 
2.1 frequency distributions for organizing and summarizing data
2.1 frequency distributions for organizing and summarizing data2.1 frequency distributions for organizing and summarizing data
2.1 frequency distributions for organizing and summarizing dataLong Beach City College
 
Biostatistics mean median mode unit 1.pptx
Biostatistics mean median mode unit 1.pptxBiostatistics mean median mode unit 1.pptx
Biostatistics mean median mode unit 1.pptxSailajaReddyGunnam
 
Analysing/Interpreting Quantitative Research
Analysing/Interpreting  Quantitative Research Analysing/Interpreting  Quantitative Research
Analysing/Interpreting Quantitative Research HariBolKafle
 
CABT Math 8 measures of central tendency and dispersion
CABT Math 8   measures of central tendency and dispersionCABT Math 8   measures of central tendency and dispersion
CABT Math 8 measures of central tendency and dispersionGilbert Joseph Abueg
 
LESSON-8-ANALYSIS-INTERPRETATION-AND-USE-OF-TEST-DATA.pptx
LESSON-8-ANALYSIS-INTERPRETATION-AND-USE-OF-TEST-DATA.pptxLESSON-8-ANALYSIS-INTERPRETATION-AND-USE-OF-TEST-DATA.pptx
LESSON-8-ANALYSIS-INTERPRETATION-AND-USE-OF-TEST-DATA.pptxMarjoriAnneDelosReye
 
Quantitative Method
Quantitative MethodQuantitative Method
Quantitative Methodzahraa Aamir
 
business-research.ppt
business-research.pptbusiness-research.ppt
business-research.pptKaneezElahi
 
business-research
business-research business-research
business-research Mbabba2
 
data analysis and report wring in research (Section d)
data analysis and report wring  in research (Section d)data analysis and report wring  in research (Section d)
data analysis and report wring in research (Section d)CGC Technical campus,Mohali
 

Similar to Chapter 10-DATA ANALYSIS & PRESENTATION (20)

Data Analysis & Interpretation and Report Writing
Data Analysis & Interpretation and Report WritingData Analysis & Interpretation and Report Writing
Data Analysis & Interpretation and Report Writing
 
Machine learning pre requisite
Machine learning pre requisiteMachine learning pre requisite
Machine learning pre requisite
 
ANALYSIS OF DATA.pptx
ANALYSIS OF DATA.pptxANALYSIS OF DATA.pptx
ANALYSIS OF DATA.pptx
 
Research Methodology
Research MethodologyResearch Methodology
Research Methodology
 
Media research
Media researchMedia research
Media research
 
investigatory projct parts.ppt GRADE NIN
investigatory projct parts.ppt GRADE NINinvestigatory projct parts.ppt GRADE NIN
investigatory projct parts.ppt GRADE NIN
 
Student Research Session 4
Student Research Session 4Student Research Session 4
Student Research Session 4
 
Nursing Data Analysis.pptx
Nursing Data Analysis.pptxNursing Data Analysis.pptx
Nursing Data Analysis.pptx
 
2.1 frequency distributions for organizing and summarizing data
2.1 frequency distributions for organizing and summarizing data2.1 frequency distributions for organizing and summarizing data
2.1 frequency distributions for organizing and summarizing data
 
Biostatistics mean median mode unit 1.pptx
Biostatistics mean median mode unit 1.pptxBiostatistics mean median mode unit 1.pptx
Biostatistics mean median mode unit 1.pptx
 
Analysing/Interpreting Quantitative Research
Analysing/Interpreting  Quantitative Research Analysing/Interpreting  Quantitative Research
Analysing/Interpreting Quantitative Research
 
CABT Math 8 measures of central tendency and dispersion
CABT Math 8   measures of central tendency and dispersionCABT Math 8   measures of central tendency and dispersion
CABT Math 8 measures of central tendency and dispersion
 
LESSON-8-ANALYSIS-INTERPRETATION-AND-USE-OF-TEST-DATA.pptx
LESSON-8-ANALYSIS-INTERPRETATION-AND-USE-OF-TEST-DATA.pptxLESSON-8-ANALYSIS-INTERPRETATION-AND-USE-OF-TEST-DATA.pptx
LESSON-8-ANALYSIS-INTERPRETATION-AND-USE-OF-TEST-DATA.pptx
 
ANALYSIS OF DATA (2).pptx
ANALYSIS OF DATA (2).pptxANALYSIS OF DATA (2).pptx
ANALYSIS OF DATA (2).pptx
 
Edited economic statistics note
Edited economic statistics noteEdited economic statistics note
Edited economic statistics note
 
Quantitative Method
Quantitative MethodQuantitative Method
Quantitative Method
 
business-research.ppt
business-research.pptbusiness-research.ppt
business-research.ppt
 
business-research
business-research business-research
business-research
 
Aishwarya.ppt
Aishwarya.pptAishwarya.ppt
Aishwarya.ppt
 
data analysis and report wring in research (Section d)
data analysis and report wring  in research (Section d)data analysis and report wring  in research (Section d)
data analysis and report wring in research (Section d)
 

More from Ludy Mae Nalzaro,BSM,BSN,MN

PHARMA-ADRENERGIC AGONIST, ANTAGONIST, CHOLINERGIC AND ANTICHOLINERGIC AGENTS
PHARMA-ADRENERGIC AGONIST, ANTAGONIST, CHOLINERGIC AND ANTICHOLINERGIC AGENTSPHARMA-ADRENERGIC AGONIST, ANTAGONIST, CHOLINERGIC AND ANTICHOLINERGIC AGENTS
PHARMA-ADRENERGIC AGONIST, ANTAGONIST, CHOLINERGIC AND ANTICHOLINERGIC AGENTSLudy Mae Nalzaro,BSM,BSN,MN
 

More from Ludy Mae Nalzaro,BSM,BSN,MN (20)

Elective 2 -3 organizational ethics
Elective 2 -3  organizational ethicsElective 2 -3  organizational ethics
Elective 2 -3 organizational ethics
 
Elective 2- 2 development of standards
Elective 2- 2 development of standardsElective 2- 2 development of standards
Elective 2- 2 development of standards
 
Elective 2-1 Quality health care nursing
Elective 2-1 Quality health care nursingElective 2-1 Quality health care nursing
Elective 2-1 Quality health care nursing
 
PHARMA- DRUGS FOR RESPIRATORY DISORDERS
PHARMA- DRUGS FOR RESPIRATORY DISORDERSPHARMA- DRUGS FOR RESPIRATORY DISORDERS
PHARMA- DRUGS FOR RESPIRATORY DISORDERS
 
PHARMA=DRUGS FOR NEUROLOGIC DISORDERS
PHARMA=DRUGS FOR NEUROLOGIC DISORDERSPHARMA=DRUGS FOR NEUROLOGIC DISORDERS
PHARMA=DRUGS FOR NEUROLOGIC DISORDERS
 
PHARMA-ADRENERGIC AGONIST, ANTAGONIST, CHOLINERGIC AND ANTICHOLINERGIC AGENTS
PHARMA-ADRENERGIC AGONIST, ANTAGONIST, CHOLINERGIC AND ANTICHOLINERGIC AGENTSPHARMA-ADRENERGIC AGONIST, ANTAGONIST, CHOLINERGIC AND ANTICHOLINERGIC AGENTS
PHARMA-ADRENERGIC AGONIST, ANTAGONIST, CHOLINERGIC AND ANTICHOLINERGIC AGENTS
 
PHARMA-PSYCHOTHERAPEUTIC AGENTS
PHARMA-PSYCHOTHERAPEUTIC AGENTSPHARMA-PSYCHOTHERAPEUTIC AGENTS
PHARMA-PSYCHOTHERAPEUTIC AGENTS
 
PHARMA-RESPIRATORY DRUGS
PHARMA-RESPIRATORY DRUGSPHARMA-RESPIRATORY DRUGS
PHARMA-RESPIRATORY DRUGS
 
PHARMA-Anti inflammatory drugs
PHARMA-Anti inflammatory drugsPHARMA-Anti inflammatory drugs
PHARMA-Anti inflammatory drugs
 
PHARMA-ANTI-FUNGAL, ANTI-HELMINTHIC
PHARMA-ANTI-FUNGAL, ANTI-HELMINTHICPHARMA-ANTI-FUNGAL, ANTI-HELMINTHIC
PHARMA-ANTI-FUNGAL, ANTI-HELMINTHIC
 
PHARMA-THE NURSING PROCESS
PHARMA-THE NURSING PROCESSPHARMA-THE NURSING PROCESS
PHARMA-THE NURSING PROCESS
 
PHARMA-Drug forms
PHARMA-Drug formsPHARMA-Drug forms
PHARMA-Drug forms
 
PHARMA-Dosage calculations
PHARMA-Dosage calculationsPHARMA-Dosage calculations
PHARMA-Dosage calculations
 
PHARMA-PHARMACOKINETICS
PHARMA-PHARMACOKINETICSPHARMA-PHARMACOKINETICS
PHARMA-PHARMACOKINETICS
 
PHARMA-PHARMACODYNAMICS
PHARMA-PHARMACODYNAMICSPHARMA-PHARMACODYNAMICS
PHARMA-PHARMACODYNAMICS
 
PHARMA-DRUG EVALUATION
PHARMA-DRUG EVALUATIONPHARMA-DRUG EVALUATION
PHARMA-DRUG EVALUATION
 
Chapter 9-METHODS OF DATA COLLECTION
Chapter 9-METHODS OF DATA COLLECTIONChapter 9-METHODS OF DATA COLLECTION
Chapter 9-METHODS OF DATA COLLECTION
 
Chapter 8-SAMPLE & SAMPLING TECHNIQUES
Chapter 8-SAMPLE & SAMPLING TECHNIQUESChapter 8-SAMPLE & SAMPLING TECHNIQUES
Chapter 8-SAMPLE & SAMPLING TECHNIQUES
 
Chapter 7-THE RESEARCH DESIGN
Chapter 7-THE RESEARCH DESIGNChapter 7-THE RESEARCH DESIGN
Chapter 7-THE RESEARCH DESIGN
 
Chapter 6-THEORETICAL & CONCEPTUAL FRAMEWORK
Chapter 6-THEORETICAL & CONCEPTUAL FRAMEWORKChapter 6-THEORETICAL & CONCEPTUAL FRAMEWORK
Chapter 6-THEORETICAL & CONCEPTUAL FRAMEWORK
 

Recently uploaded

APIForce Zurich 5 April Automation LPDG
APIForce Zurich 5 April  Automation LPDGAPIForce Zurich 5 April  Automation LPDG
APIForce Zurich 5 April Automation LPDGMarianaLemus7
 
Understanding the Laravel MVC Architecture
Understanding the Laravel MVC ArchitectureUnderstanding the Laravel MVC Architecture
Understanding the Laravel MVC ArchitecturePixlogix Infotech
 
SIP trunking in Janus @ Kamailio World 2024
SIP trunking in Janus @ Kamailio World 2024SIP trunking in Janus @ Kamailio World 2024
SIP trunking in Janus @ Kamailio World 2024Lorenzo Miniero
 
Unleash Your Potential - Namagunga Girls Coding Club
Unleash Your Potential - Namagunga Girls Coding ClubUnleash Your Potential - Namagunga Girls Coding Club
Unleash Your Potential - Namagunga Girls Coding ClubKalema Edgar
 
Pigging Solutions in Pet Food Manufacturing
Pigging Solutions in Pet Food ManufacturingPigging Solutions in Pet Food Manufacturing
Pigging Solutions in Pet Food ManufacturingPigging Solutions
 
New from BookNet Canada for 2024: BNC BiblioShare - Tech Forum 2024
New from BookNet Canada for 2024: BNC BiblioShare - Tech Forum 2024New from BookNet Canada for 2024: BNC BiblioShare - Tech Forum 2024
New from BookNet Canada for 2024: BNC BiblioShare - Tech Forum 2024BookNet Canada
 
CloudStudio User manual (basic edition):
CloudStudio User manual (basic edition):CloudStudio User manual (basic edition):
CloudStudio User manual (basic edition):comworks
 
Connect Wave/ connectwave Pitch Deck Presentation
Connect Wave/ connectwave Pitch Deck PresentationConnect Wave/ connectwave Pitch Deck Presentation
Connect Wave/ connectwave Pitch Deck PresentationSlibray Presentation
 
"ML in Production",Oleksandr Bagan
"ML in Production",Oleksandr Bagan"ML in Production",Oleksandr Bagan
"ML in Production",Oleksandr BaganFwdays
 
WordPress Websites for Engineers: Elevate Your Brand
WordPress Websites for Engineers: Elevate Your BrandWordPress Websites for Engineers: Elevate Your Brand
WordPress Websites for Engineers: Elevate Your Brandgvaughan
 
Transcript: New from BookNet Canada for 2024: BNC BiblioShare - Tech Forum 2024
Transcript: New from BookNet Canada for 2024: BNC BiblioShare - Tech Forum 2024Transcript: New from BookNet Canada for 2024: BNC BiblioShare - Tech Forum 2024
Transcript: New from BookNet Canada for 2024: BNC BiblioShare - Tech Forum 2024BookNet Canada
 
"Debugging python applications inside k8s environment", Andrii Soldatenko
"Debugging python applications inside k8s environment", Andrii Soldatenko"Debugging python applications inside k8s environment", Andrii Soldatenko
"Debugging python applications inside k8s environment", Andrii SoldatenkoFwdays
 
Designing IA for AI - Information Architecture Conference 2024
Designing IA for AI - Information Architecture Conference 2024Designing IA for AI - Information Architecture Conference 2024
Designing IA for AI - Information Architecture Conference 2024Enterprise Knowledge
 
Bun (KitWorks Team Study 노별마루 발표 2024.4.22)
Bun (KitWorks Team Study 노별마루 발표 2024.4.22)Bun (KitWorks Team Study 노별마루 발표 2024.4.22)
Bun (KitWorks Team Study 노별마루 발표 2024.4.22)Wonjun Hwang
 
Kotlin Multiplatform & Compose Multiplatform - Starter kit for pragmatics
Kotlin Multiplatform & Compose Multiplatform - Starter kit for pragmaticsKotlin Multiplatform & Compose Multiplatform - Starter kit for pragmatics
Kotlin Multiplatform & Compose Multiplatform - Starter kit for pragmaticscarlostorres15106
 
Science&tech:THE INFORMATION AGE STS.pdf
Science&tech:THE INFORMATION AGE STS.pdfScience&tech:THE INFORMATION AGE STS.pdf
Science&tech:THE INFORMATION AGE STS.pdfjimielynbastida
 
Advanced Test Driven-Development @ php[tek] 2024
Advanced Test Driven-Development @ php[tek] 2024Advanced Test Driven-Development @ php[tek] 2024
Advanced Test Driven-Development @ php[tek] 2024Scott Keck-Warren
 
Integration and Automation in Practice: CI/CD in Mule Integration and Automat...
Integration and Automation in Practice: CI/CD in Mule Integration and Automat...Integration and Automation in Practice: CI/CD in Mule Integration and Automat...
Integration and Automation in Practice: CI/CD in Mule Integration and Automat...Patryk Bandurski
 

Recently uploaded (20)

APIForce Zurich 5 April Automation LPDG
APIForce Zurich 5 April  Automation LPDGAPIForce Zurich 5 April  Automation LPDG
APIForce Zurich 5 April Automation LPDG
 
Understanding the Laravel MVC Architecture
Understanding the Laravel MVC ArchitectureUnderstanding the Laravel MVC Architecture
Understanding the Laravel MVC Architecture
 
SIP trunking in Janus @ Kamailio World 2024
SIP trunking in Janus @ Kamailio World 2024SIP trunking in Janus @ Kamailio World 2024
SIP trunking in Janus @ Kamailio World 2024
 
Unleash Your Potential - Namagunga Girls Coding Club
Unleash Your Potential - Namagunga Girls Coding ClubUnleash Your Potential - Namagunga Girls Coding Club
Unleash Your Potential - Namagunga Girls Coding Club
 
Pigging Solutions in Pet Food Manufacturing
Pigging Solutions in Pet Food ManufacturingPigging Solutions in Pet Food Manufacturing
Pigging Solutions in Pet Food Manufacturing
 
New from BookNet Canada for 2024: BNC BiblioShare - Tech Forum 2024
New from BookNet Canada for 2024: BNC BiblioShare - Tech Forum 2024New from BookNet Canada for 2024: BNC BiblioShare - Tech Forum 2024
New from BookNet Canada for 2024: BNC BiblioShare - Tech Forum 2024
 
CloudStudio User manual (basic edition):
CloudStudio User manual (basic edition):CloudStudio User manual (basic edition):
CloudStudio User manual (basic edition):
 
Connect Wave/ connectwave Pitch Deck Presentation
Connect Wave/ connectwave Pitch Deck PresentationConnect Wave/ connectwave Pitch Deck Presentation
Connect Wave/ connectwave Pitch Deck Presentation
 
"ML in Production",Oleksandr Bagan
"ML in Production",Oleksandr Bagan"ML in Production",Oleksandr Bagan
"ML in Production",Oleksandr Bagan
 
WordPress Websites for Engineers: Elevate Your Brand
WordPress Websites for Engineers: Elevate Your BrandWordPress Websites for Engineers: Elevate Your Brand
WordPress Websites for Engineers: Elevate Your Brand
 
Transcript: New from BookNet Canada for 2024: BNC BiblioShare - Tech Forum 2024
Transcript: New from BookNet Canada for 2024: BNC BiblioShare - Tech Forum 2024Transcript: New from BookNet Canada for 2024: BNC BiblioShare - Tech Forum 2024
Transcript: New from BookNet Canada for 2024: BNC BiblioShare - Tech Forum 2024
 
E-Vehicle_Hacking_by_Parul Sharma_null_owasp.pptx
E-Vehicle_Hacking_by_Parul Sharma_null_owasp.pptxE-Vehicle_Hacking_by_Parul Sharma_null_owasp.pptx
E-Vehicle_Hacking_by_Parul Sharma_null_owasp.pptx
 
"Debugging python applications inside k8s environment", Andrii Soldatenko
"Debugging python applications inside k8s environment", Andrii Soldatenko"Debugging python applications inside k8s environment", Andrii Soldatenko
"Debugging python applications inside k8s environment", Andrii Soldatenko
 
Designing IA for AI - Information Architecture Conference 2024
Designing IA for AI - Information Architecture Conference 2024Designing IA for AI - Information Architecture Conference 2024
Designing IA for AI - Information Architecture Conference 2024
 
Bun (KitWorks Team Study 노별마루 발표 2024.4.22)
Bun (KitWorks Team Study 노별마루 발표 2024.4.22)Bun (KitWorks Team Study 노별마루 발표 2024.4.22)
Bun (KitWorks Team Study 노별마루 발표 2024.4.22)
 
Kotlin Multiplatform & Compose Multiplatform - Starter kit for pragmatics
Kotlin Multiplatform & Compose Multiplatform - Starter kit for pragmaticsKotlin Multiplatform & Compose Multiplatform - Starter kit for pragmatics
Kotlin Multiplatform & Compose Multiplatform - Starter kit for pragmatics
 
Science&tech:THE INFORMATION AGE STS.pdf
Science&tech:THE INFORMATION AGE STS.pdfScience&tech:THE INFORMATION AGE STS.pdf
Science&tech:THE INFORMATION AGE STS.pdf
 
DMCC Future of Trade Web3 - Special Edition
DMCC Future of Trade Web3 - Special EditionDMCC Future of Trade Web3 - Special Edition
DMCC Future of Trade Web3 - Special Edition
 
Advanced Test Driven-Development @ php[tek] 2024
Advanced Test Driven-Development @ php[tek] 2024Advanced Test Driven-Development @ php[tek] 2024
Advanced Test Driven-Development @ php[tek] 2024
 
Integration and Automation in Practice: CI/CD in Mule Integration and Automat...
Integration and Automation in Practice: CI/CD in Mule Integration and Automat...Integration and Automation in Practice: CI/CD in Mule Integration and Automat...
Integration and Automation in Practice: CI/CD in Mule Integration and Automat...
 

Chapter 10-DATA ANALYSIS & PRESENTATION

  • 3. Data Analysis  The purpose  To answer the research questions and to help determine the trends and relationships among the variables.
  • 4. Steps in Data Analysis  Before Data Collection, the researcher should accomplish the following:  Determine the method of data analysis  Determine how to process the data  Consult a statistician  Prepare dummy tables  After Data Collection:  Process the data  Prepare tables and graphs  Analyze and interpret findings  Consult again the statistician  Prepare for editing  Prepare for presentation
  • 5. Classification of Descriptive Analysis Kinds of Data Analysis 1. Descriptive Analysis 2. Inferential Analysis
  • 6. 1. Descriptive Analysis  refers to the description of the data from a particular sample;  hence the conclusion must refer only to the sample.  In other words, these summarize the data and describe sample characteristics.  Descriptive Statistics  are numerical values obtained from the sample that gives meaning to the data collected.
  • 7. Classification of Descriptive Analysis a. Frequency Distribution  A systematic arrangement of numeric values from the lowest to the highest or highest to lowest.  Formula: Ef = N  Where: E = sum of f = frequency N= sample size
  • 8. Classification of Descriptive Analysis b. Measure of Central Tendency  A statistical index that describes the average of the set values.  Kinds of Averages 1. Mode - a numeric value in a distribution that occurs most frequently.  2. Median - an index of average position in a distribution of numbers.  3. Mean - the point on the score scale that is equal to the sum of the scores divided by the total number of scores.  Formula: Where: X= Σ___ X = the mean n Σ = the sum of X = each individual raw score n = the number of cases
  • 9. Classification of Descriptive Analysis c. Measure of Variability  Statistics that concern the degree to which the scores in a distribution are different from or similar to each other.
  • 10. Two Commonly Used Measures of Variability 1. Range - the distance between the highest score and the lowest score in a distribution. Example: The range for learning center A 500 (750 - 250) and the range for learning center is about 300 (650 - 350) 2. Standard Deviation - the most commonly used measure of variability that indicates the average to which the scores deviate from the mean.
  • 11. Classification of Descriptive Analysis d. Bivariate Descriptive Statistics  Derived from the simultaneous analysis of two variables to examine the relationships between the variables.  Two Commonly Used Bivariate Descriptive Analysis 5. Contingency tables - is essentially a two-dimensional frequency distribution in which the frequencies of two variables are cross-tabulated.  Correlation - the most common method of describing the relationship between two measures
  • 12. Classification of Descriptive Analysis Kinds of Data Analysis 1. Descriptive Analysis 2. Inferential Analysis
  • 13. 2. Inferential Analysis  The use of statistical tests, either to test for significant relationships among variables or to find statistical support for the hypotheses.  Inferential Statistics  are numerical values that enable the researcher to draw conclusion about a population based on the characteristics of a population sample.  This is based on the laws of probability.
  • 14. Level of Significance  An important factor in determining the representativeness of the sample population and the degree to which the chance affects the findings.  The level of significance is a numerical value selected by the researcher before data collection to indicate the probability of erroneous findings being accepted as true.  This value is represented typically as 0.01 or 0.05. (Massey,1991)
  • 15. Uses of Inferential Analysis  Cited some statistical test for inferential analysis. 1. t-test is used to examine the difference between the means of two independent groups. 2. Analysis of Variance (ANOVA) - is used to test the significance of differences between means of two or more groups. 3. Chi-square - this is used to test hypotheses about the proportion of elements that fall into various cells of a contingency table.
  • 16. Hypothesis - Testing Procedures  The outcome of the study perhaps may retain, revise or reject the hypothesis and this determines the acceptability of hypotheses and the theory from which it was derived.
  • 17. Steps in testing hypothesis:  Determine the test statistics to be used  Establish the level of significance  Select a one-tailed or two-tailed test  Compute a test statistic  Calculate the degrees of freedom  Obtain a tabled value for statistical test  Compare the test statistics to the tabled value
  • 18. Presentation of Findings  Findings are presented in different forms such as: 1. Narrative or textual form  This is composed of summary of findings, direct quotations and implications of the study. 2. Tables  Tables are used to present a clear and organized data.  This is utilized for easy analysis and interpretation of data.
  • 19. The parts of tabular data are presented in the following:  Rows - horizontal entries (indicates the outcome or the dependent variable)  Columns - vertical entries (indicates the cause or the independent variable)  Cells - are boxes where rows and columns intersect.
  • 20. Parts of Table Columns COLUMN ROW CELL
  • 21. Interpretation of Data  After analysis of data and the appropriate statistical procedure, the next chapter of the research paper is to present the interpretation of the data, which is the final step of research process.  The three areas:  Summary of Findings  Conclusions  Recommendations
  • 22. Summary of Findings  This portion summarizes the result of data analysis from chapter 4. The best thing is to review the stated problem and tie up with the result of your data analysis.
  • 23. Conclusions  A conclusion is drawn from the summary of findings.  focuses on the answers to the problem including the outcome of the hypotheses whether it is rejected or accepted.
  • 24. Recommendations  This is based on the result of the conclusions  The main goal is geared toward improvement or development
  • 26. Writing the Final Output  The researcher should know not only the parts in research process but also the forms and style in writing the research proposal and the research paper
  • 27. The Format of Writing the Study
  • 28. Preliminary Pages 1. Title page/ Title of the Study - is a phrase that describes the research study. - It should not be too long or too short as well as too vague and general. 2. Acknowledgement Page - is a section wherein the researcher expresses his deep gratitude for those persons who assisted and helped him to make the study a successful one.
  • 29. 3. Table of Contents - from the word itself, it contains all the parts of the research paper including the pages. 4. List of Tables - this follows the table of content and indicates the title of the tables in the research paper. 5. List of Figures - is composed of paradigms, diagrams, graphs and charts or flowcharts.
  • 31. Main Body  Chapter I. Introduction  This section refers to:  “What this study is all about” or “What makes the researcher interested in doing the study”.  Purpose: to introduce the reader to the subject matter.  The introduction serves as a springboard for the statement of the problem as stated by Dr. Barrientos-Tan.
  • 32. Chapter II. Review of Related Literature  Chapter III. Research Design and Methodology  Chapter IV. Analysis and Interpretation of Data  Chapter V. Summary, Conclusions, and Recommendations Supplementary Pages  Bibliography  Appendix
  • 33. Sample of Table of Contents
  • 34. Table of Contents Acknowledgment List of Tables List of Figures Chapter I The Problem and its Background Introduction Background of the Study Conceptual Framework/Theoretical Statement of the Problem Hypotheses Significance of the Study Scope and Delimitation of the Study Definition of Terms
  • 35. Chapter II Review of Related Literature and Studies  Literature (Foreign/Local)  Studies (Foreign/Local)  Justification of the Present Study  Chapter III Research Design and Methodology  Research Design  Research Subject  Instrumentation  Data Gathering Procedure  Statistical Treatment of Data  Chapter IV Analysis and Interpretation of Data  Chapter V Summary, Conclusion and Recommendations  Bibliography  Appendix  Curriculum Vitae
  • 37. TABLE OF CONTENTS  indicates all the contents of research paper and the page number for each section is placed at the right-hand margin.  The page for the table of contents is usually written in Roman numeral and indicated at the bottom of the paper.
  • 38.  List of Tables  The caption should be exactly how it appears in the text.  In numbering the tables, use Arabic numerals.