This document discusses various aspects of data analysis. It outlines the basic steps in research and data analysis, including identifying the problem, collecting data, analyzing and interpreting results. Both qualitative and quantitative data analysis methods are covered. Descriptive statistics are used to summarize data through measures like frequencies and central tendency. Inferential statistics allow generalization to populations through hypothesis testing using techniques like t-tests and chi-square tests. The document provides an overview of common statistical analysis methods and selecting the appropriate tests.
Presentation details and a comprehensive overview of data analysis topics.
Basics of research including data analysis, research steps, and methods of identifying problems.
Steps for analyzing data including pre- and post-collection tasks and consulting with experts.
Differentiation between qualitative and quantitative data analysis and the statistical methods applied.Overview of descriptive and inferential statistics, including types and calculations in analysis.
Function of inferential statistics in making generalizations from samples to populations.
Detailing parametric and nonparametric tests such as the t test and chi square.
Overview of advanced investigative techniques like data mining and factor analysis.
Summary function of data analysis including the interpretation of results from experiments.
List of references that support the contents and methods used in the presentation.
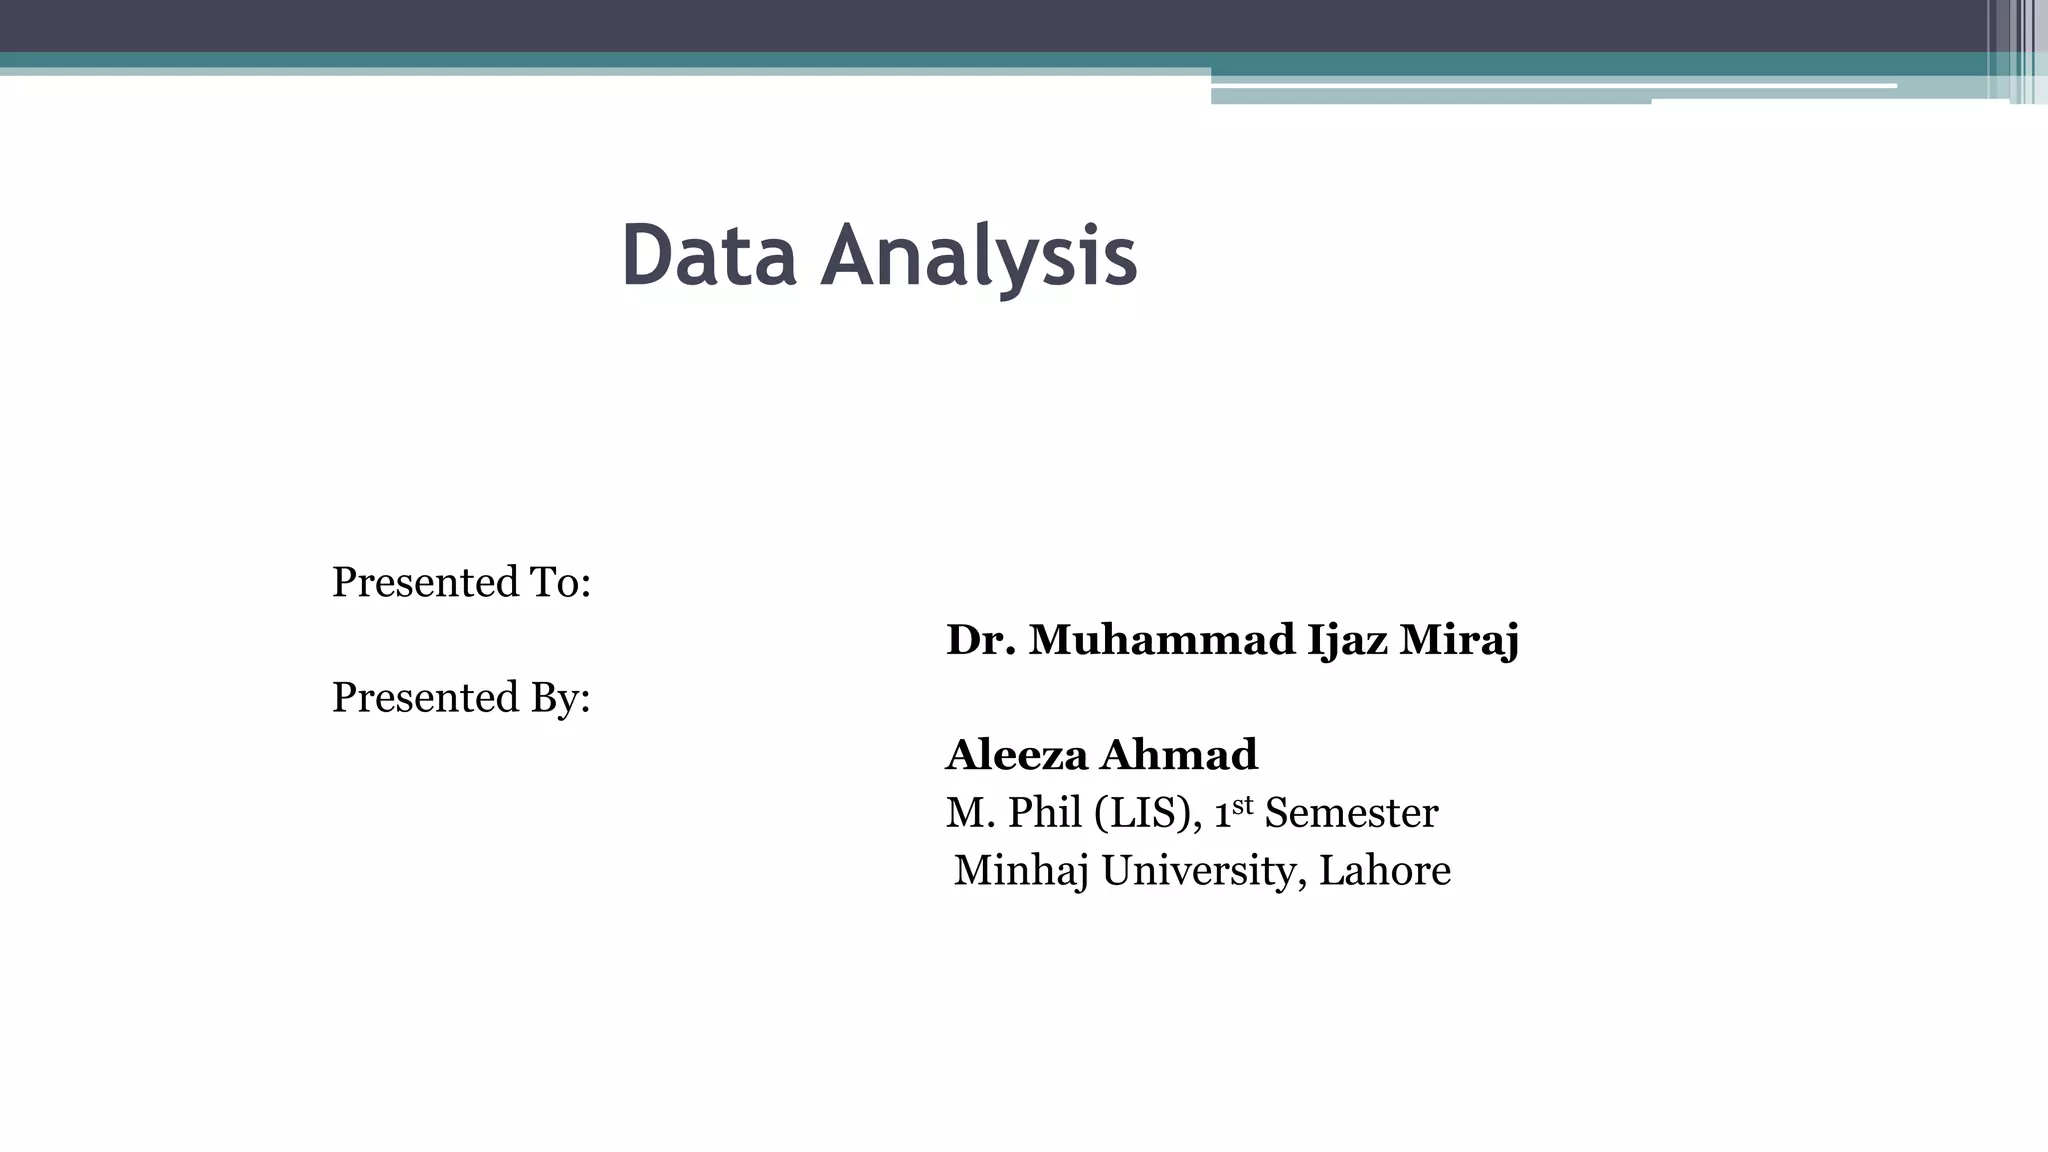
Data Analysis
Presented To:
Dr.Muhammad Ijaz Miraj
Presented By:
Aleeza Ahmad
M. Phil (LIS), 1st Semester
Minhaj University, Lahore
2.
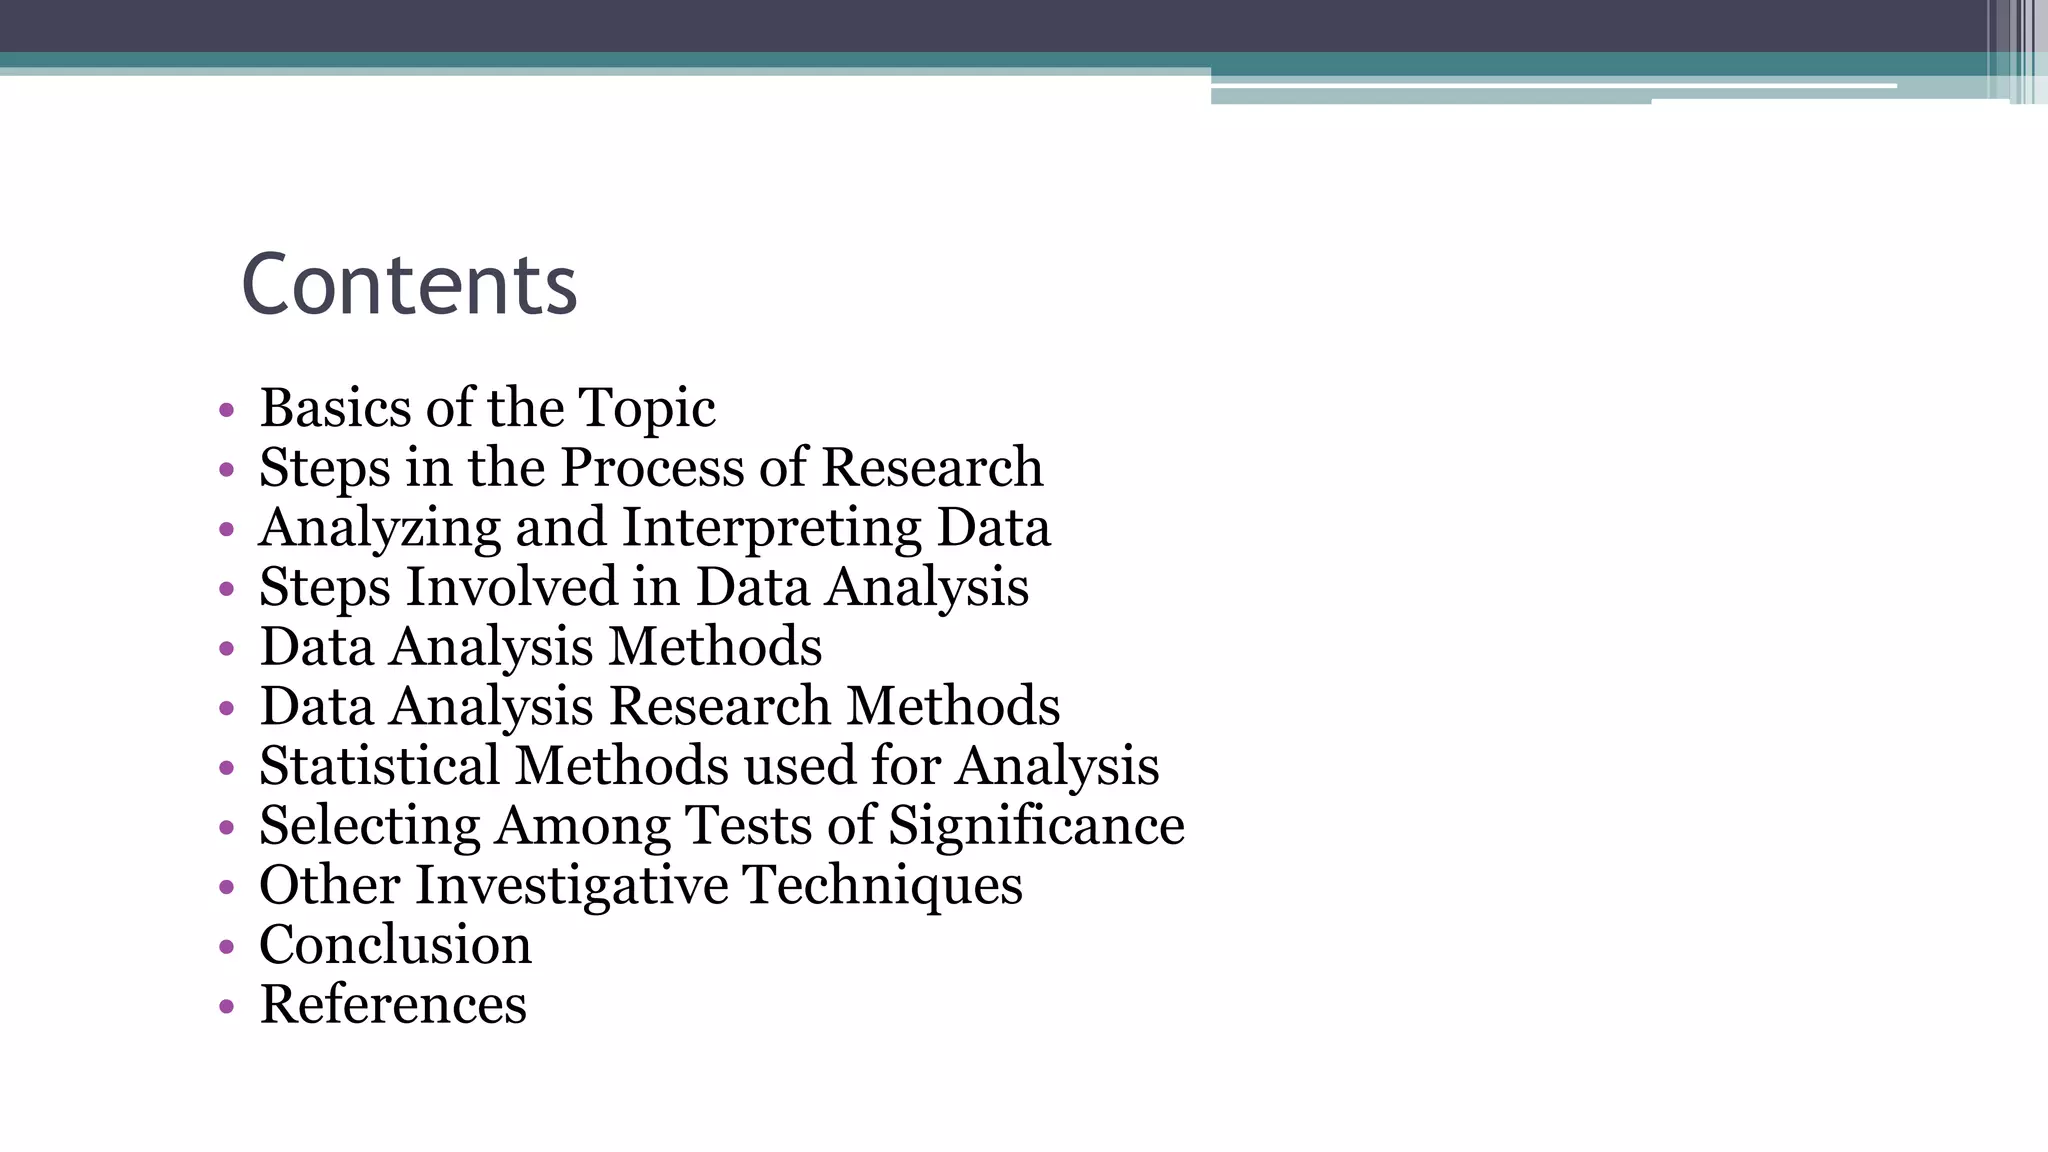
Contents
• Basics ofthe Topic
• Steps in the Process of Research
• Analyzing and Interpreting Data
• Steps Involved in Data Analysis
• Data Analysis Methods
• Data Analysis Research Methods
• Statistical Methods used for Analysis
• Selecting Among Tests of Significance
• Other Investigative Techniques
• Conclusion
• References
3.
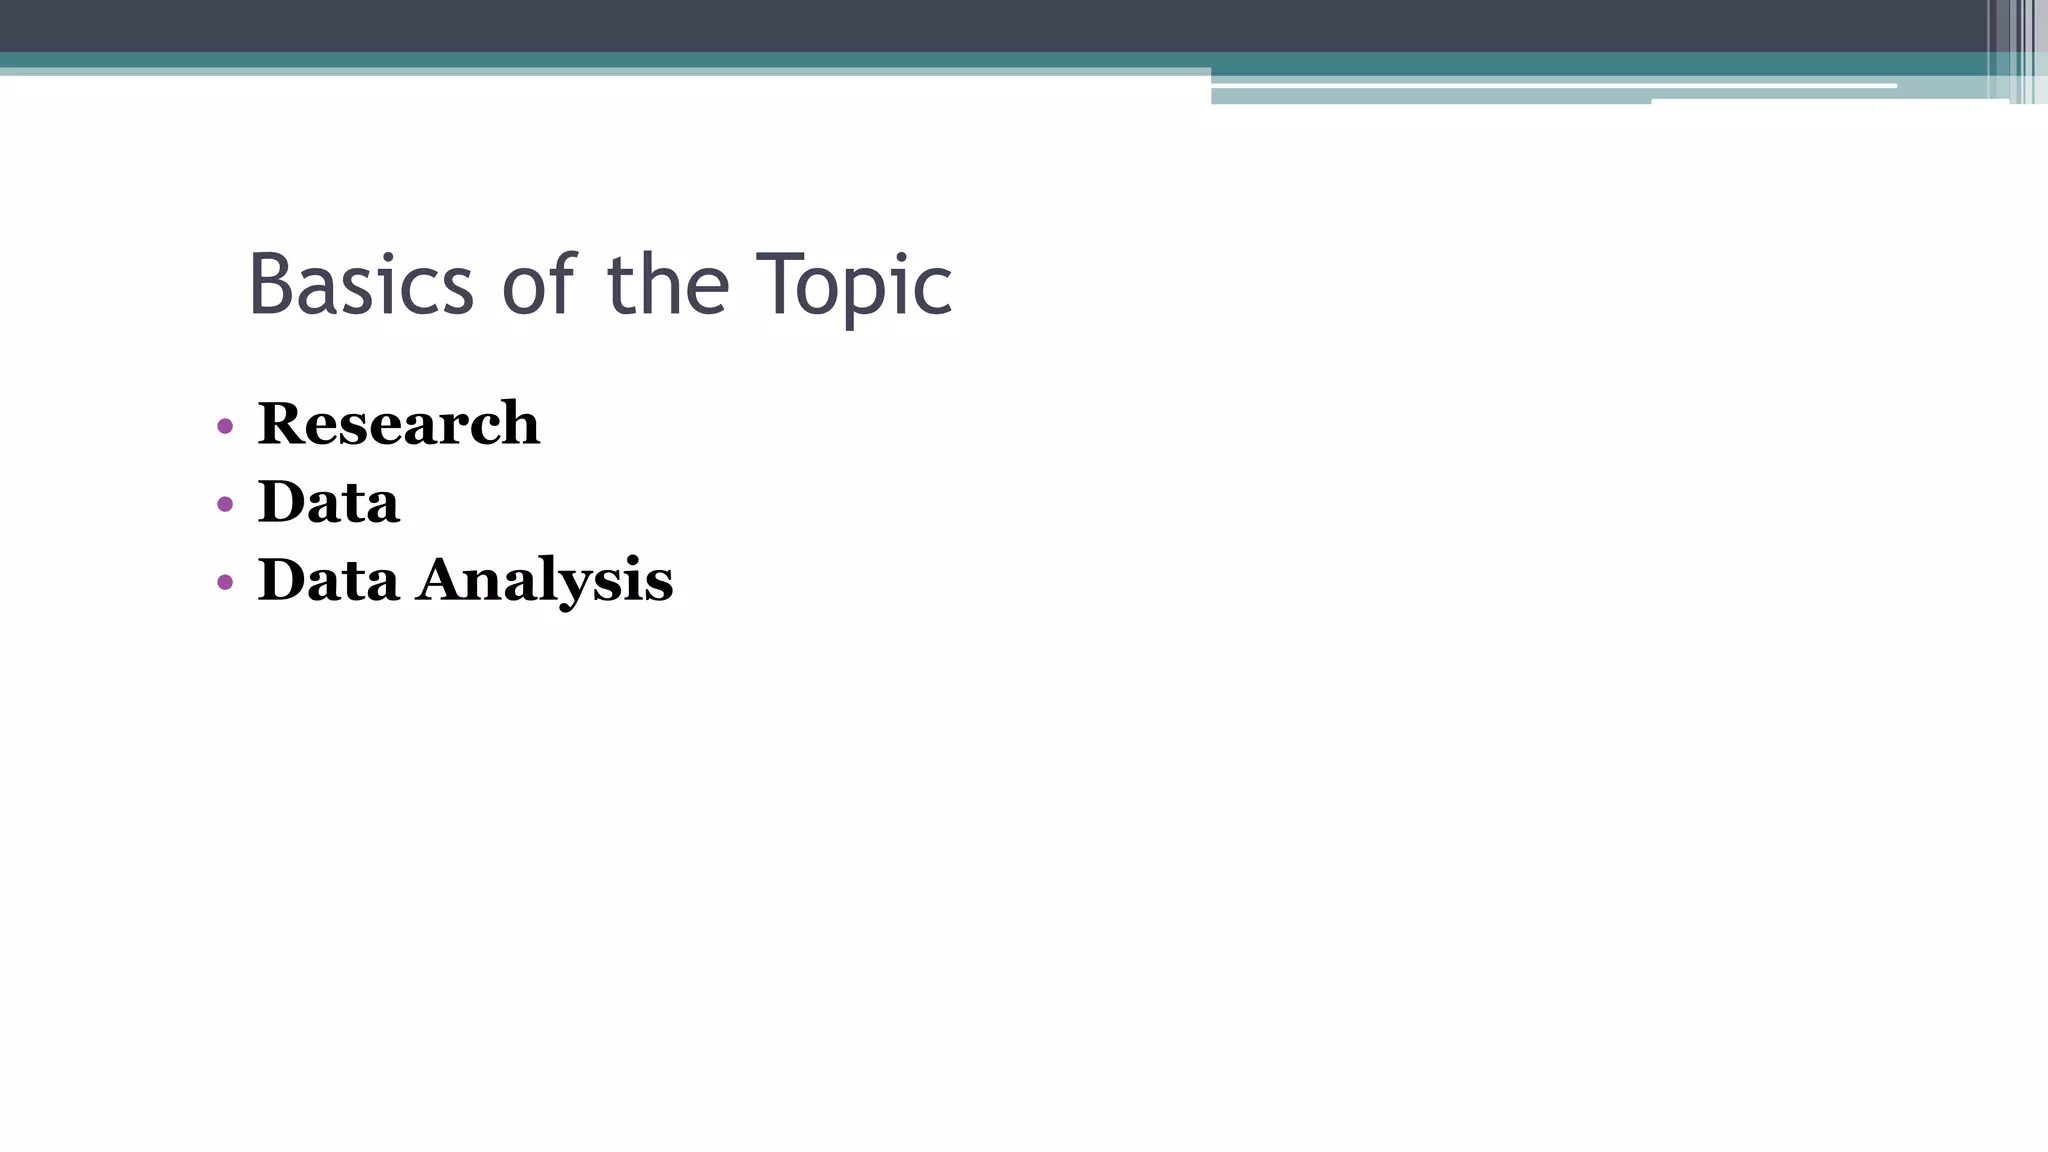
Basics of theTopic
• Research
• Data
• Data Analysis
4.
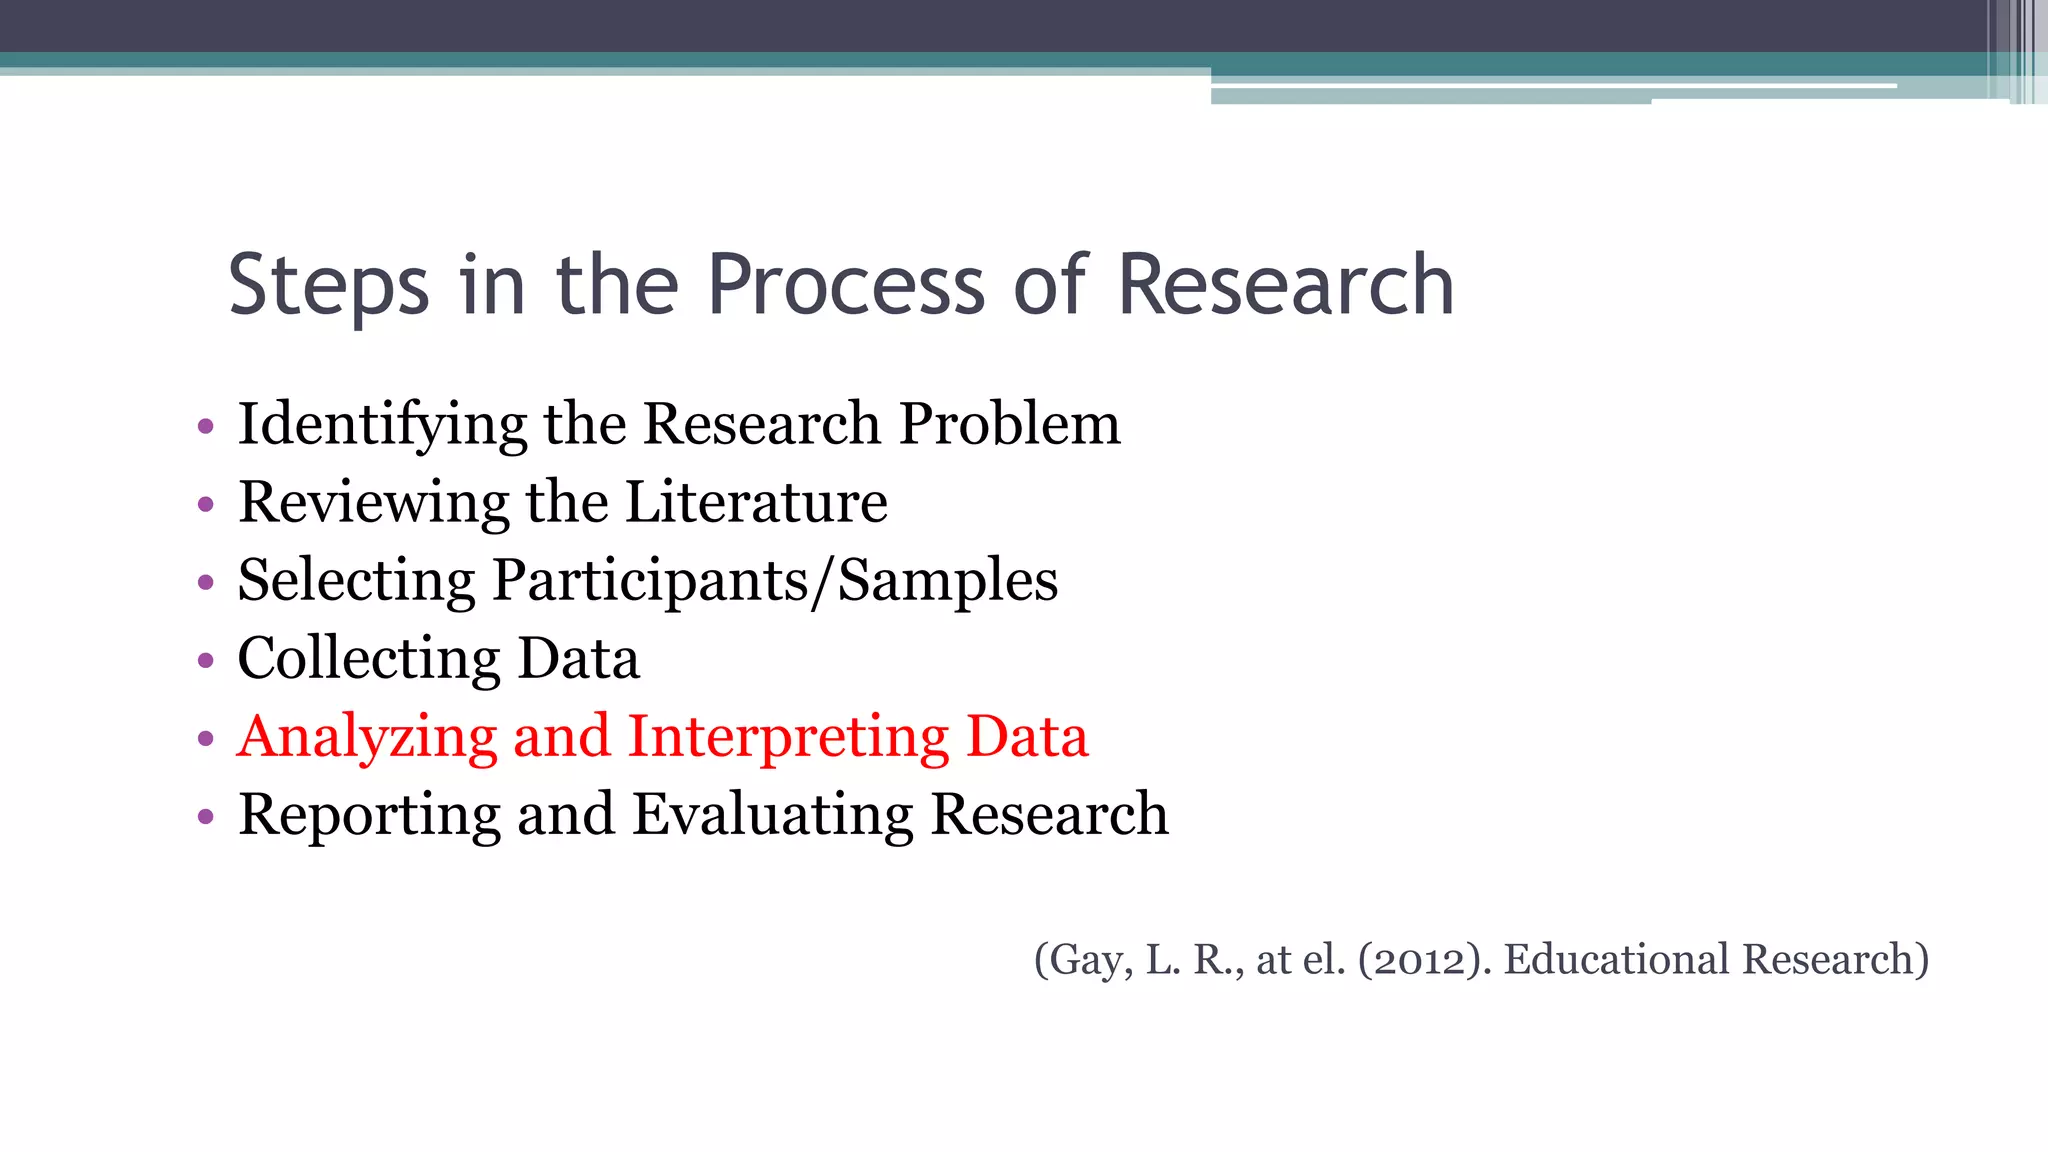
Steps in theProcess of Research
• Identifying the Research Problem
• Reviewing the Literature
• Selecting Participants/Samples
• Collecting Data
• Analyzing and Interpreting Data
• Reporting and Evaluating Research
(Gay, L. R., at el. (2012). Educational Research)
5.
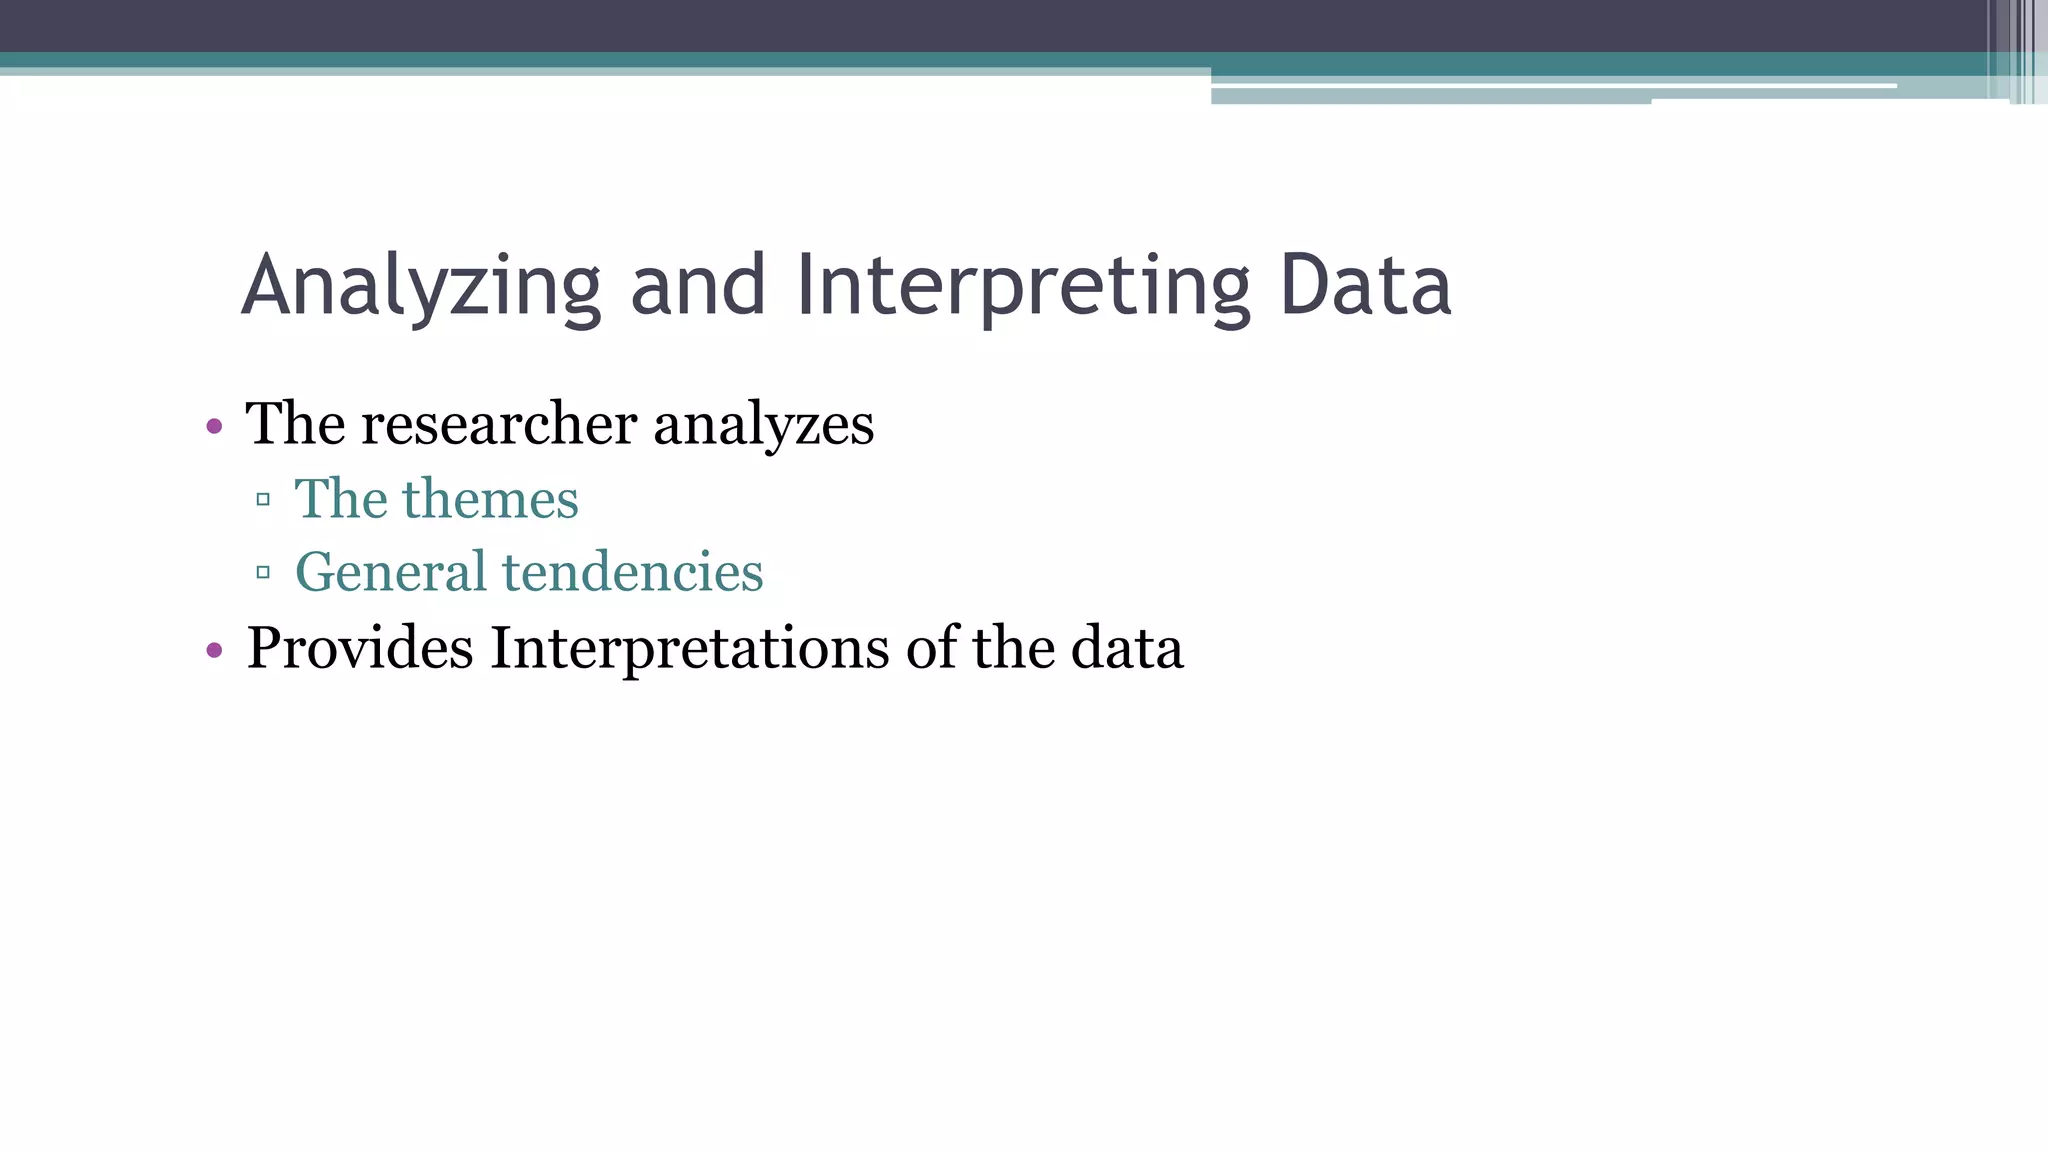
Analyzing and InterpretingData
• The researcher analyzes
▫ The themes
▫ General tendencies
• Provides Interpretations of the data
6.
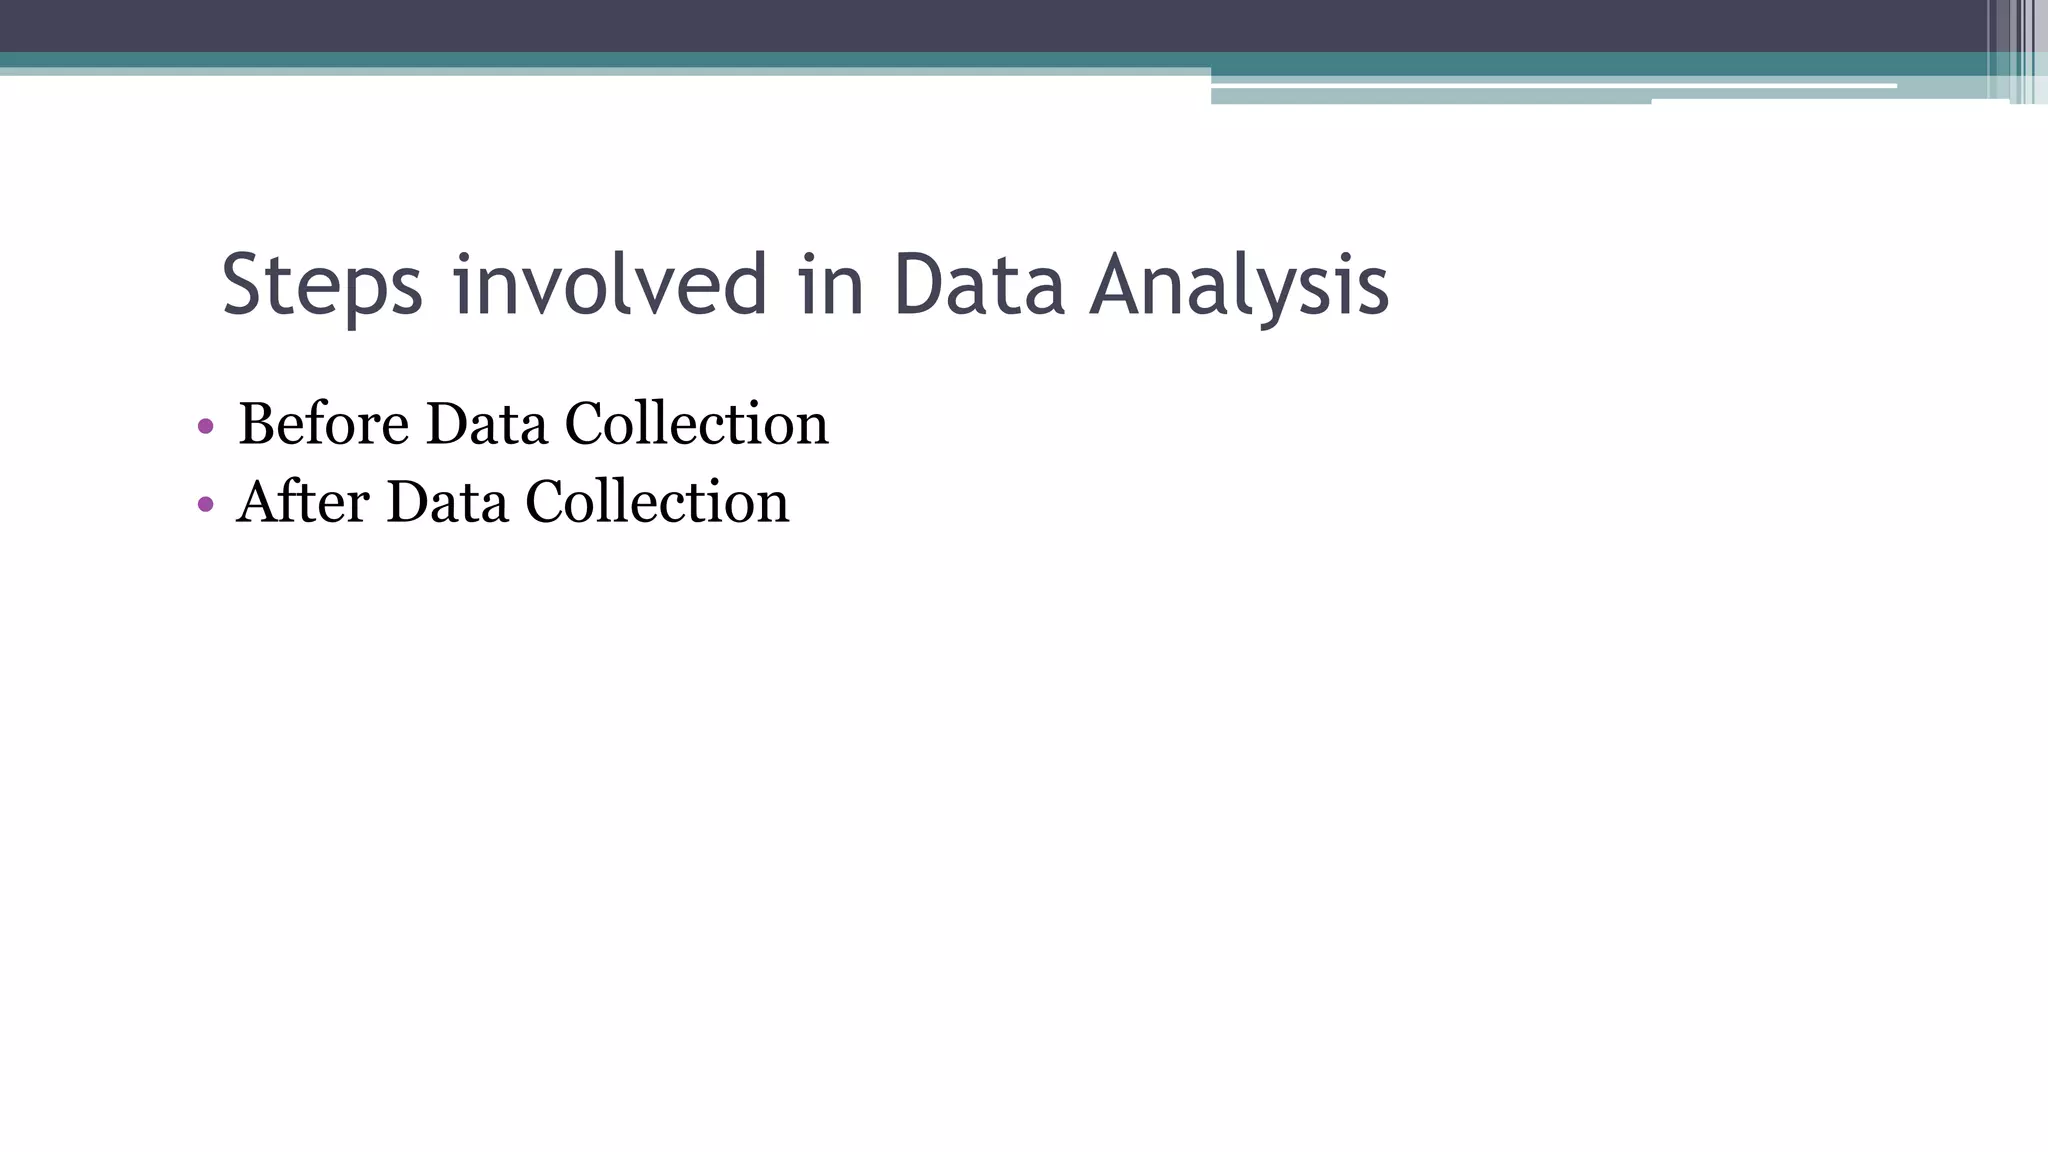
Steps involved inData Analysis
• Before Data Collection
• After Data Collection
7.
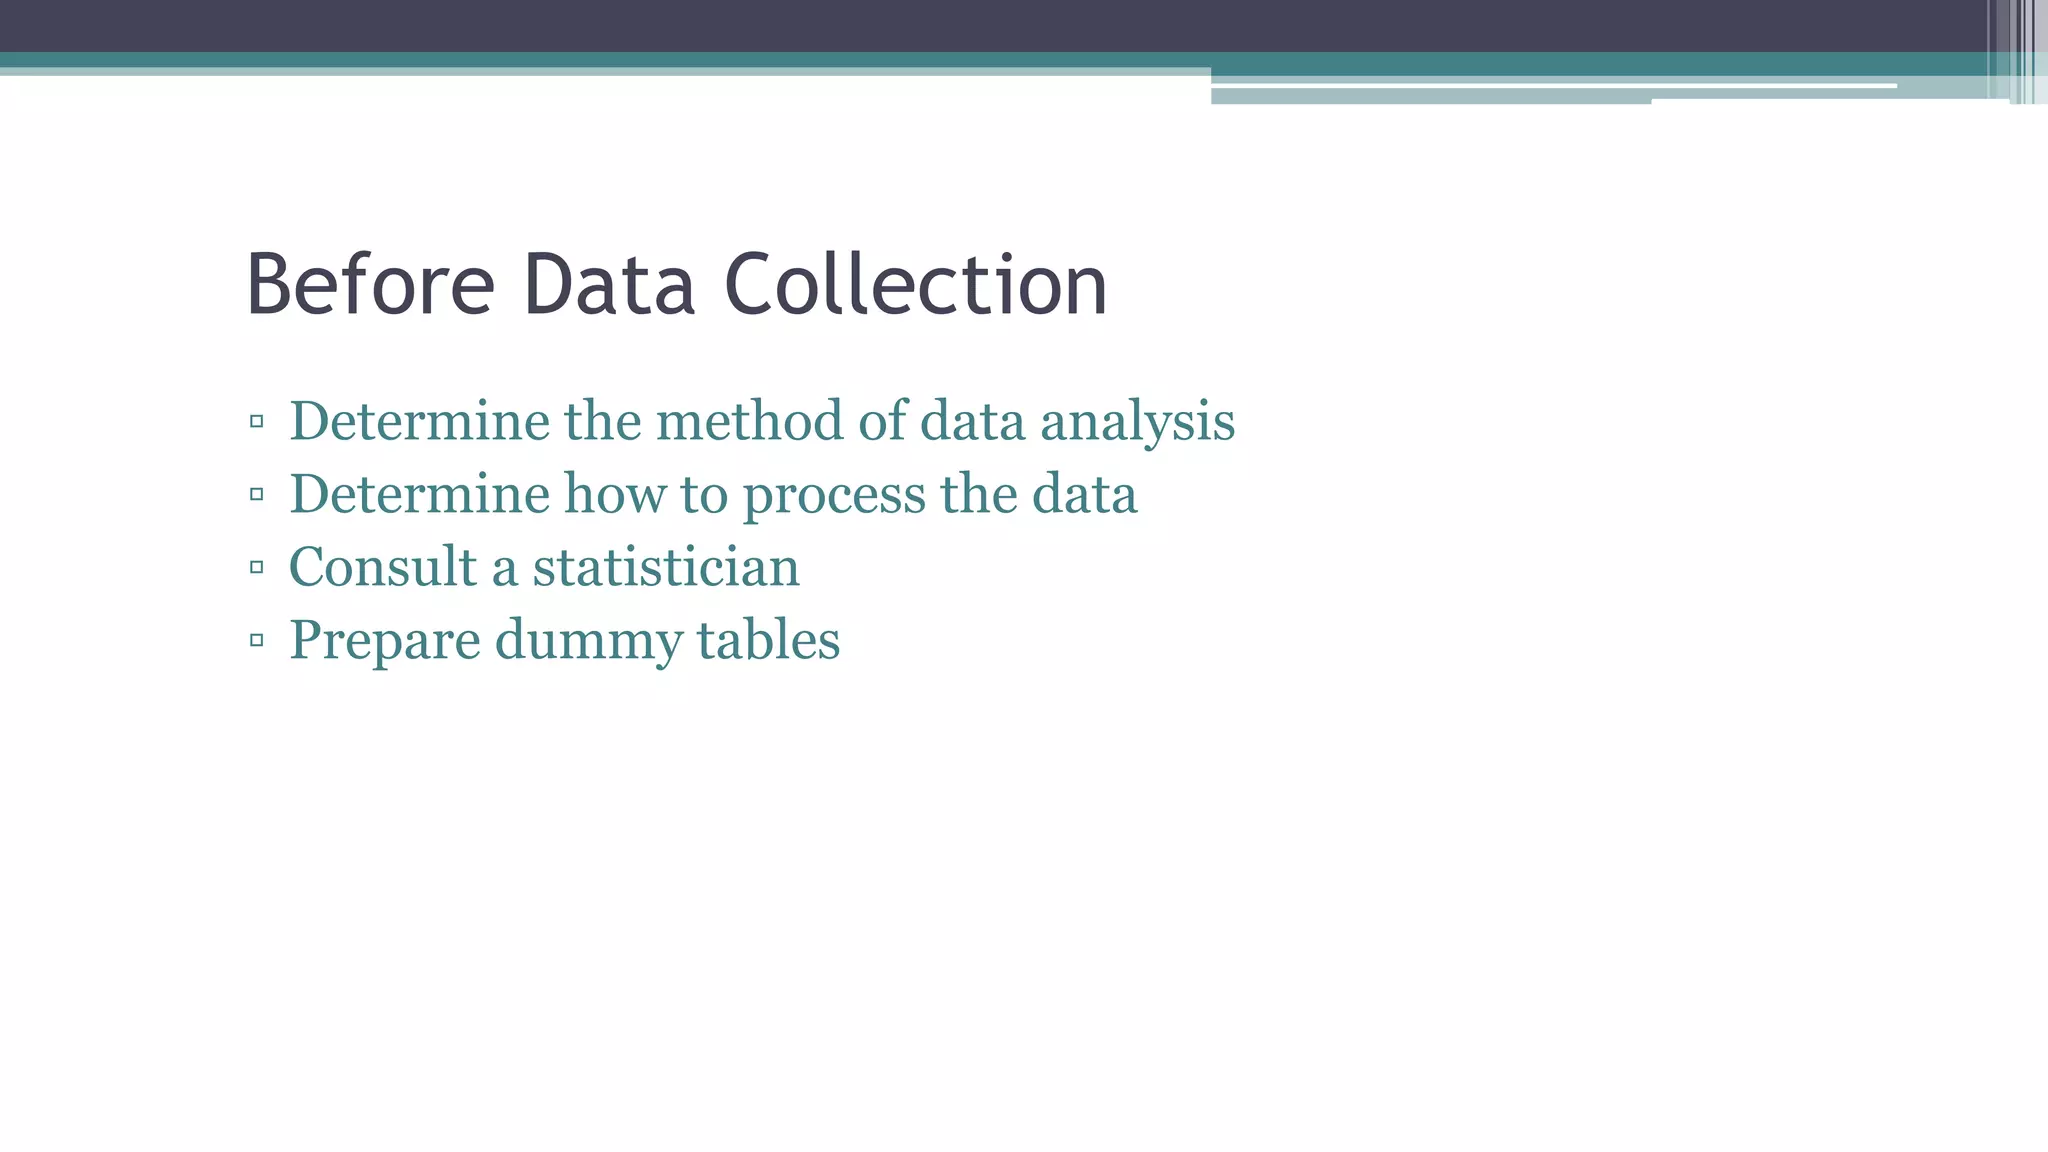
Before Data Collection
▫Determine the method of data analysis
▫ Determine how to process the data
▫ Consult a statistician
▫ Prepare dummy tables
8.
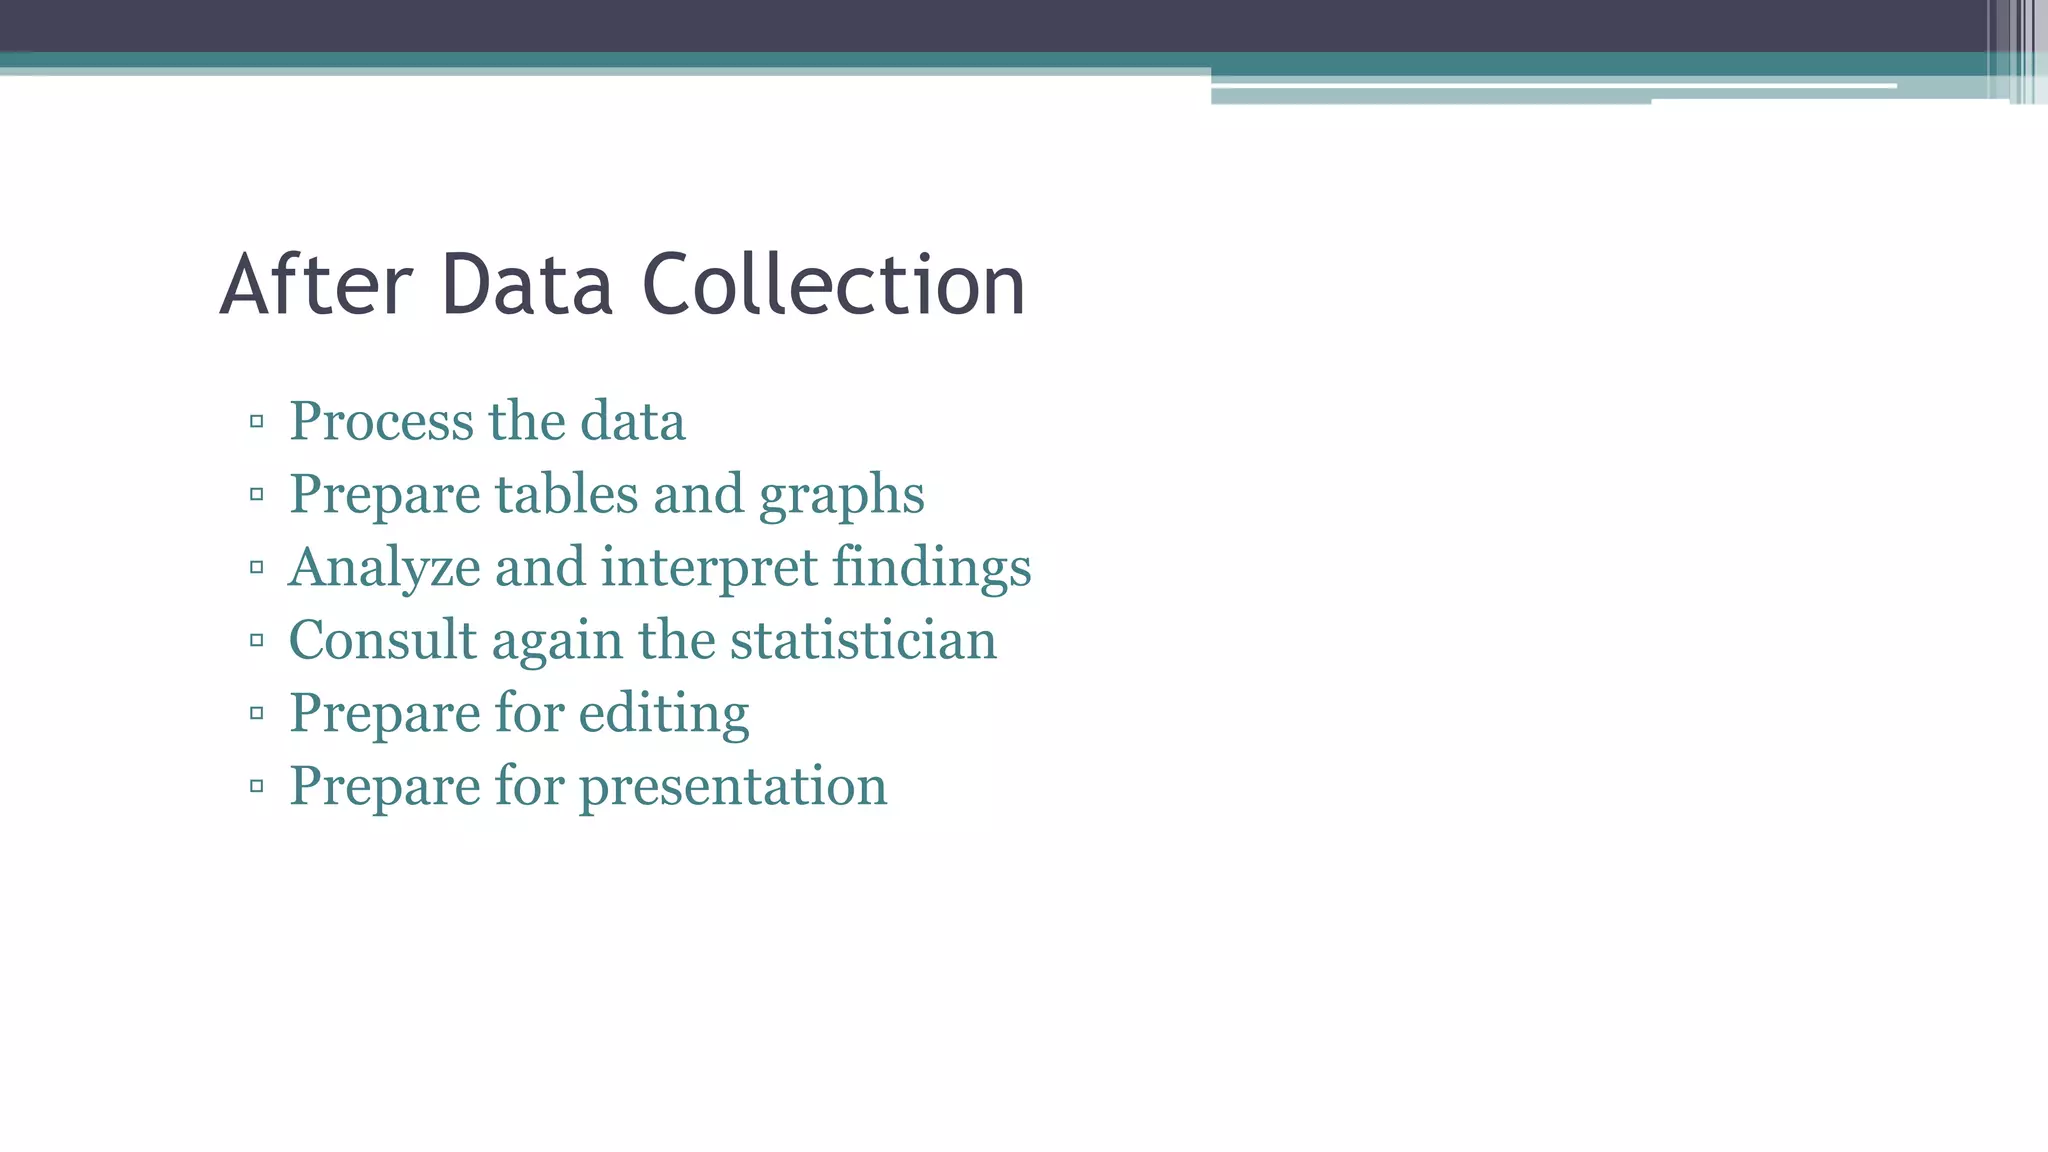
After Data Collection
▫Process the data
▫ Prepare tables and graphs
▫ Analyze and interpret findings
▫ Consult again the statistician
▫ Prepare for editing
▫ Prepare for presentation
9.
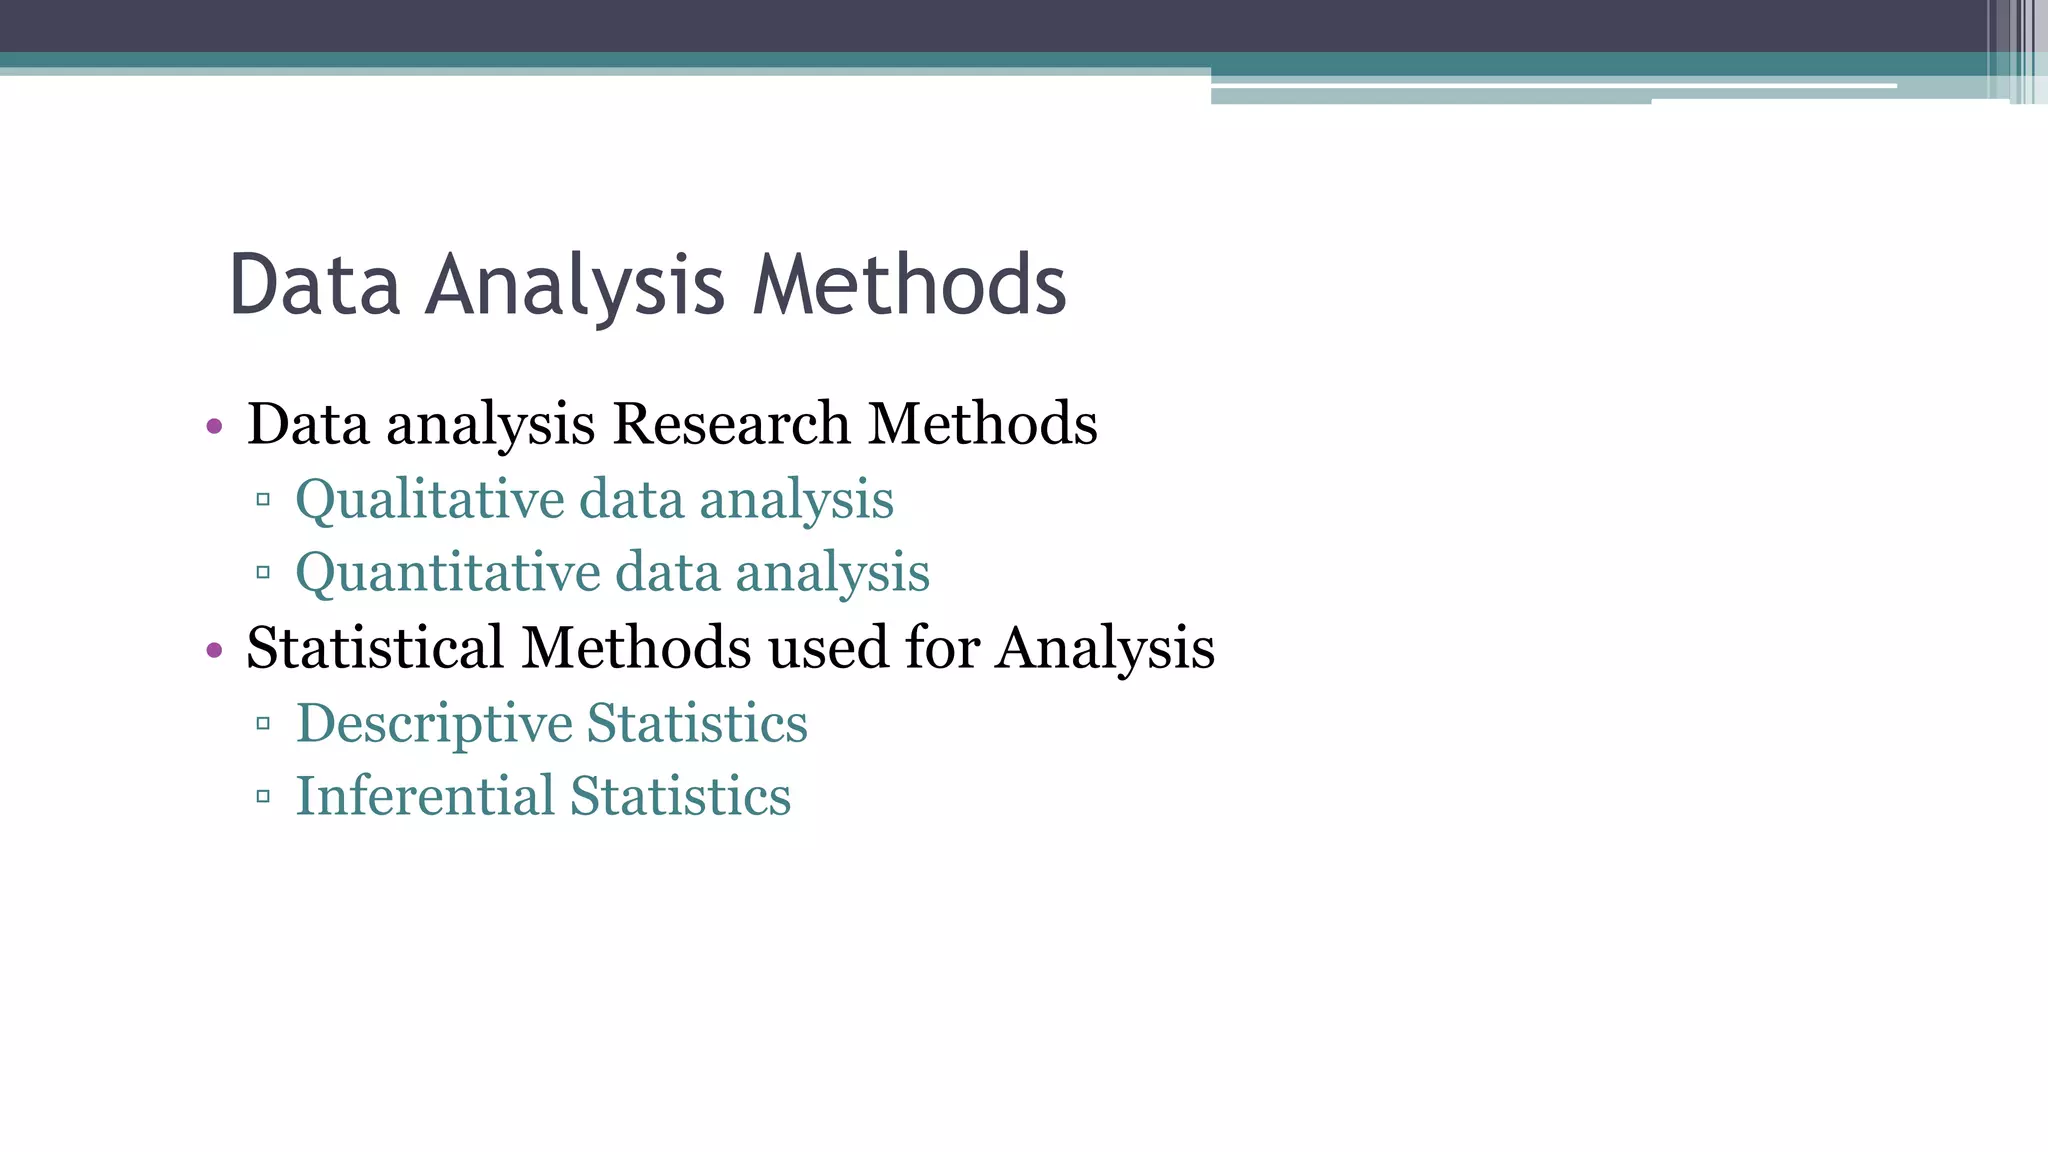
Data Analysis Methods
•Data analysis Research Methods
▫ Qualitative data analysis
▫ Quantitative data analysis
• Statistical Methods used for Analysis
▫ Descriptive Statistics
▫ Inferential Statistics
10.
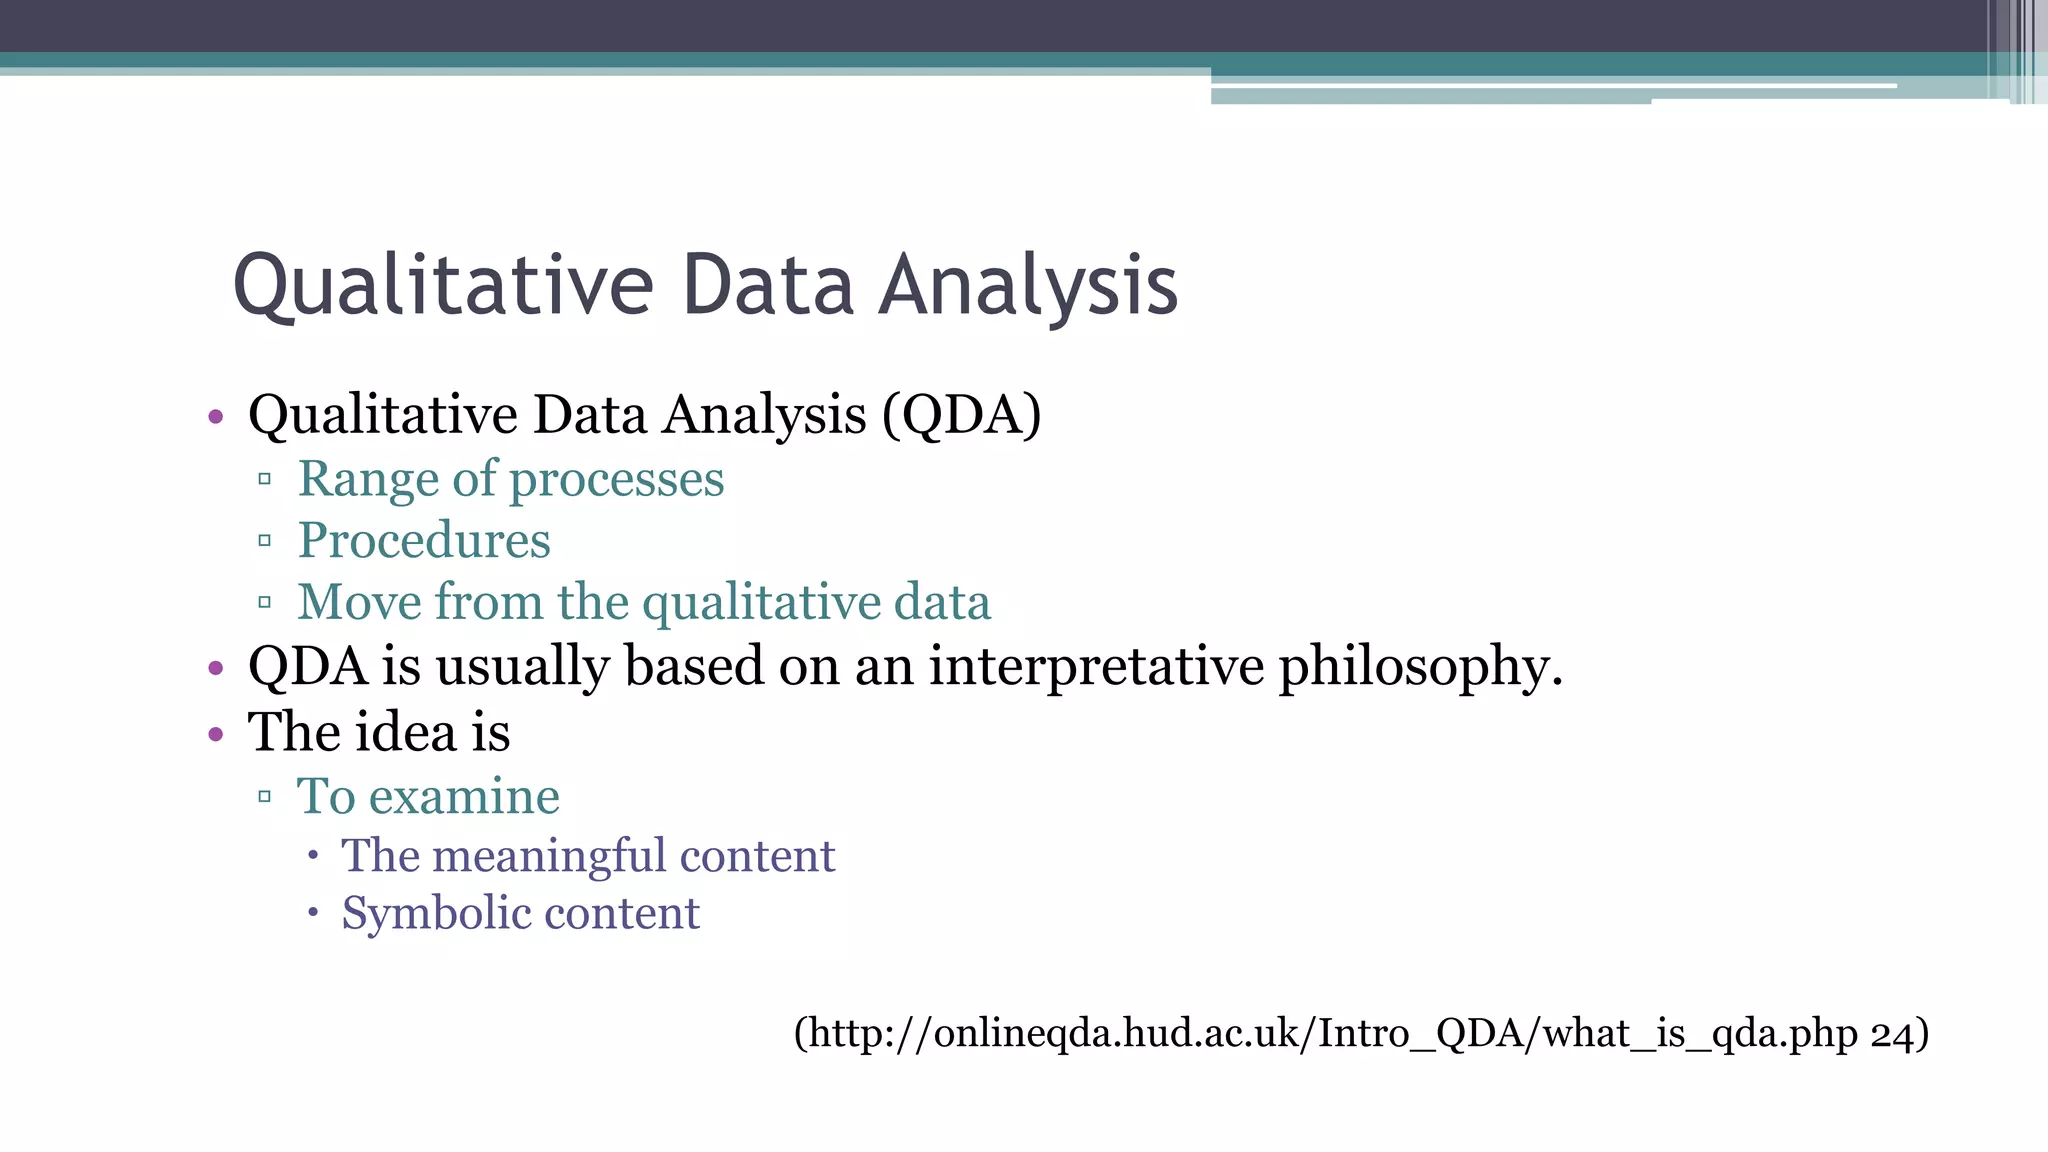
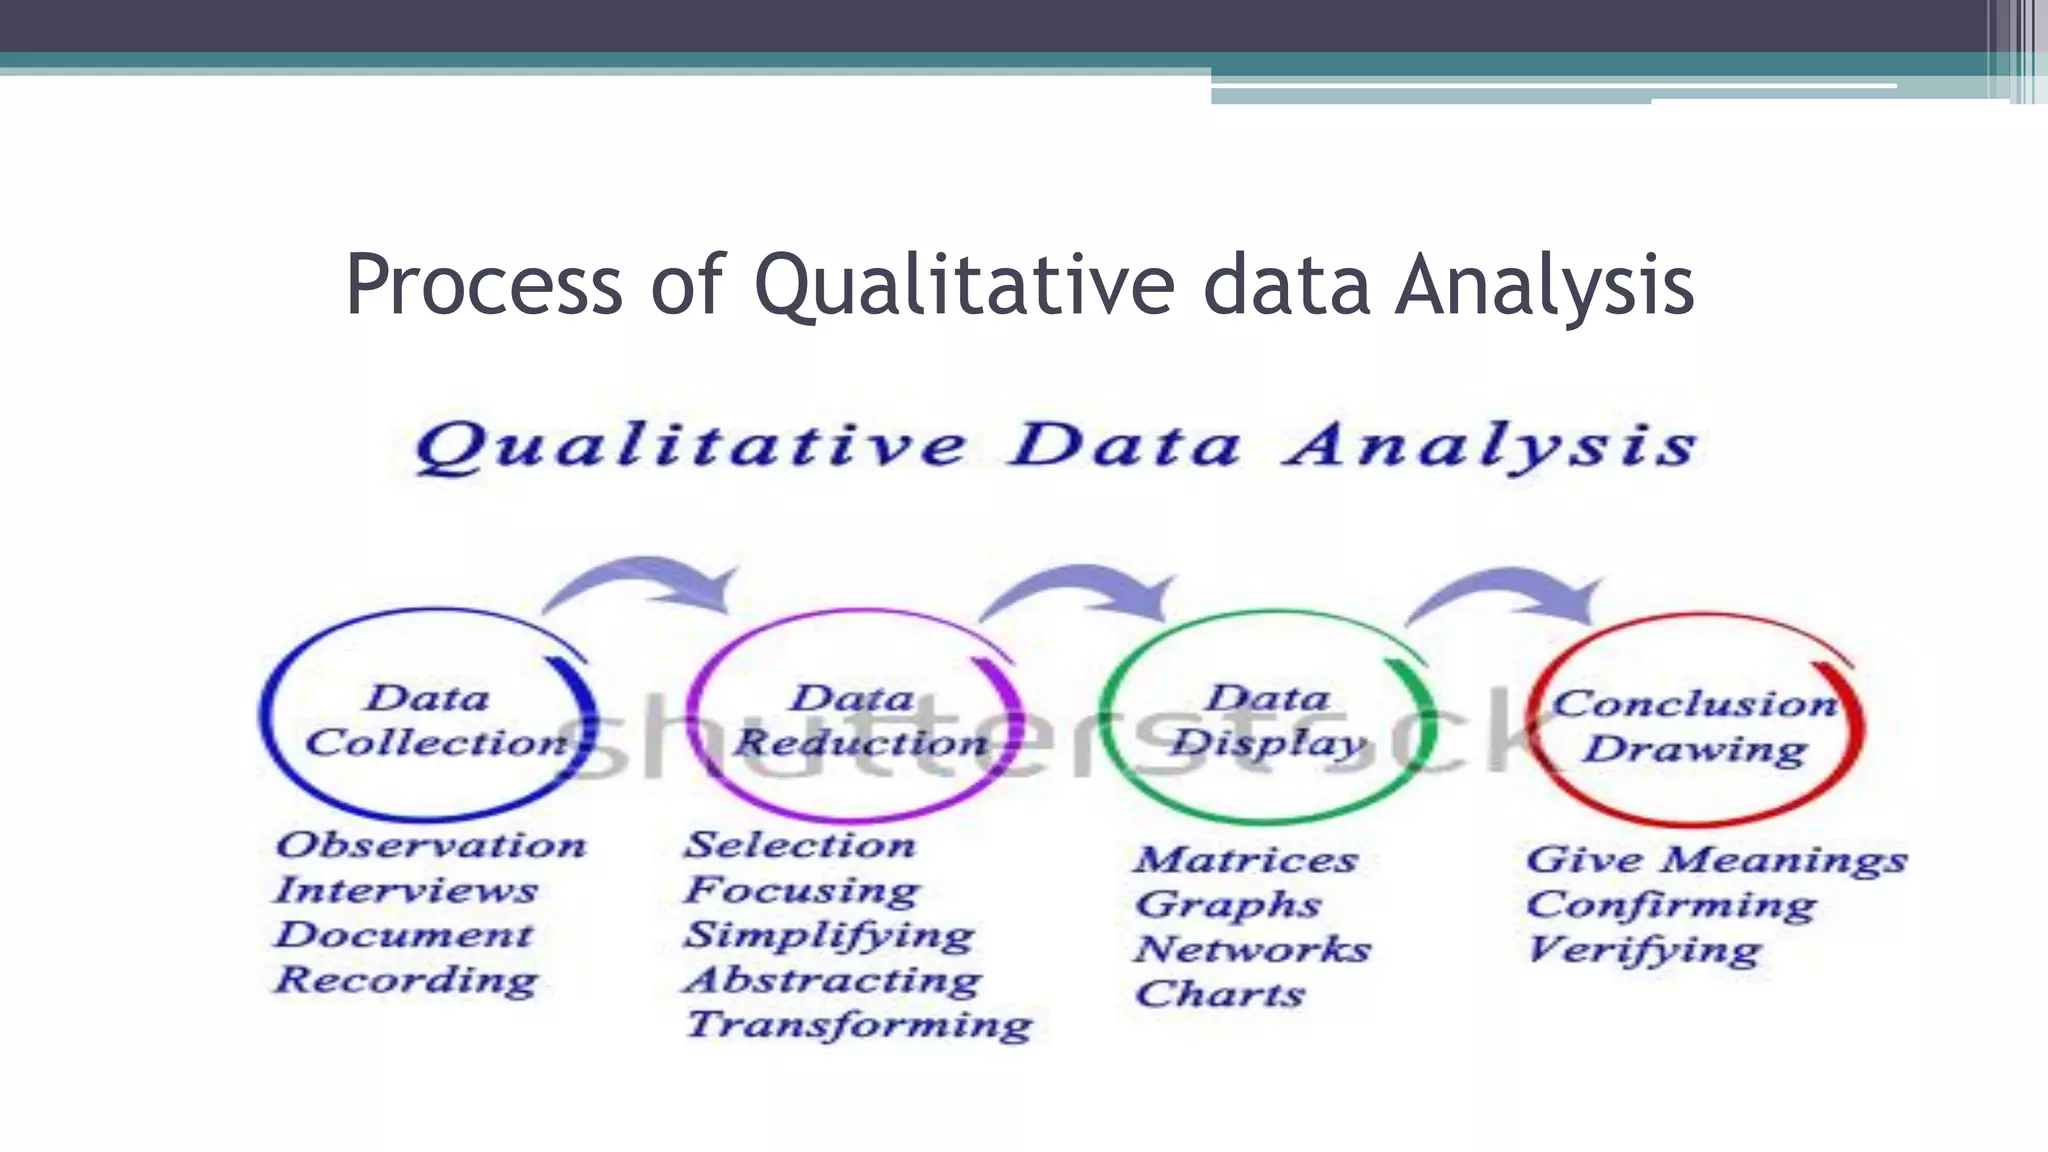
Qualitative Data Analysis
•Qualitative Data Analysis (QDA)
▫ Range of processes
▫ Procedures
▫ Move from the qualitative data
• QDA is usually based on an interpretative philosophy.
• The idea is
▫ To examine
The meaningful content
Symbolic content
(http://onlineqda.hud.ac.uk/Intro_QDA/what_is_qda.php 24)
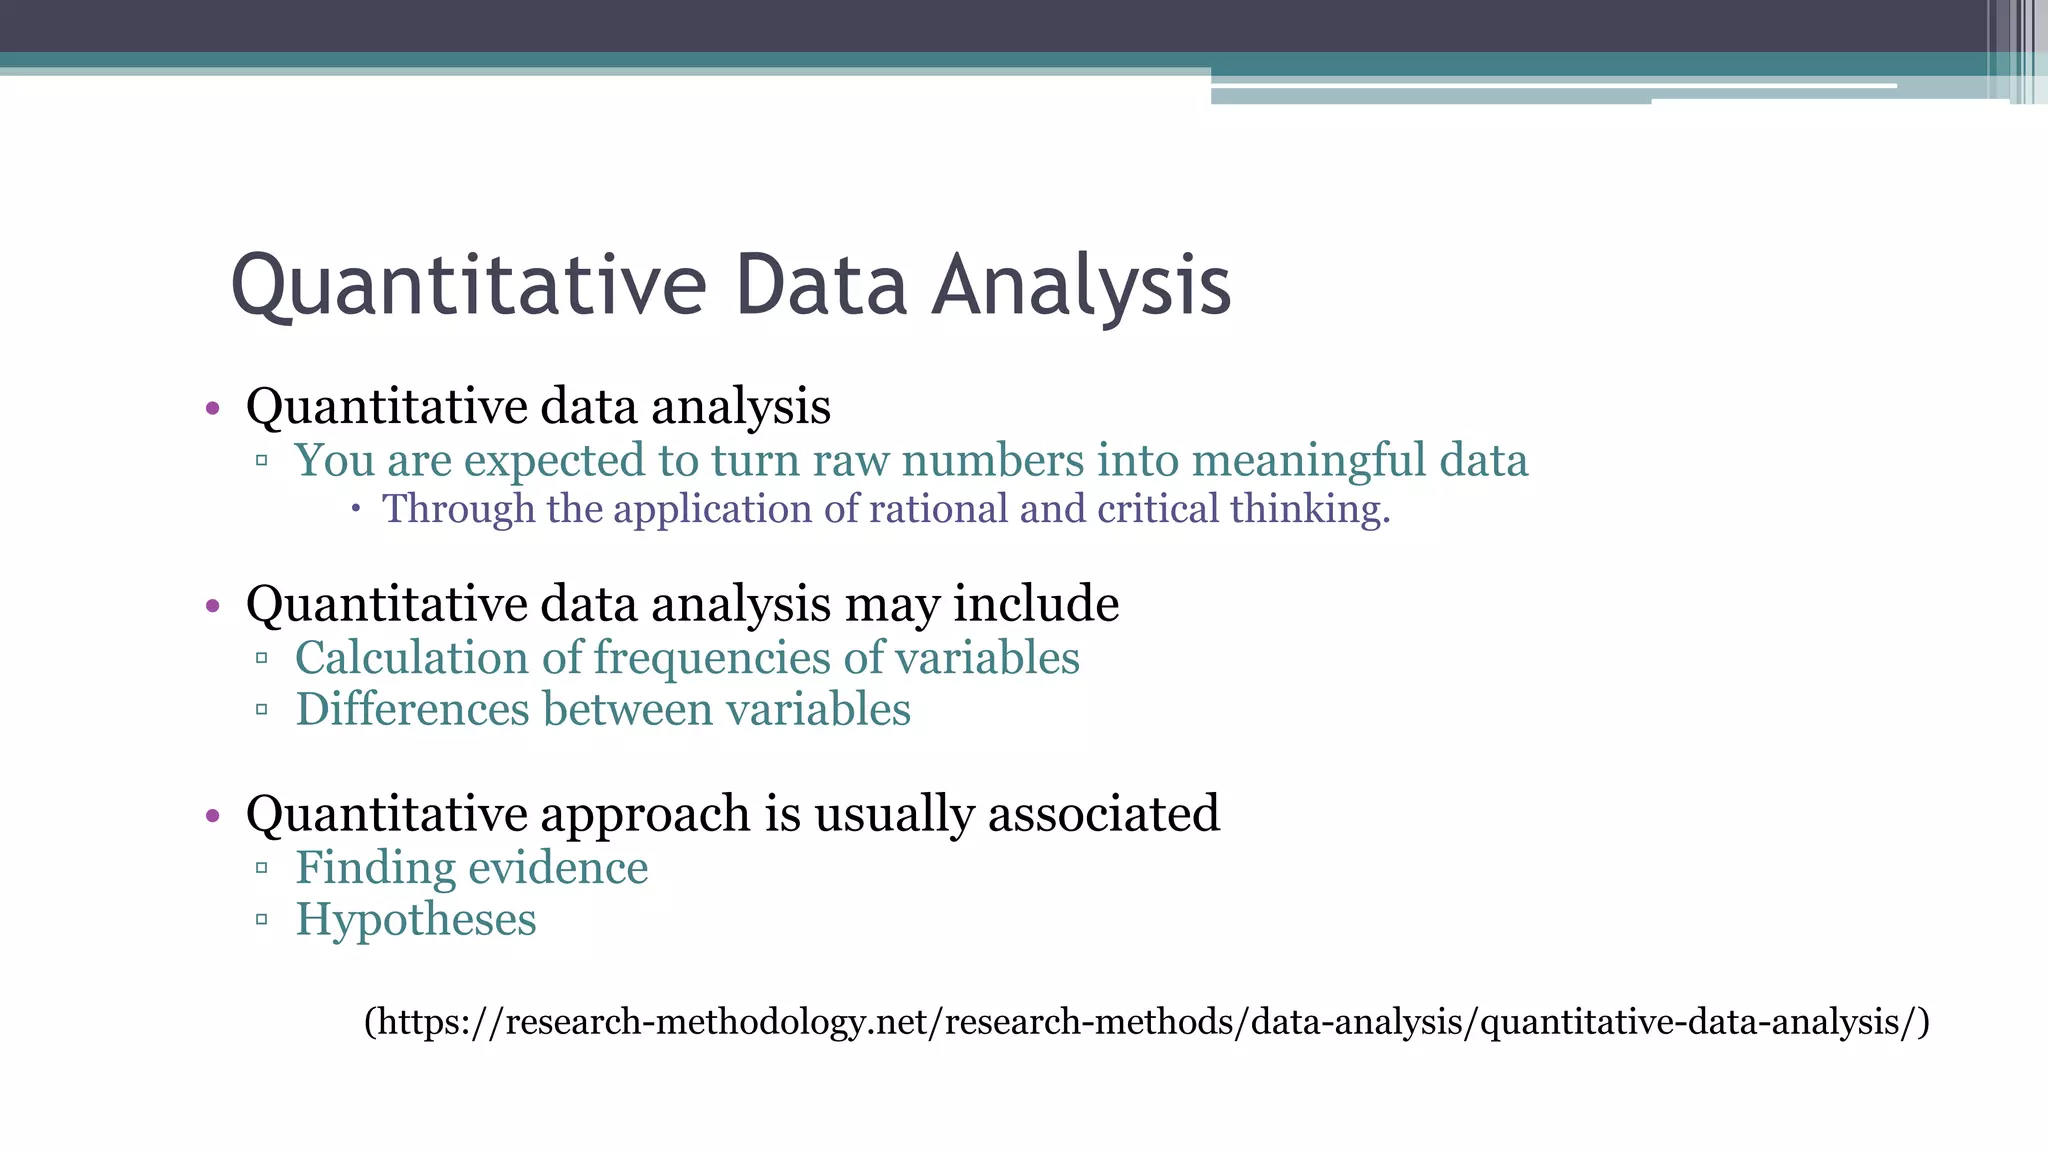
Quantitative Data Analysis
•Quantitative data analysis
▫ You are expected to turn raw numbers into meaningful data
Through the application of rational and critical thinking.
• Quantitative data analysis may include
▫ Calculation of frequencies of variables
▫ Differences between variables
• Quantitative approach is usually associated
▫ Finding evidence
▫ Hypotheses
(https://research-methodology.net/research-methods/data-analysis/quantitative-data-analysis/)
Statistical Methods usedfor Analysis
• Two main statistical methods are used in data analysis:
(i) Descriptive Statistics
(ii) Inferential Statistics
15.
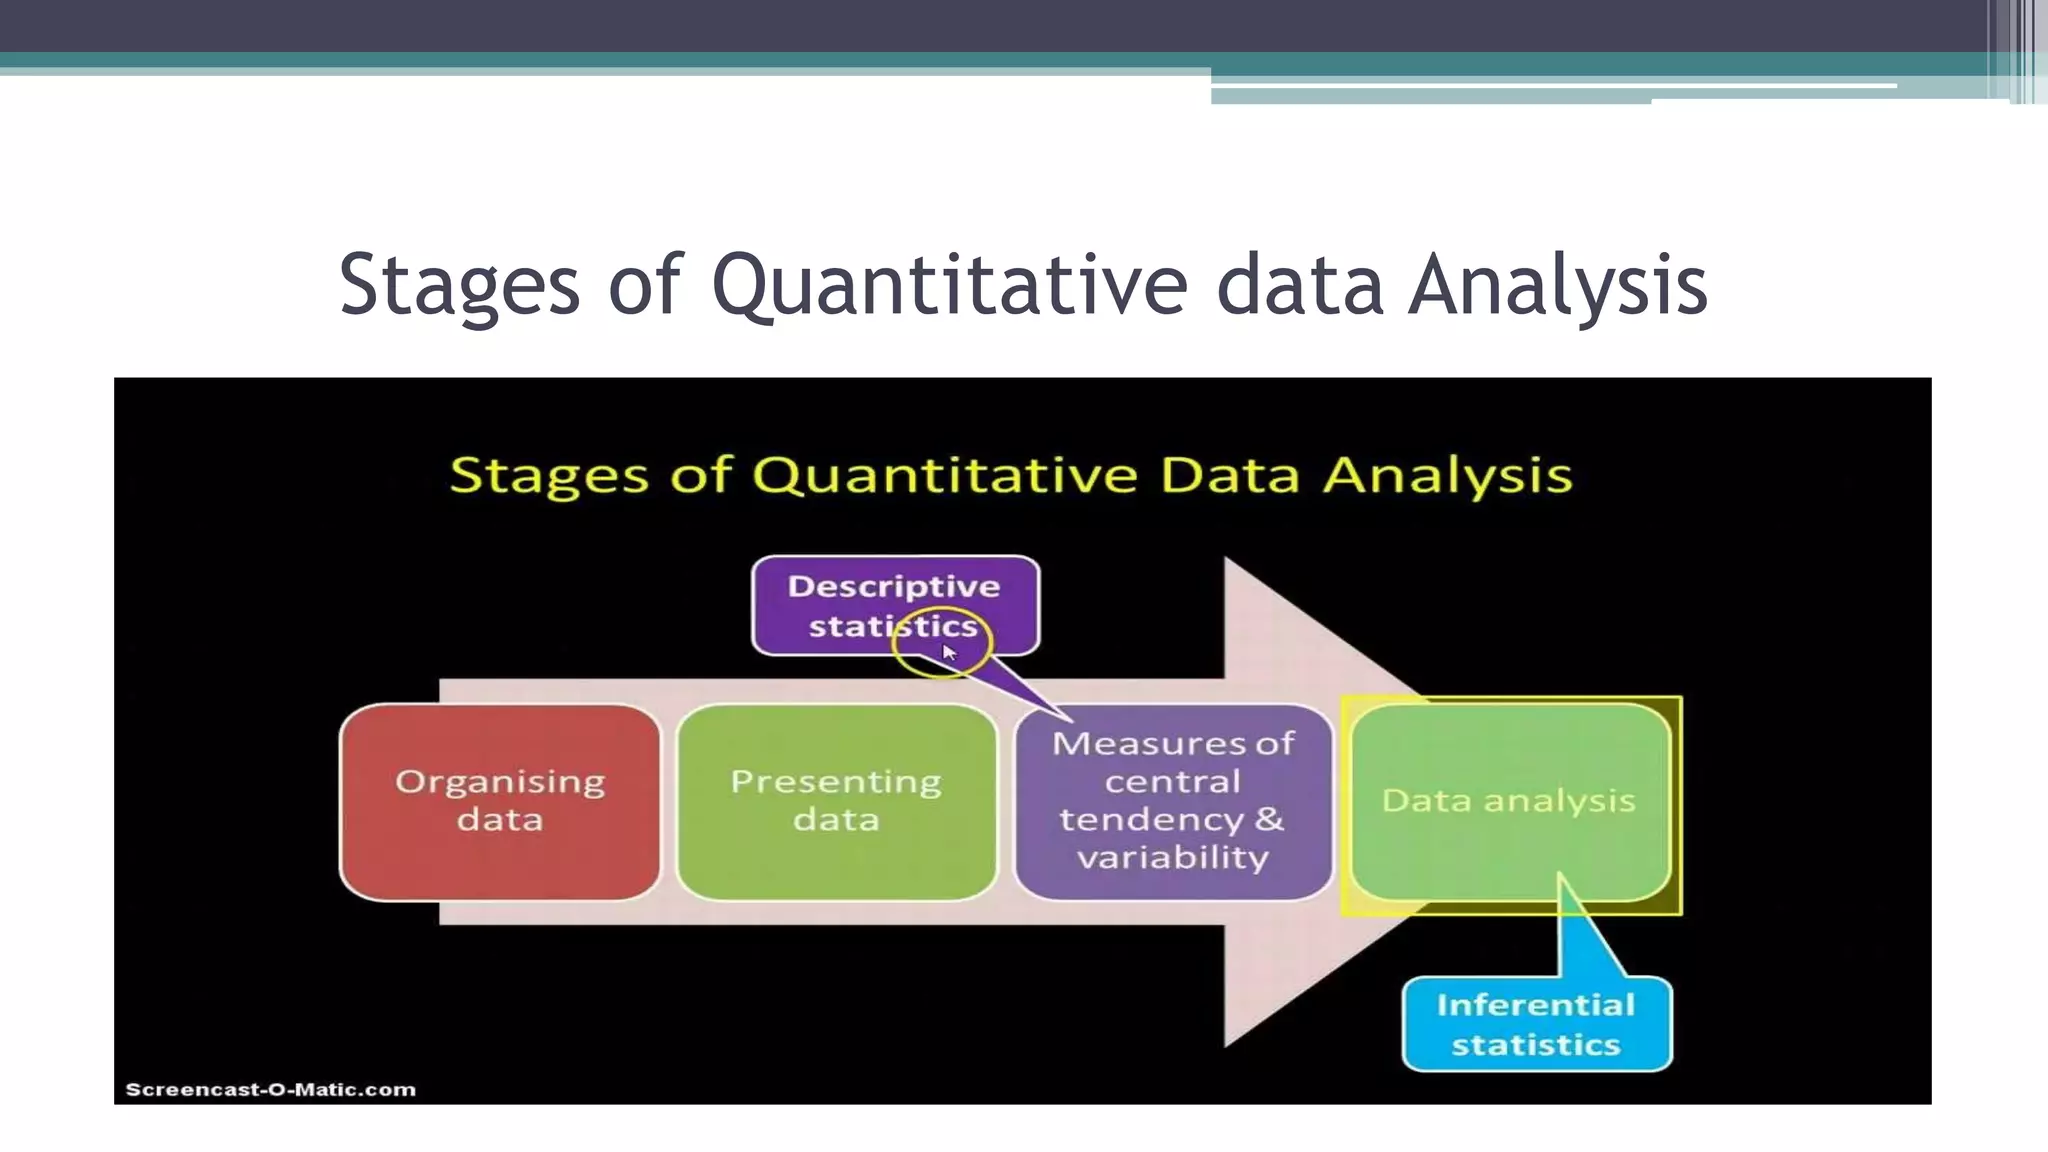
Descriptive Data Analysis
•Descriptive Statistics deal with
▫ Tabulation of data
▫ Their presentation in
Tabular
Graphical
Pictorial form
▫ Calculation of descriptive measures.
(Powell, R. at eil (2004). Basic research methods for librarians)
16.
Types of DescriptiveData Analysis
• The major types of descriptive statistics are
Frequencies
Measures of Central Tendency
Measures of Variability
Measures of Relative Position
Measures of Relationship
(Gay, L. R., at el. (2012). Educational Research)
17.
Step Involved
• PreparingData for Analysis
• Tabulation and Coding Procedure
• Summarizing the Data
(Gay, L. R., at el. (2012). Educational Research)
18.
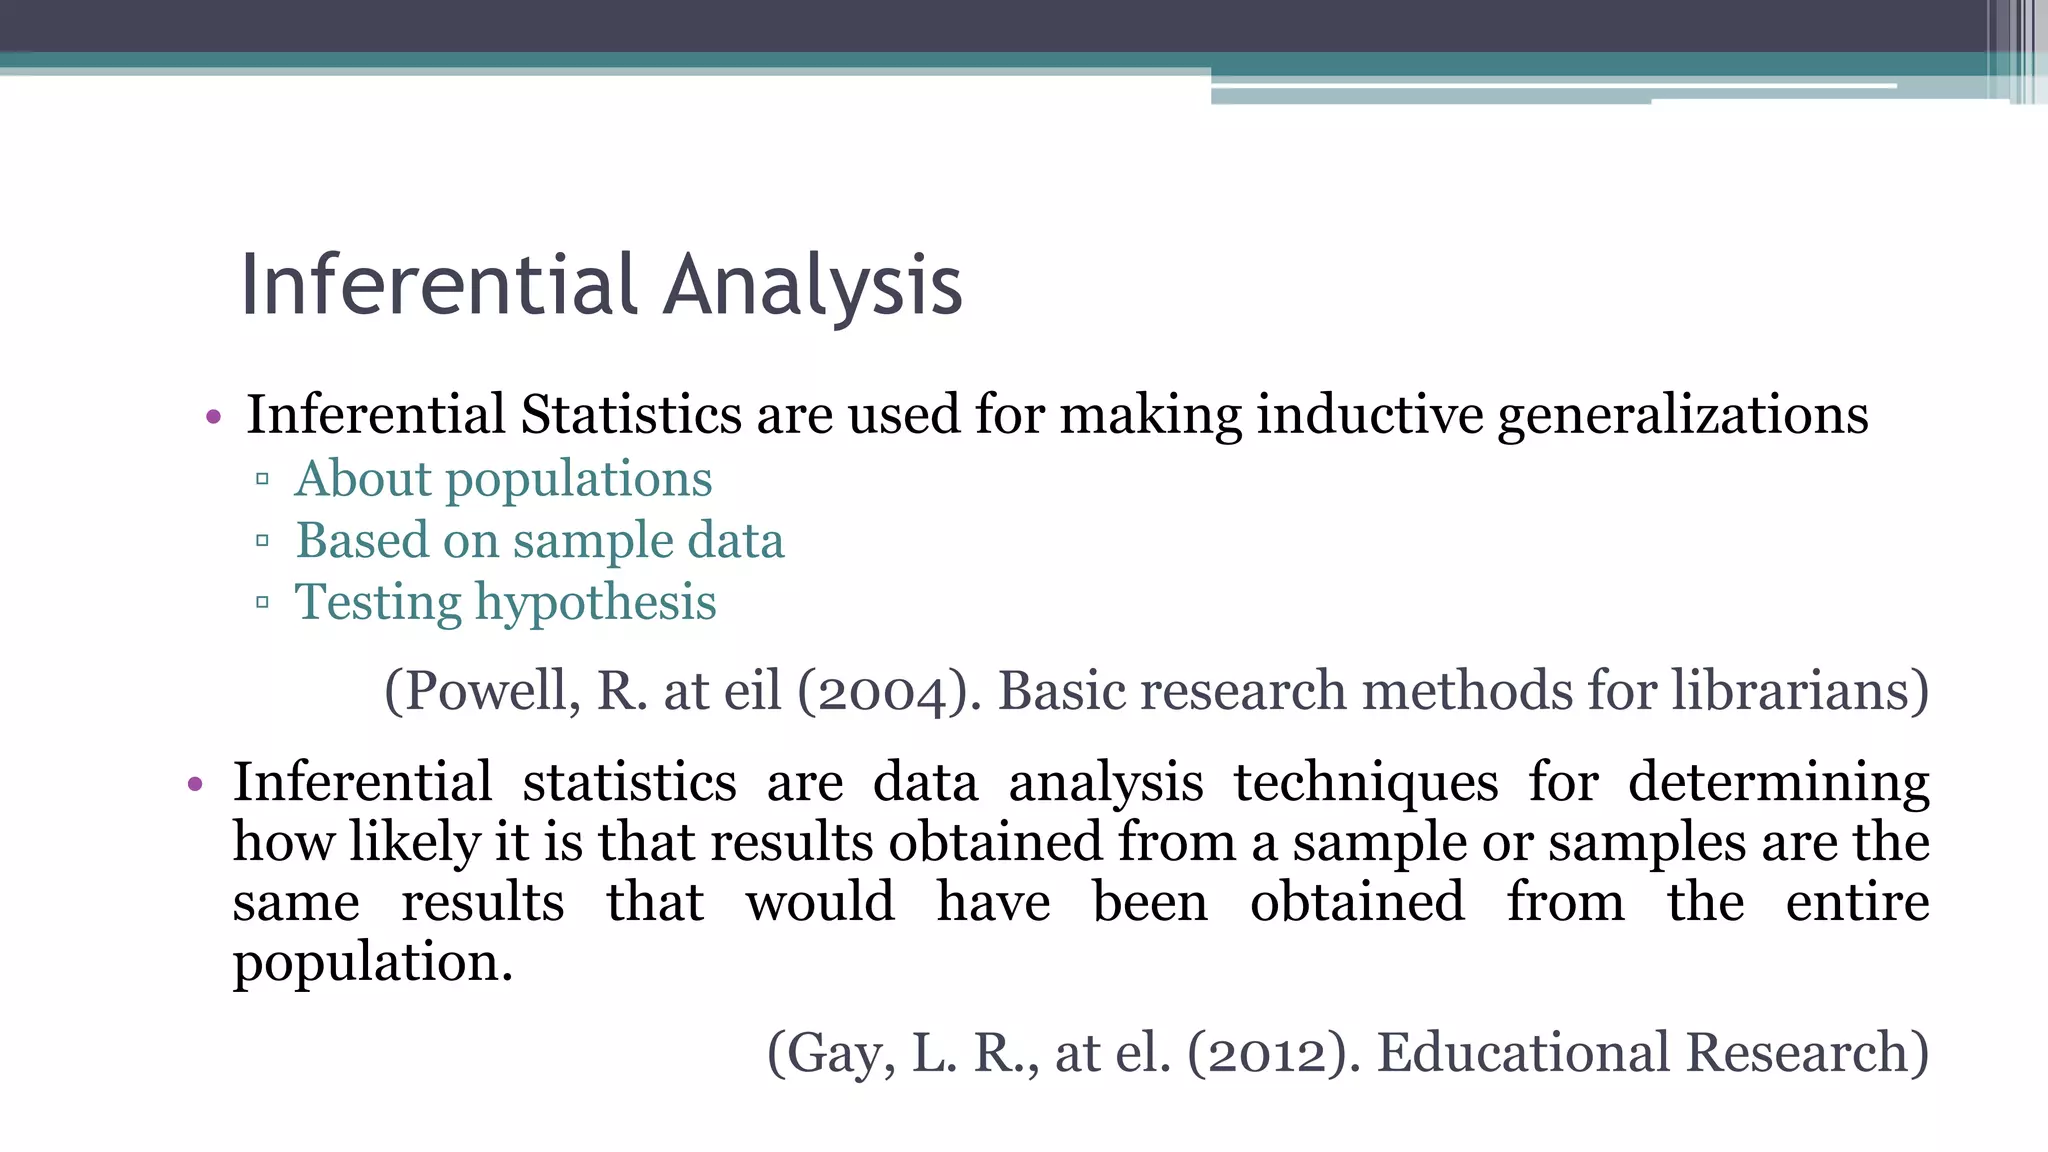
Inferential Analysis
• InferentialStatistics are used for making inductive generalizations
▫ About populations
▫ Based on sample data
▫ Testing hypothesis
(Powell, R. at eil (2004). Basic research methods for librarians)
• Inferential statistics are data analysis techniques for determining
how likely it is that results obtained from a sample or samples are the
same results that would have been obtained from the entire
population.
(Gay, L. R., at el. (2012). Educational Research)
19.
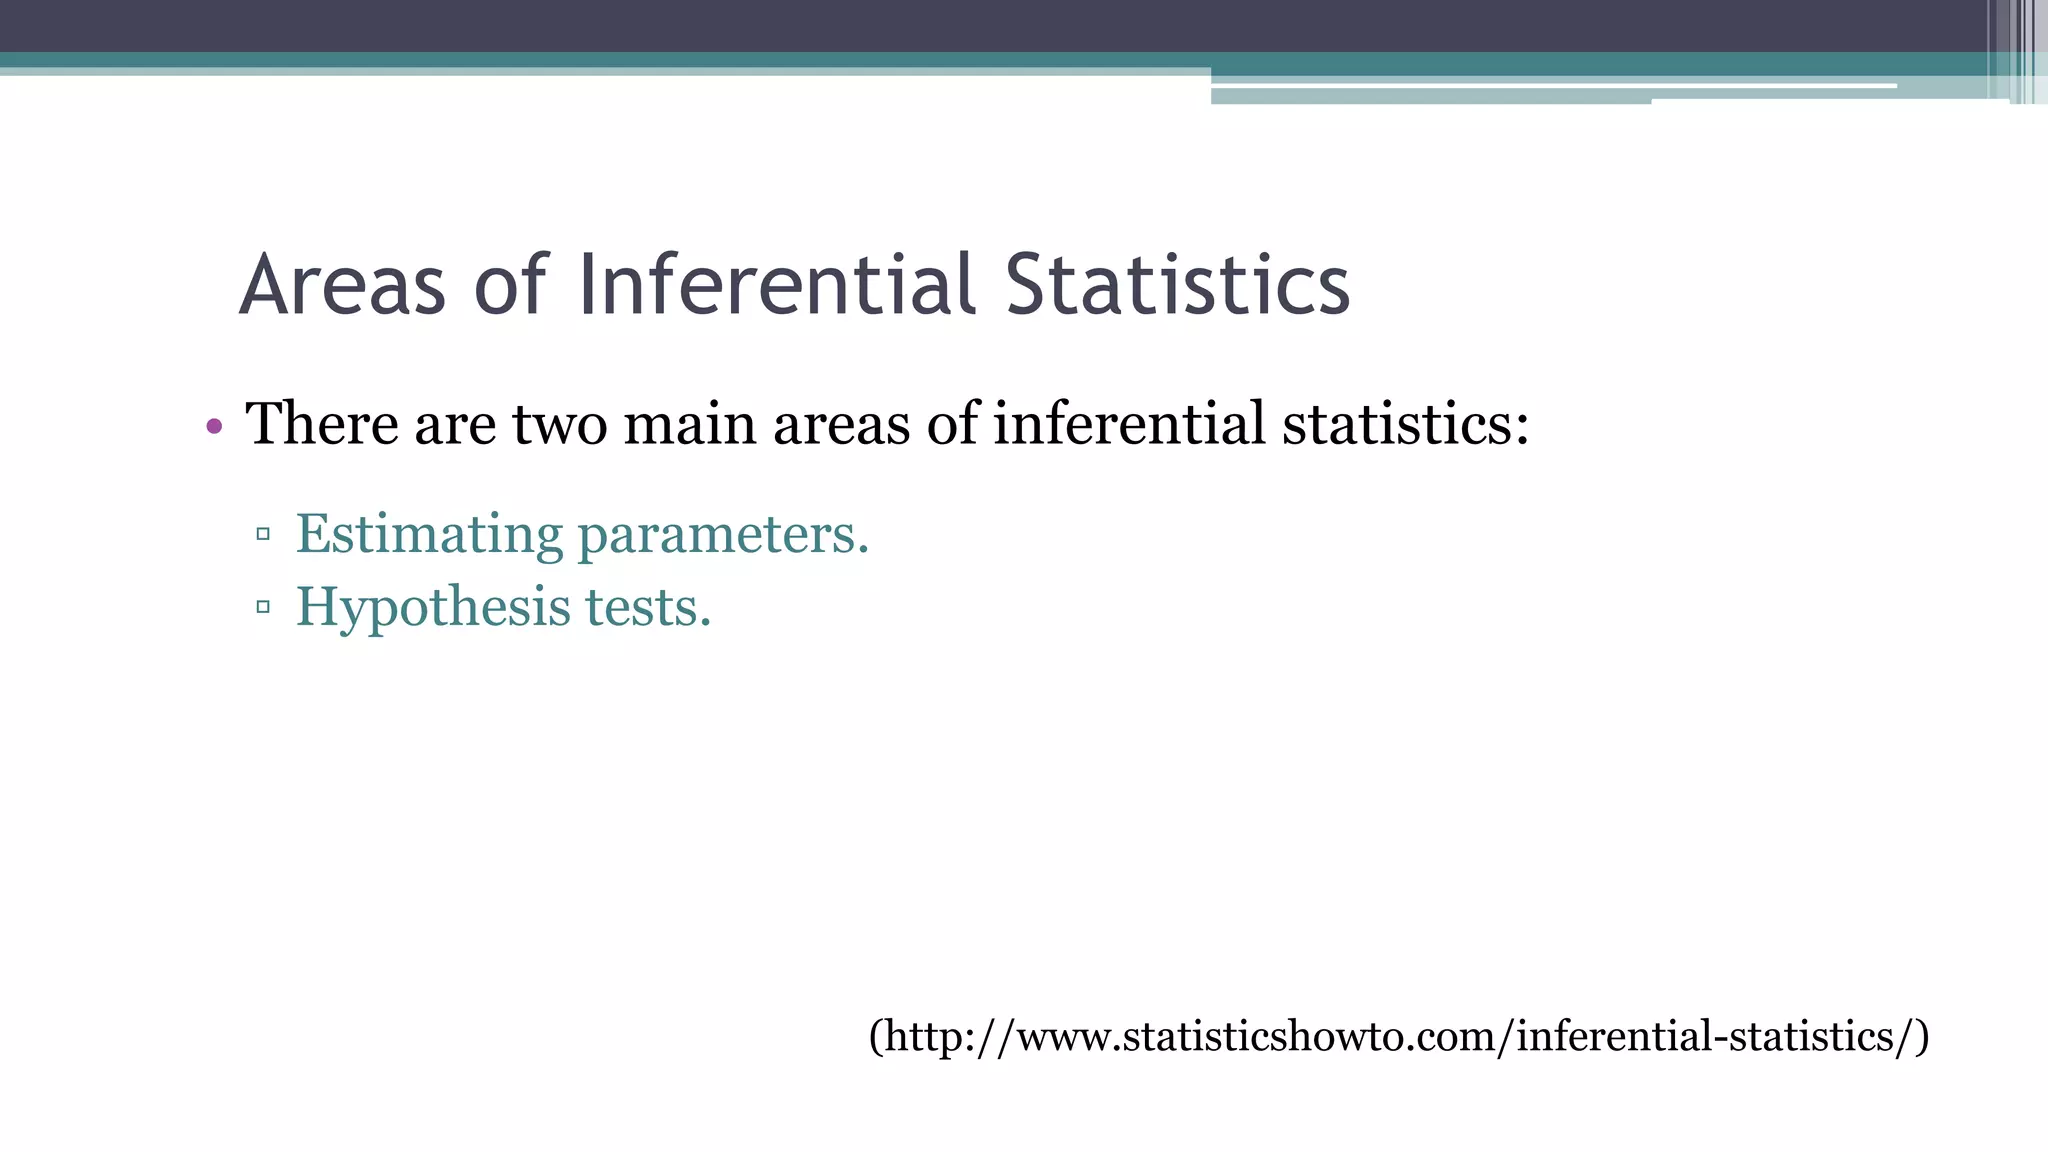
Areas of InferentialStatistics
• There are two main areas of inferential statistics:
▫ Estimating parameters.
▫ Hypothesis tests.
(http://www.statisticshowto.com/inferential-statistics/)
20.
Selecting Among Testsof Significance
• Parametric tests
• Nonparametric tests
(Gay, L. R., at el. (2012). Educational Research)
21.
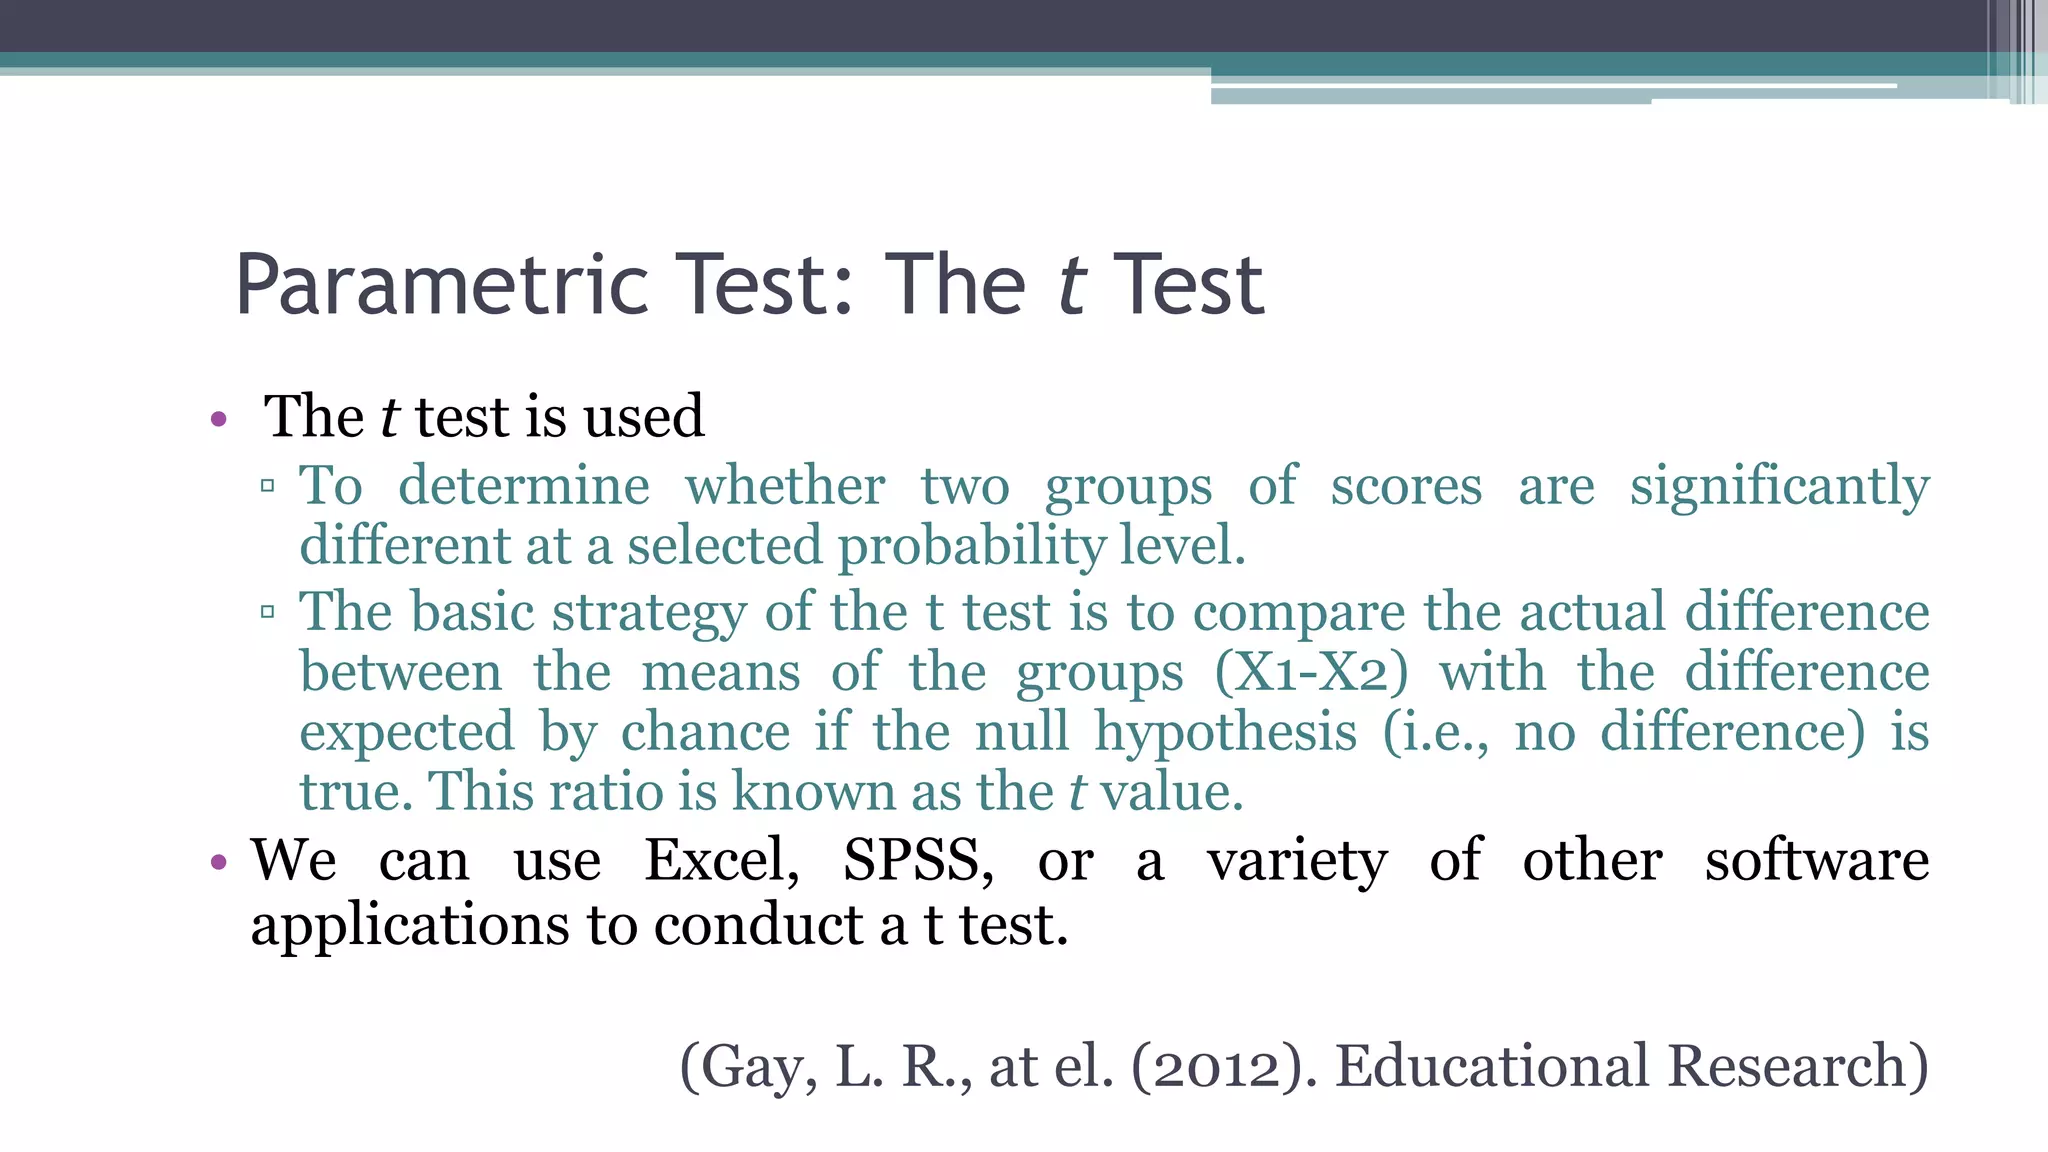
Parametric Test: Thet Test
• The t test is used
▫ To determine whether two groups of scores are significantly
different at a selected probability level.
▫ The basic strategy of the t test is to compare the actual difference
between the means of the groups (X1-X2) with the difference
expected by chance if the null hypothesis (i.e., no difference) is
true. This ratio is known as the t value.
• We can use Excel, SPSS, or a variety of other software
applications to conduct a t test.
(Gay, L. R., at el. (2012). Educational Research)
22.
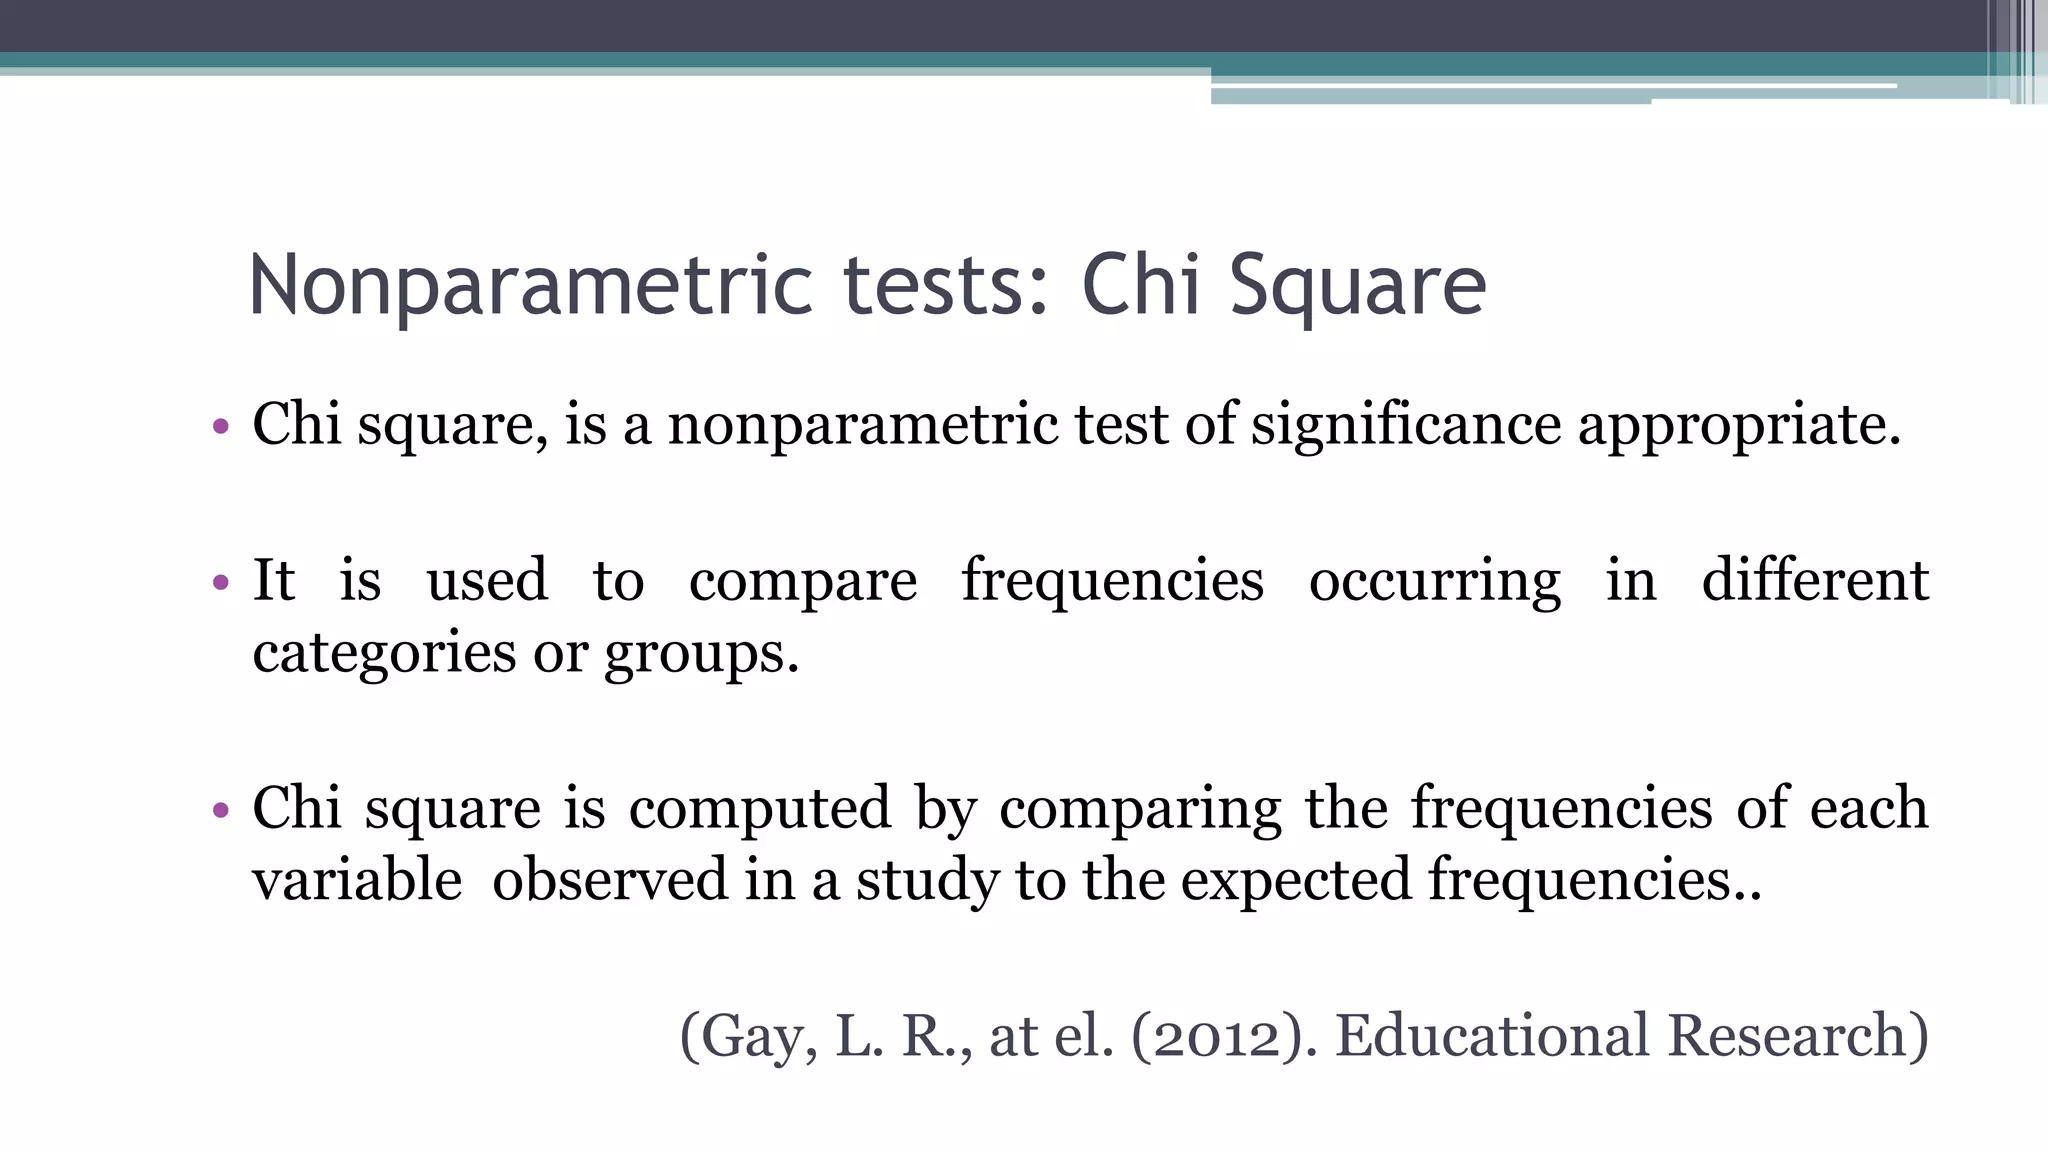
Nonparametric tests: ChiSquare
• Chi square, is a nonparametric test of significance appropriate.
• It is used to compare frequencies occurring in different
categories or groups.
• Chi square is computed by comparing the frequencies of each
variable observed in a study to the expected frequencies..
(Gay, L. R., at el. (2012). Educational Research)
23.
Other Investigative Techniques
•Data Mining
• Factor Analysis
• Structural Equation Modeling
(Gay, L. R., at el. (2012). Educational Research)
24.
Conclusion
• The Analysissection tells the reader what occurred during the
experiment by explaining the graph and data table etc.
• A data analysis report summarizes the results of an experiment
based on the purpose of the study
25.
References
• Gay, L.R., at el. (2012). Educational Research
• Powell, R. at eil (2004). Basic research methods for librarians
• http://onlineqda.hud.ac.uk/Intro_QDA/what_is_qda.php 24
• https://research-methodology.net/research-methods/data-analysis/quantitative-data-
analysis/
• http://www.statisticshowto.com/inferential-statistics/


![[DSC Europe 25] Kaja Kandare - LLM as a judge.pptx](https://cdn.slidesharecdn.com/ss_thumbnails/arxyccaxsdsd1ba99wjw-7-251212104007-2b4e3f64-thumbnail.jpg?width=640&height=640&fit=bounds)
![[DSC Europe 25] Jovan Bogicevic - Legacy to AI-Driven Defense: Transforming D...](https://cdn.slidesharecdn.com/ss_thumbnails/rsarluadt563hntyfc8q-3-251211083849-3e7bc4c0-thumbnail.jpg?width=640&height=640&fit=bounds)
![[DSC Europe 25] Dusan Nesic - Securing Tomorrow’s Infrastructure: Why Cyber-P...](https://cdn.slidesharecdn.com/ss_thumbnails/qikbszfftyowjm2q6duw-1-251211083848-8f2ead6b-thumbnail.jpg?width=640&height=640&fit=bounds)


![[DSC Europe 25] Vid Stimac - Policy Parsimony: Between Oversimplifying and Ov...](https://cdn.slidesharecdn.com/ss_thumbnails/eqlepagzqp2rhg3gbluh-dsc-stimac-251120-251205090438-059e7f54-thumbnail.jpg?width=640&height=640&fit=bounds)

![[DSC Europe 25] Andy Cotgreave - Nothing is new in analytics.pptx](https://cdn.slidesharecdn.com/ss_thumbnails/mba4vzcurvoh5lfrd5zw-6-251205194645-341bbbbe-thumbnail.jpg?width=640&height=640&fit=bounds)

![[DSC Europe 25] Marija Vlajkovic & Andrea Radonjanin - Integration of AI tool...](https://cdn.slidesharecdn.com/ss_thumbnails/qf1jrglttoc3bm8s3aop-final-integration-of-ai-tools-251208151905-394f3a6a-thumbnail.jpg?width=640&height=640&fit=bounds)
![[DSC Europe 25] Vladimir Jelic - The AI-Driven Security Shift From Reactive D...](https://cdn.slidesharecdn.com/ss_thumbnails/6g5gj25mtjwayniqem1t-6-251209104645-7a5a5fc6-thumbnail.jpg?width=640&height=640&fit=bounds)

![[DSC Europe 25] Dobrica Cosic - Savings by the Second: How Dynamic Pricing an...](https://cdn.slidesharecdn.com/ss_thumbnails/znp09f3smtqz3w2sq6wn-1-dobrica-cosic-savings-by-the-second-how-dynamic-pricing-and-smart-data-are-bu-251208151905-26e6f41e-thumbnail.jpg?width=640&height=640&fit=bounds)
![[DSC Europe 25] Bogdan Daniel Maruneac - AI - It starts with you.pptx](https://cdn.slidesharecdn.com/ss_thumbnails/odov3snhrcqs9hx5ny2n-4-251205085715-f1daacfe-thumbnail.jpg?width=640&height=640&fit=bounds)

![[DSC Europe 25] Dusan Jovicic - AI Story: From on-prem to cloud and back agai...](https://cdn.slidesharecdn.com/ss_thumbnails/8kp49m6uq22ifnbwhfnk-2-251205085715-964d11a6-thumbnail.jpg?width=640&height=640&fit=bounds)
![[DSC Europe 25] Nikola Rajovic - Hardware Technologies Under the Hood: RISC-V...](https://cdn.slidesharecdn.com/ss_thumbnails/o2gptrmtoyqndgoshwgq-dsc2025-tenstorrent-rajovic-251205090438-814685f5-thumbnail.jpg?width=640&height=640&fit=bounds)
