Downloaded 707 times


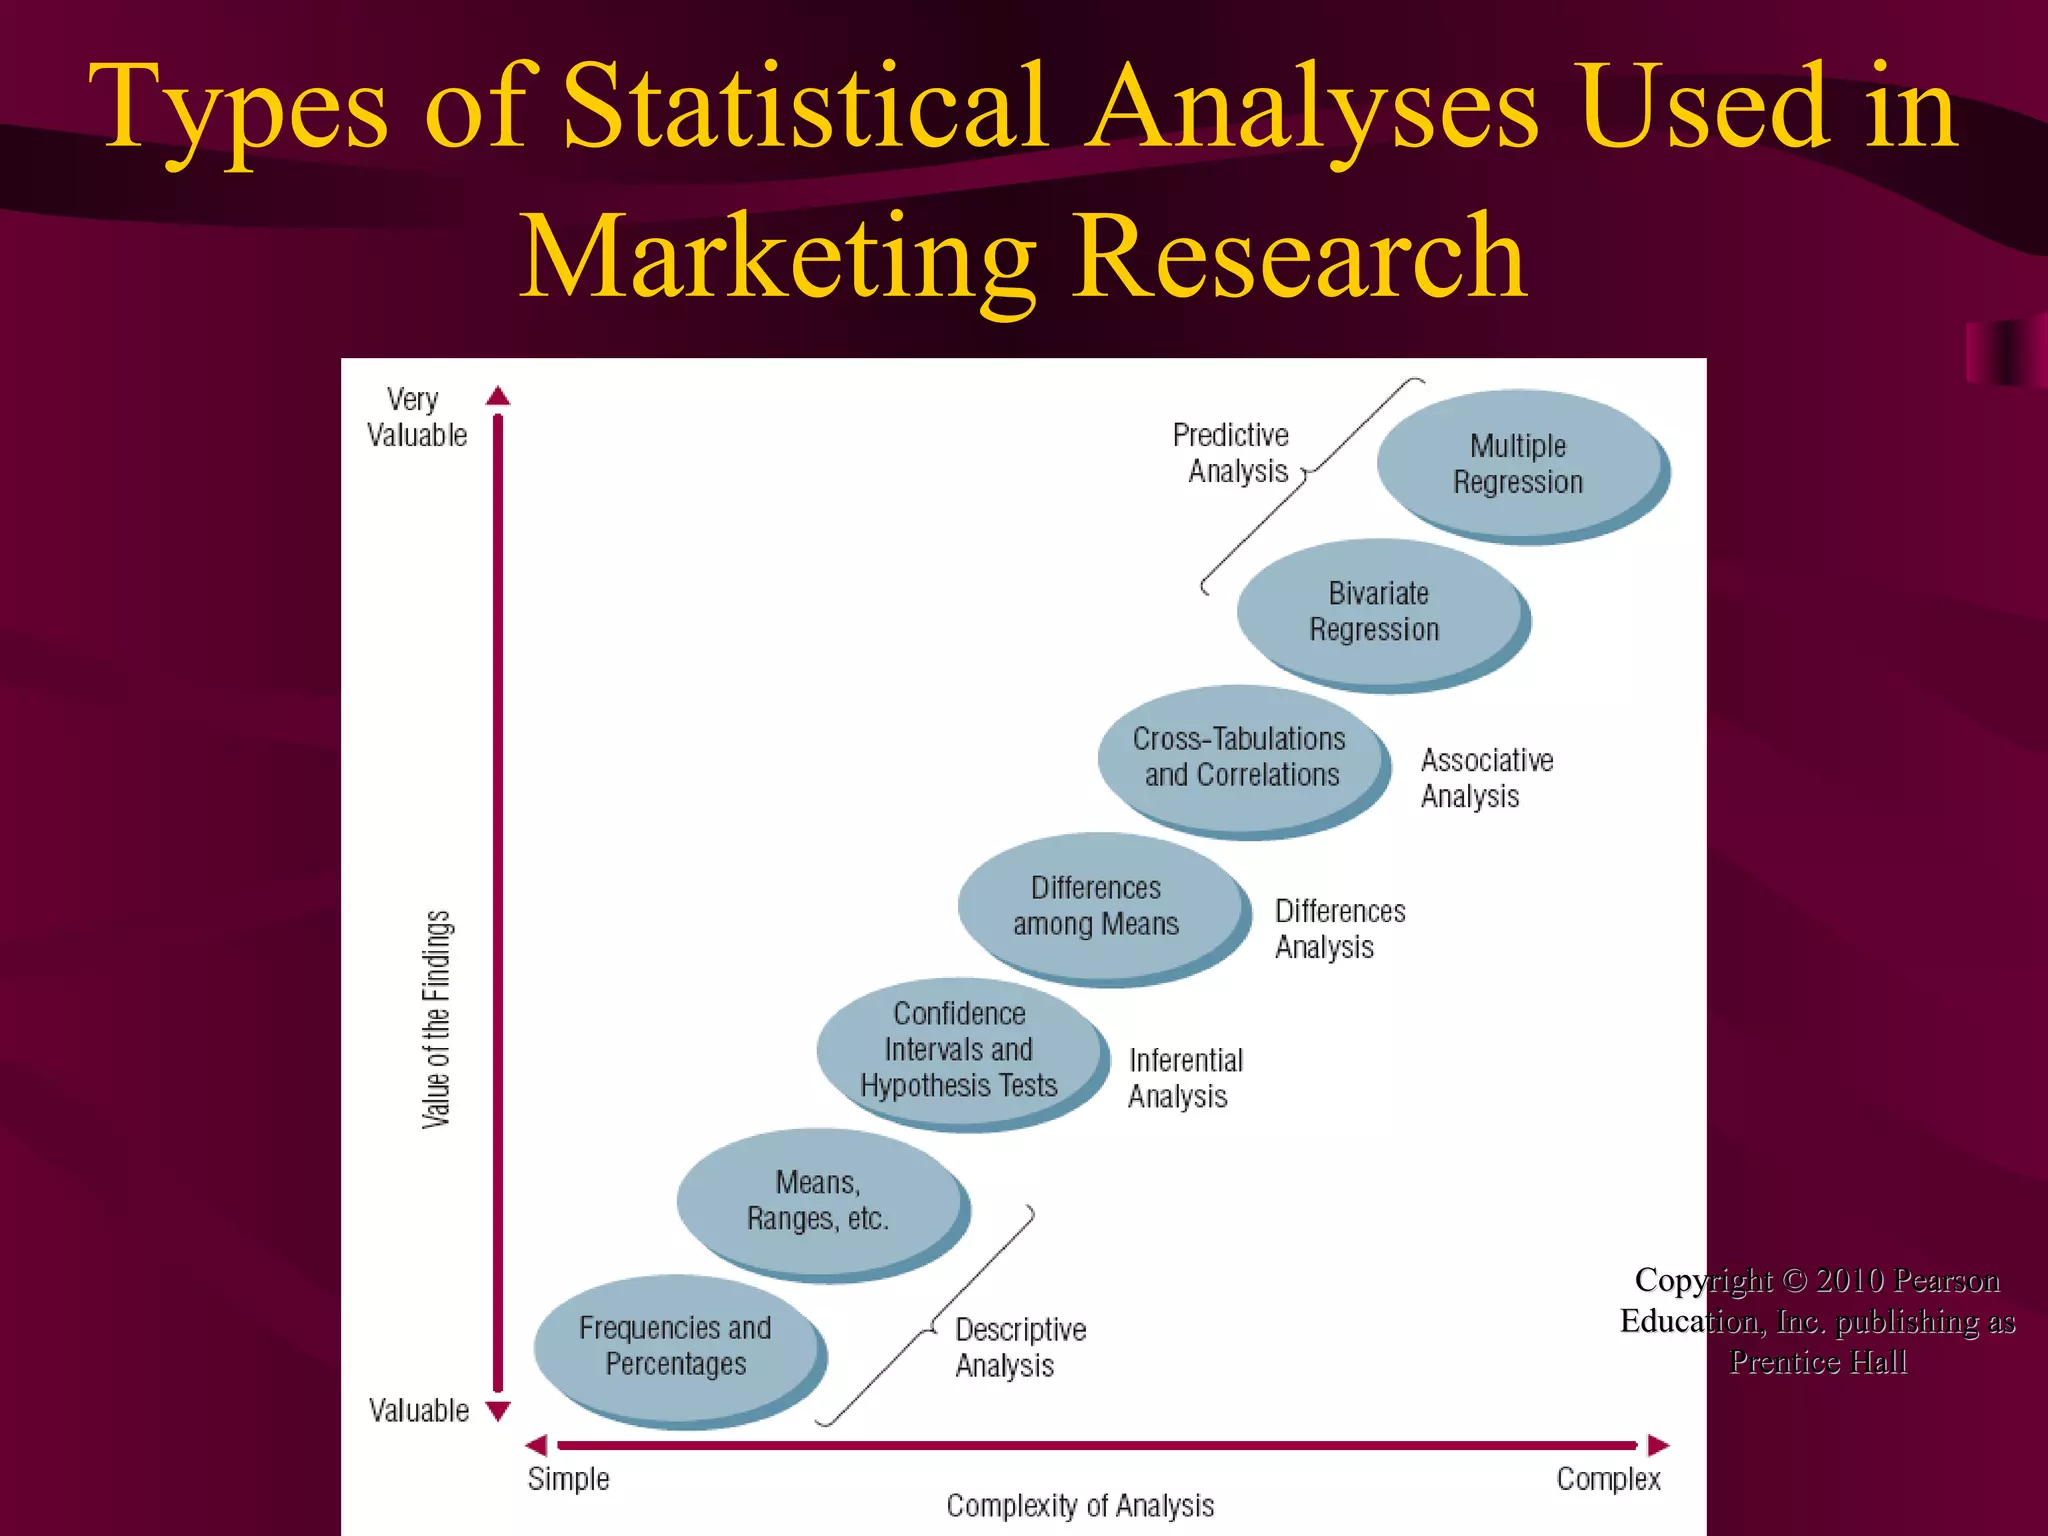
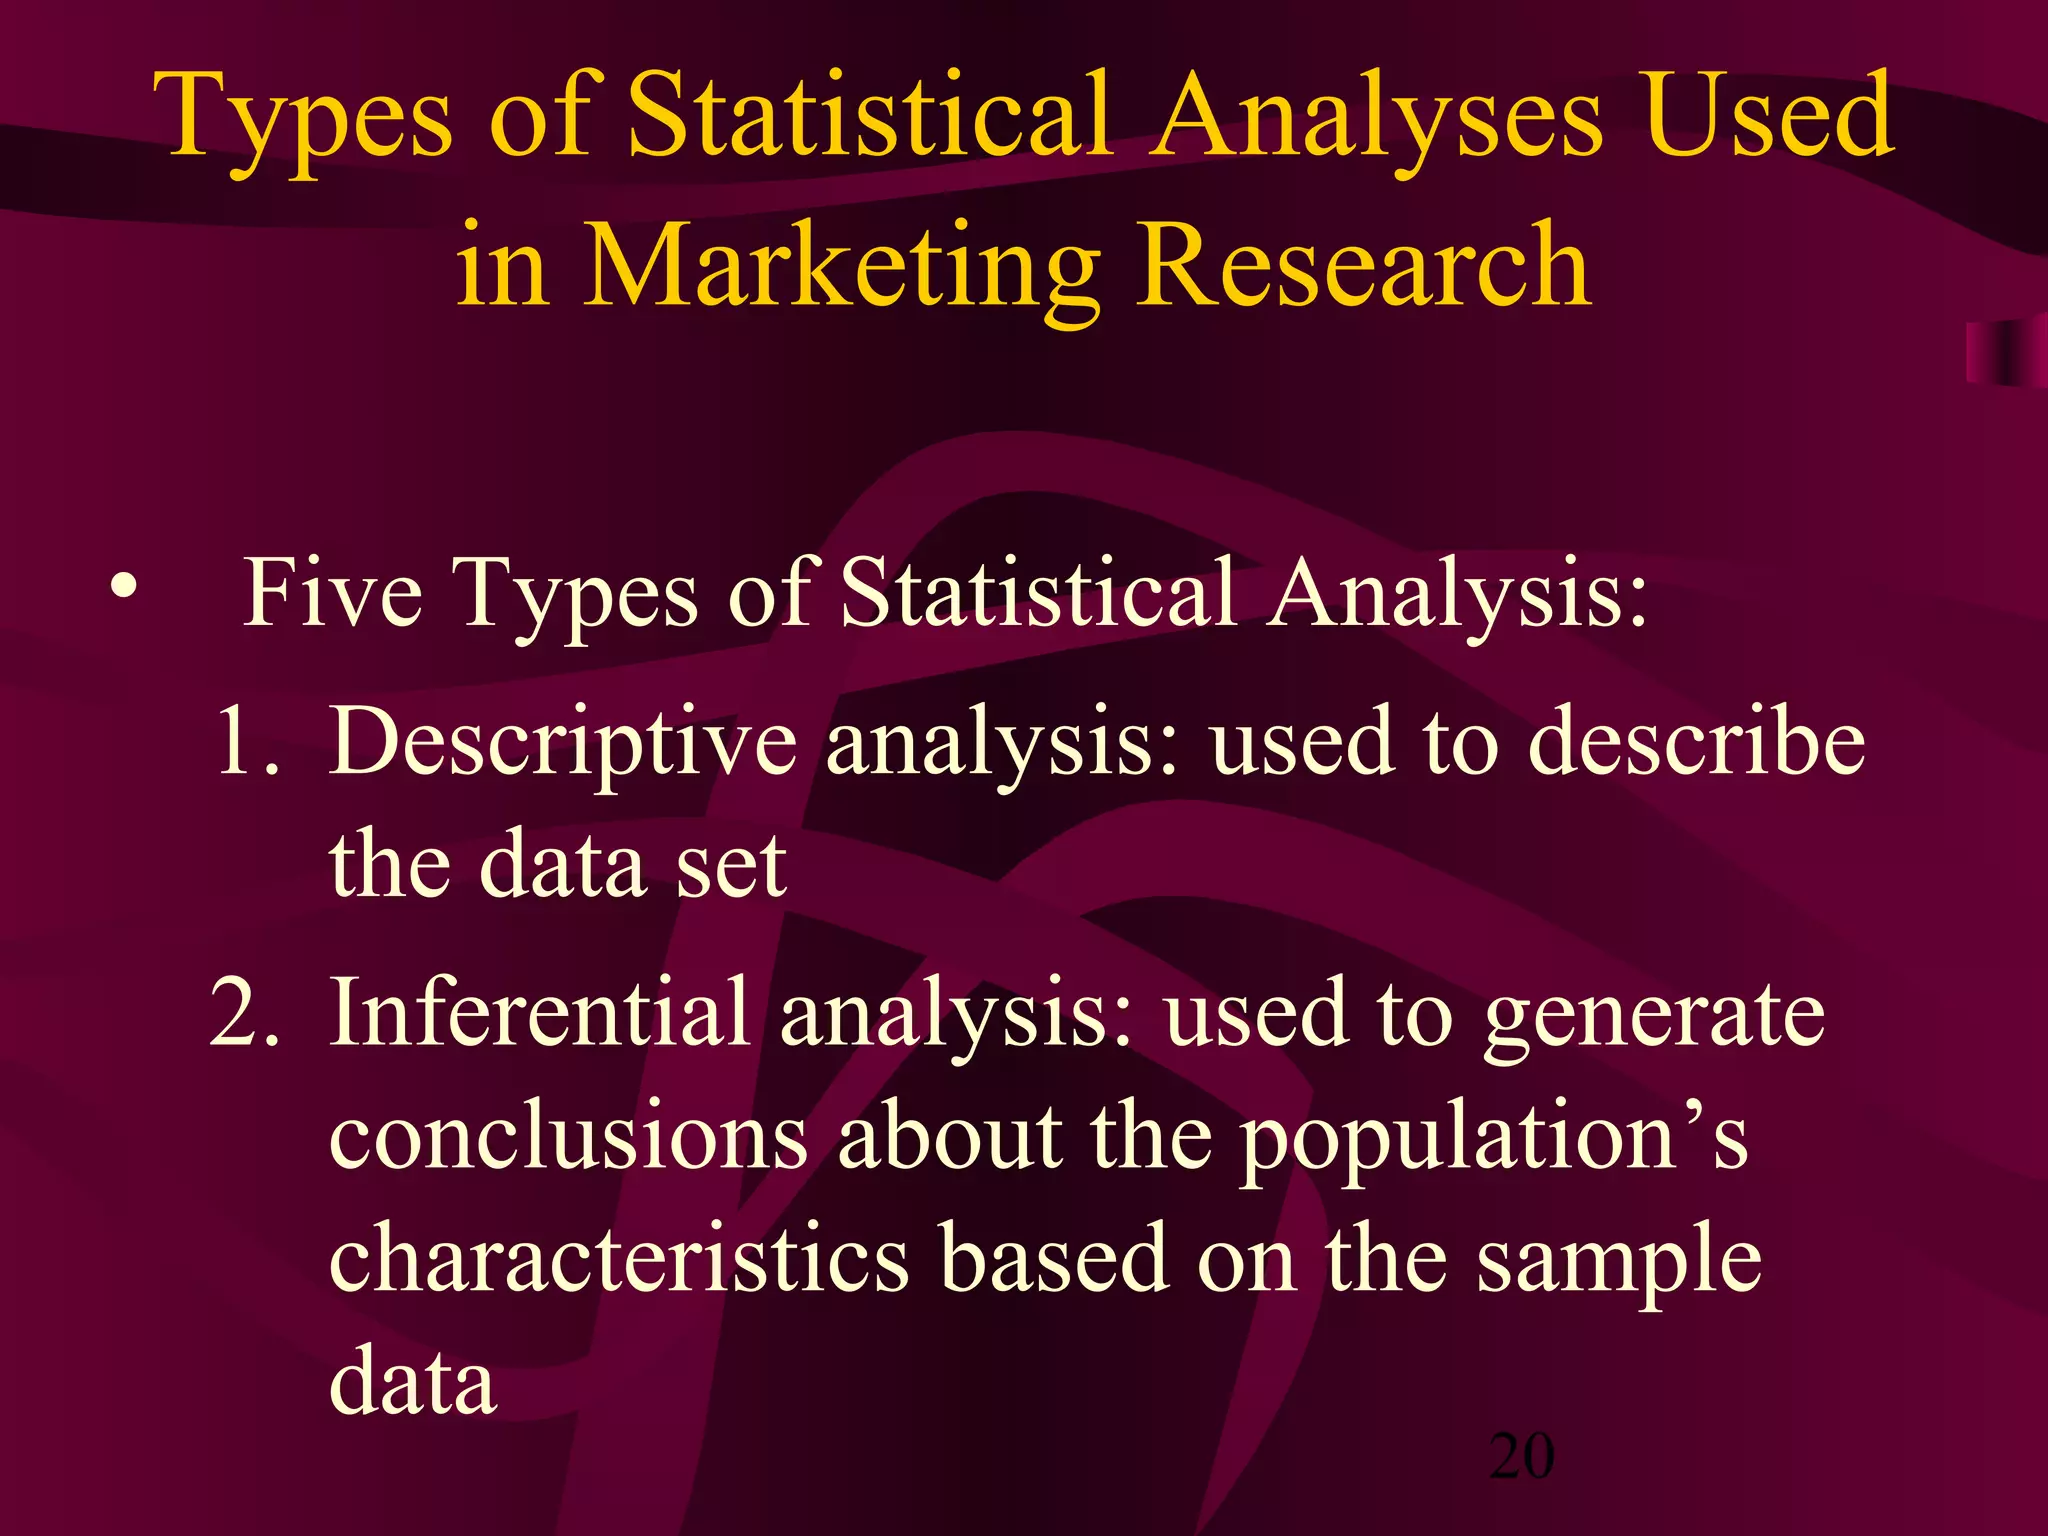
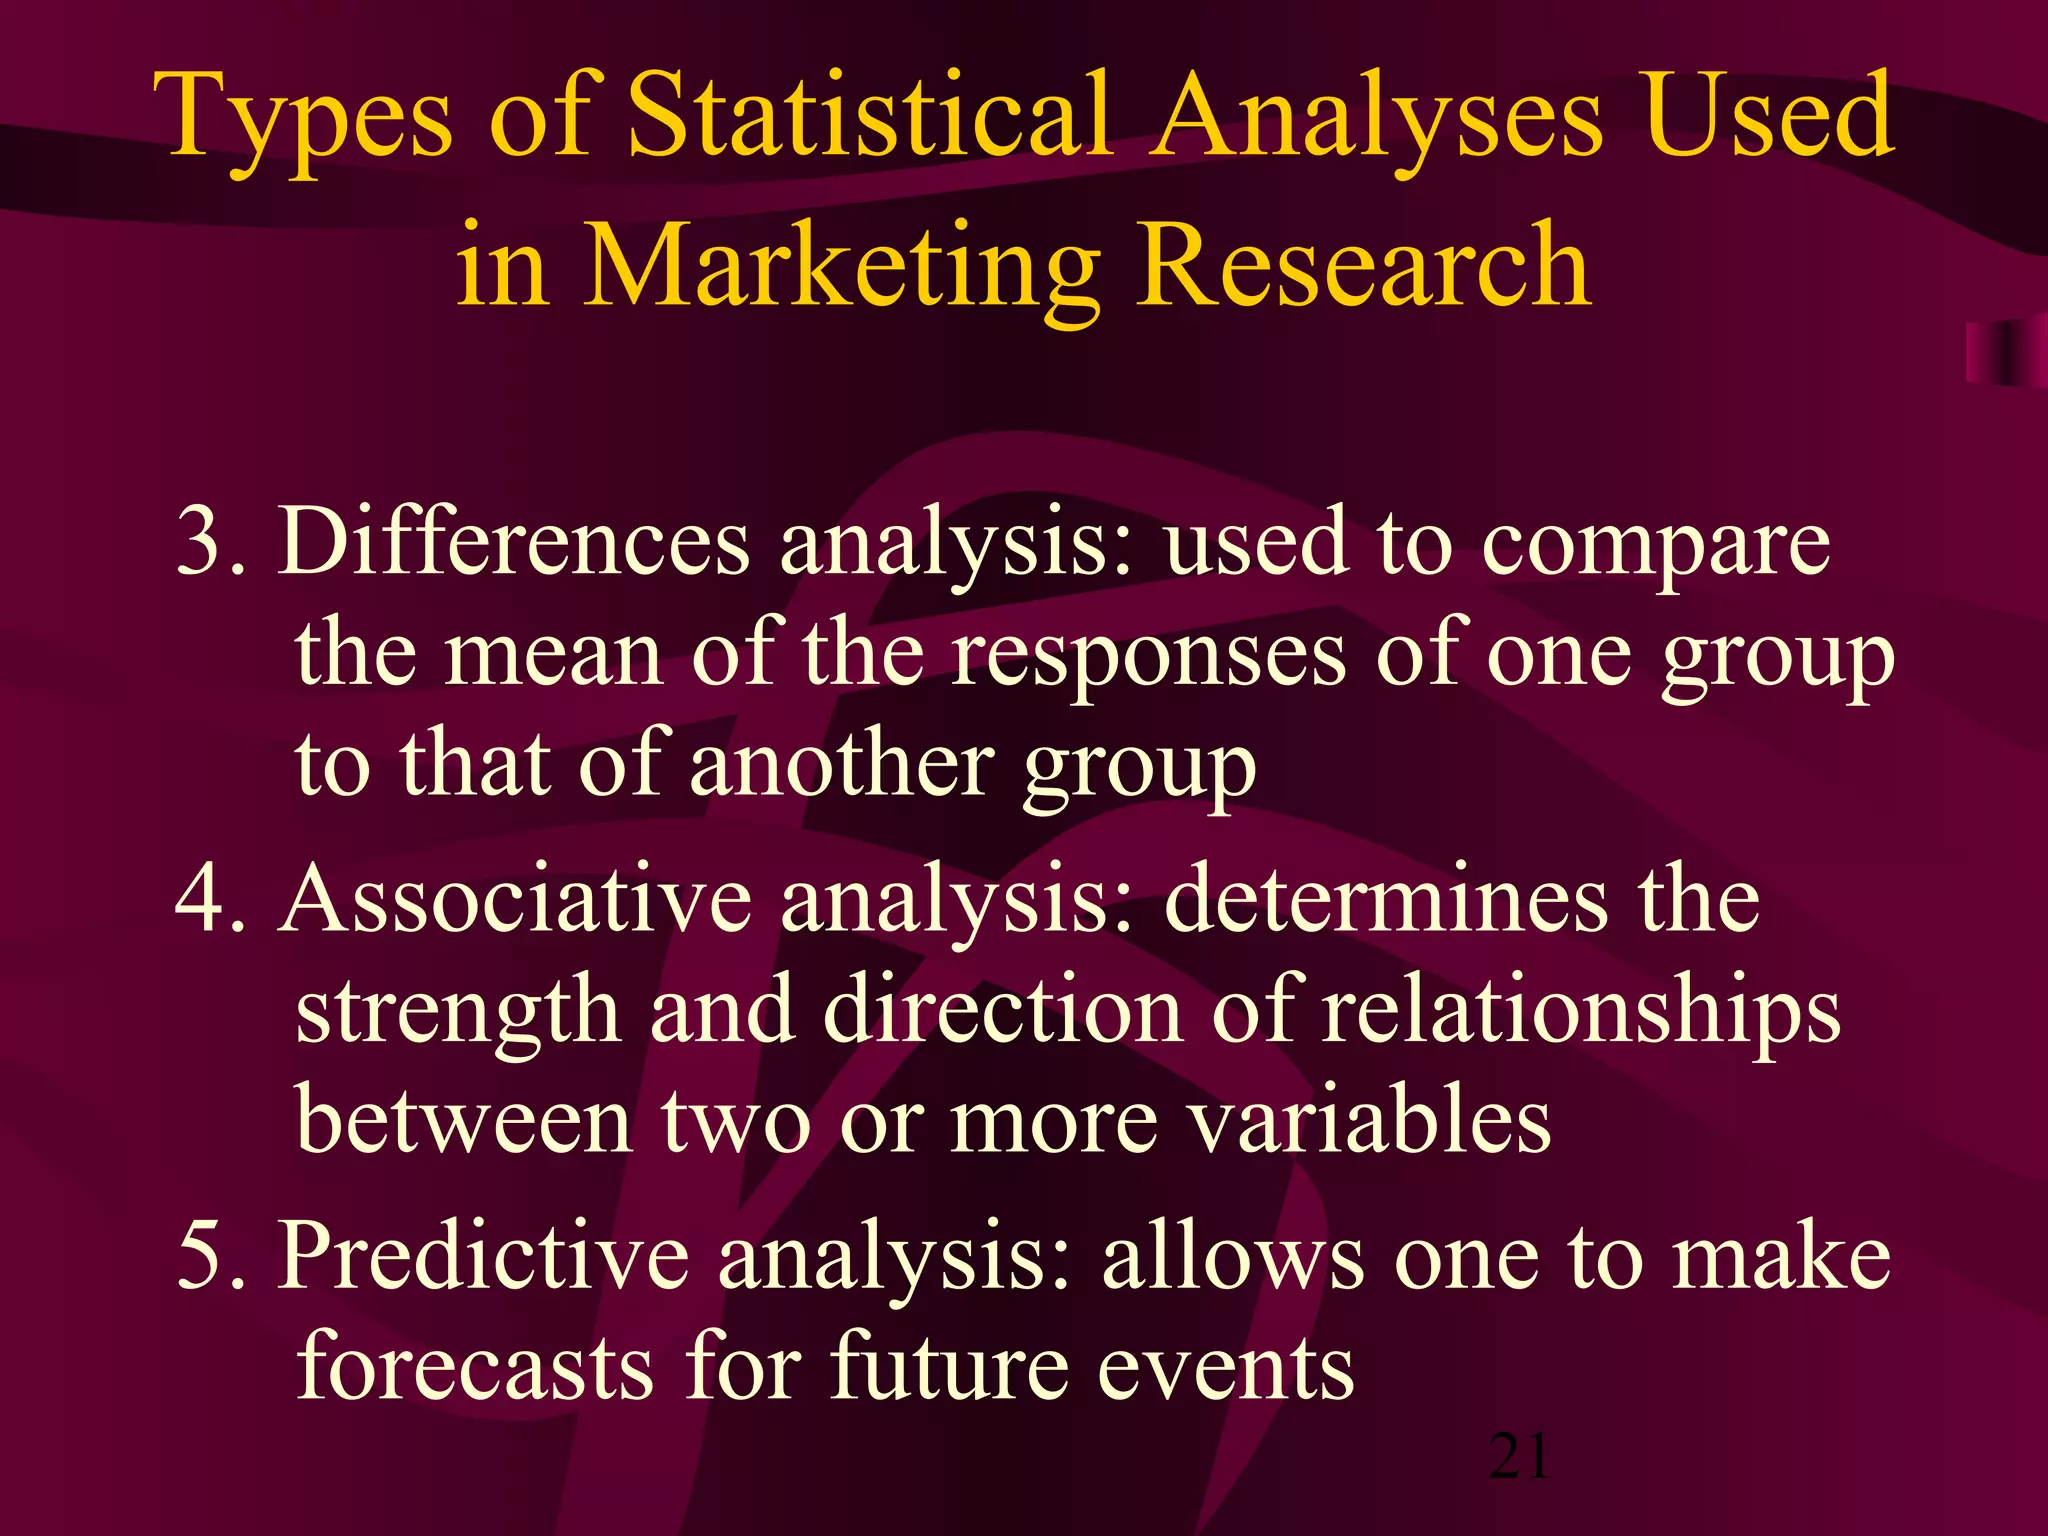
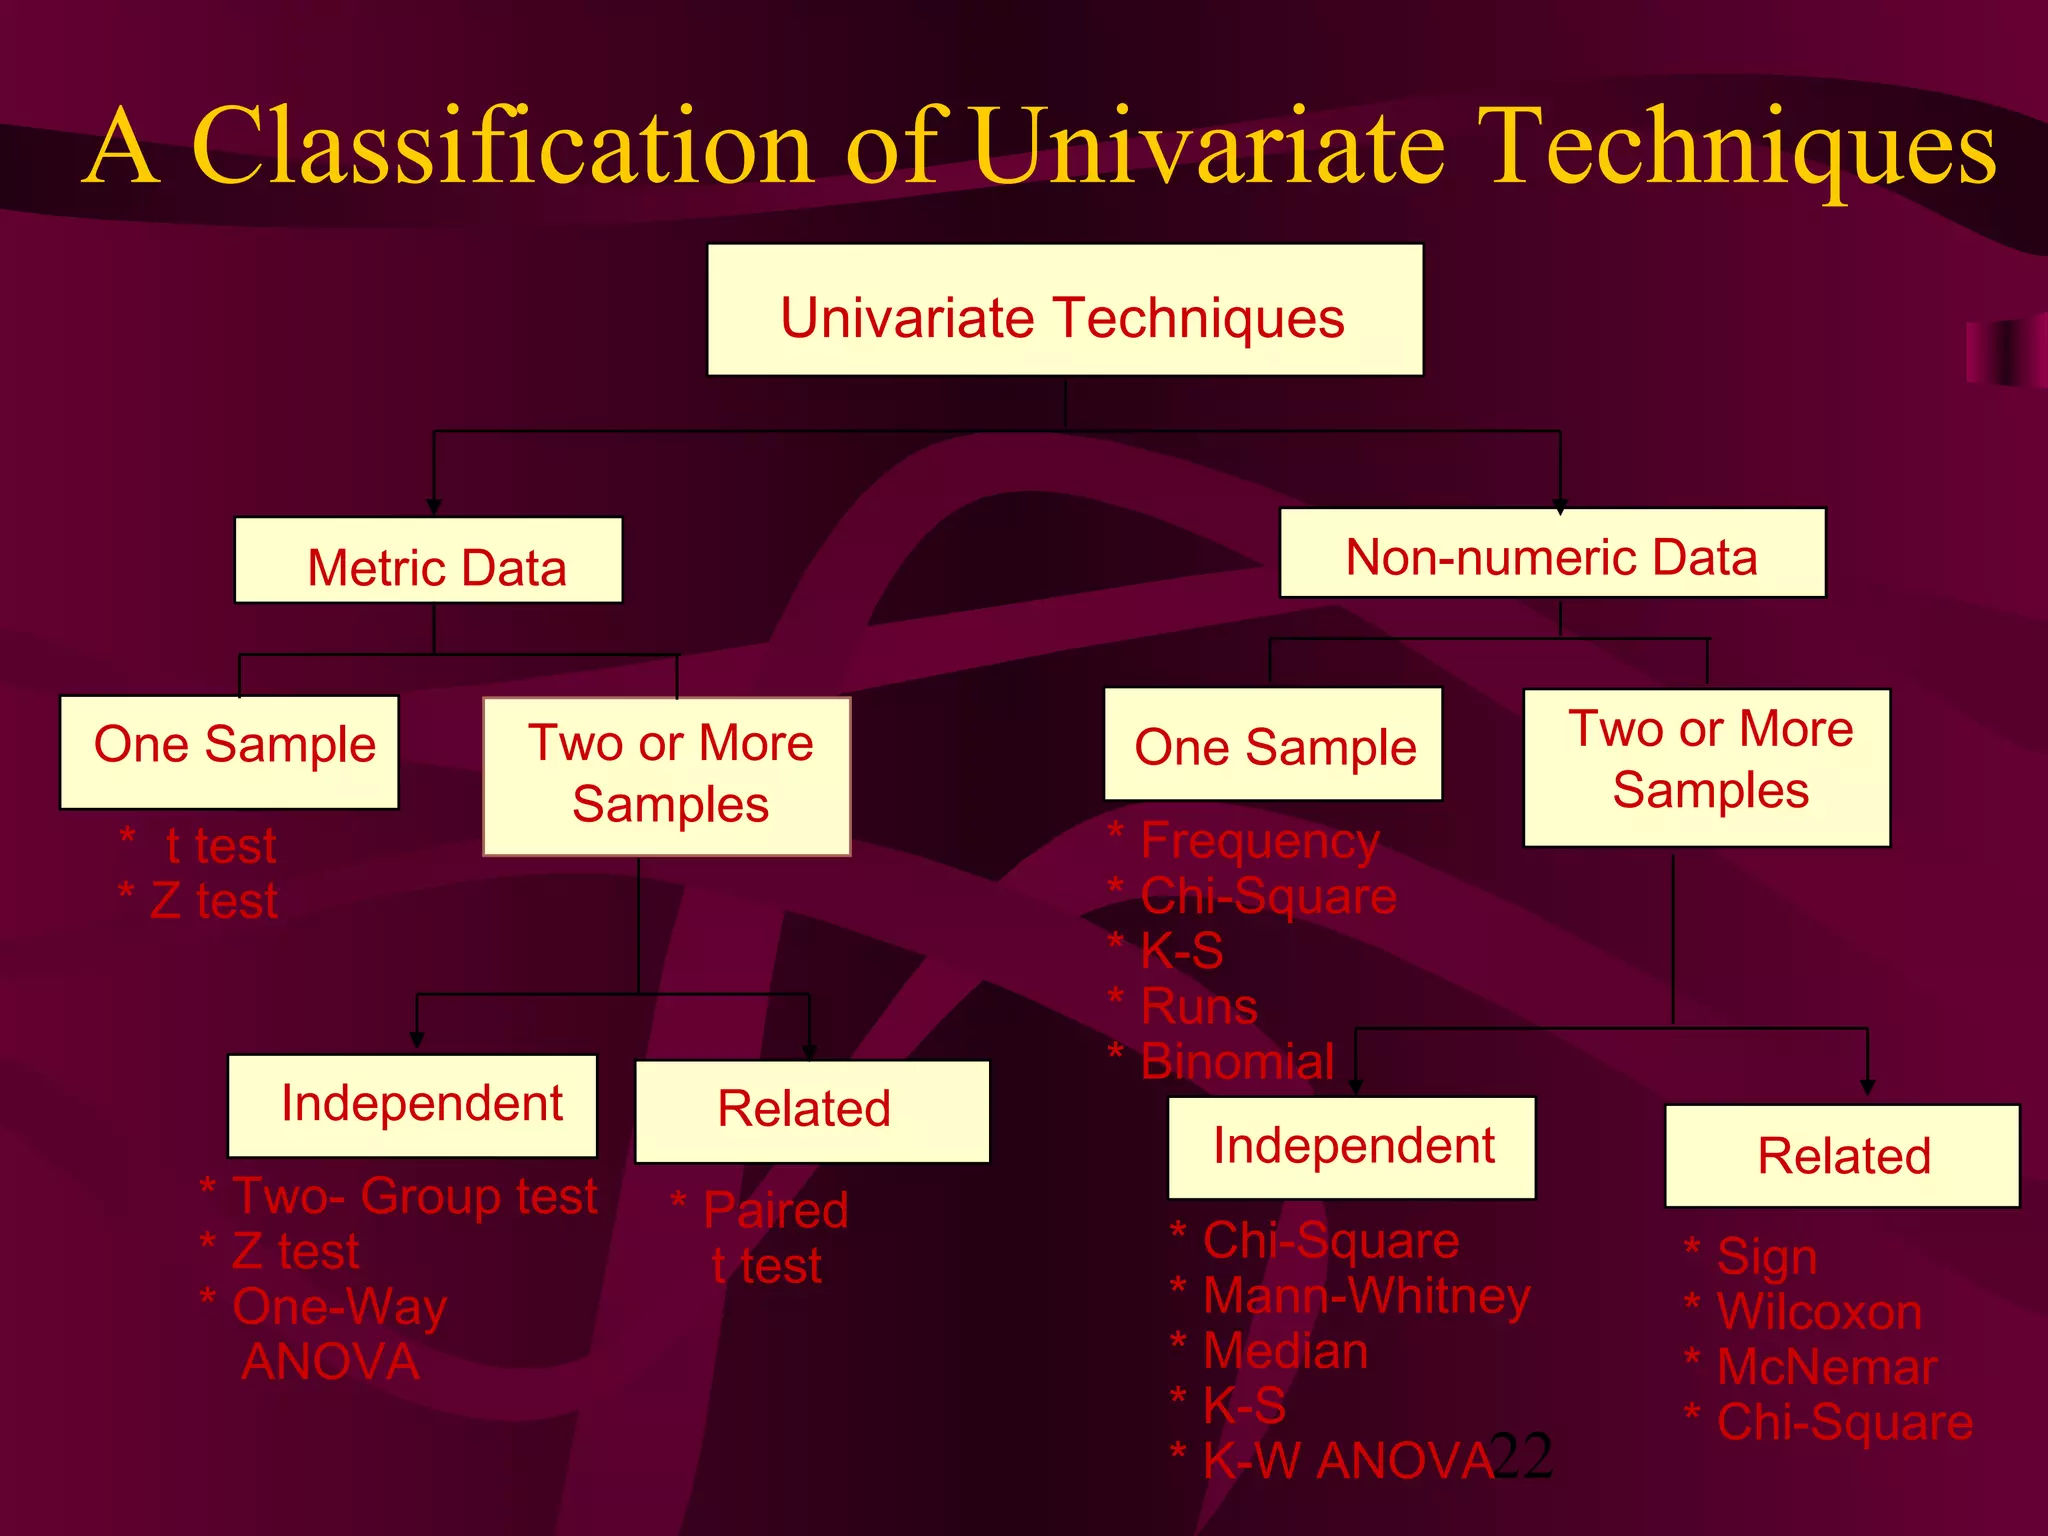
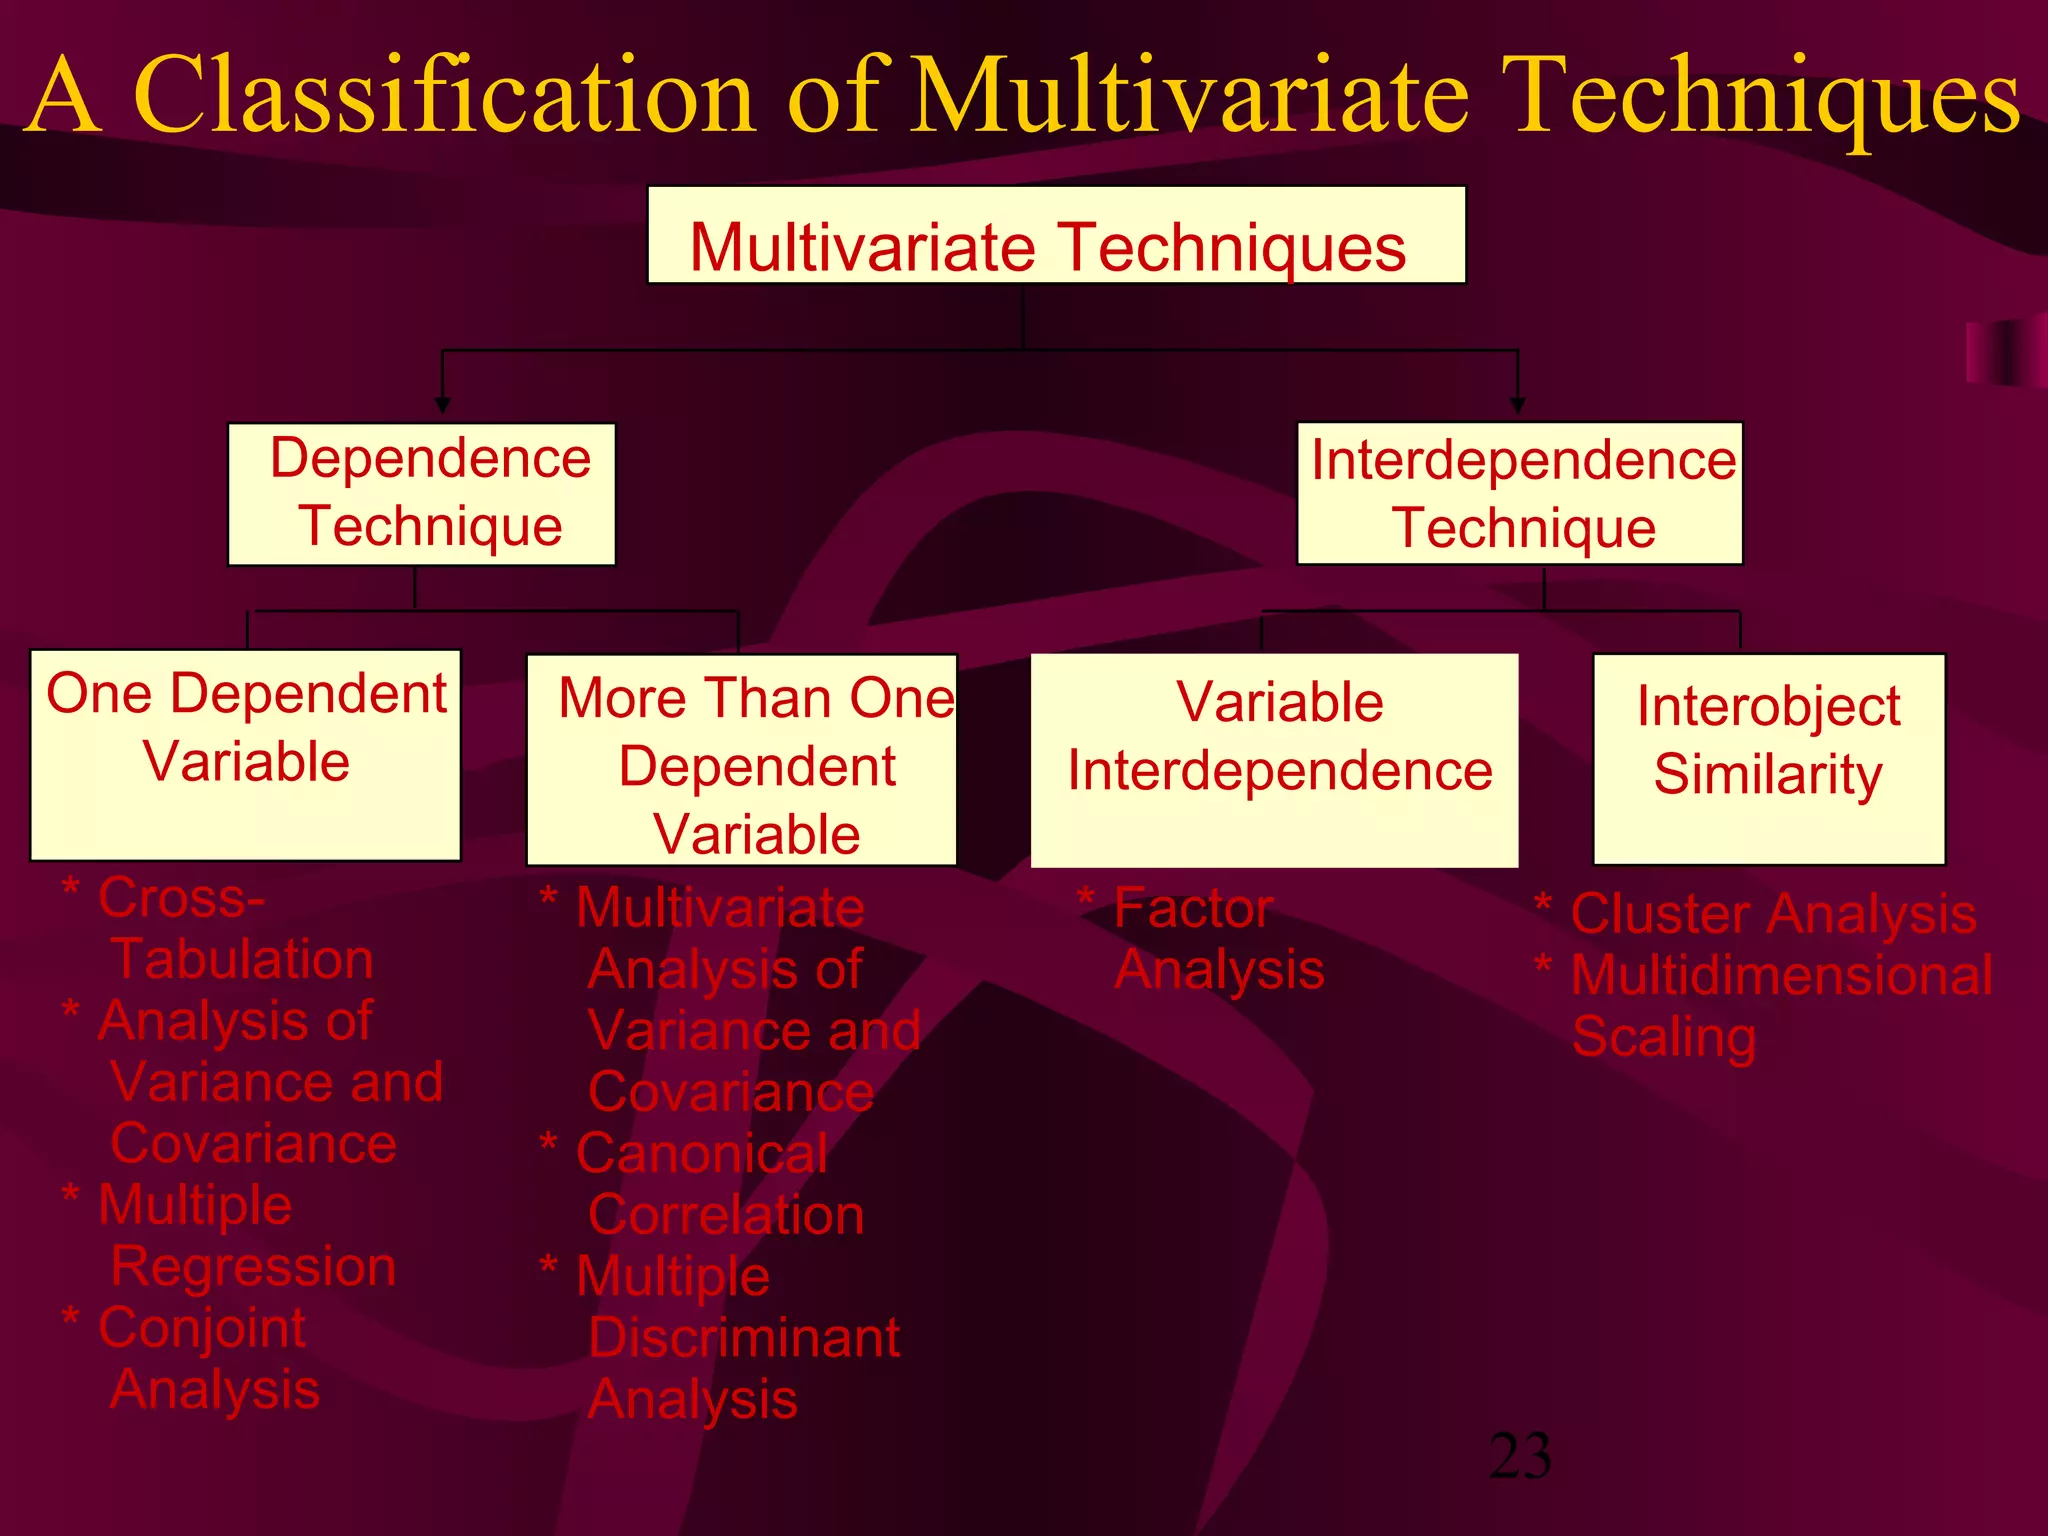
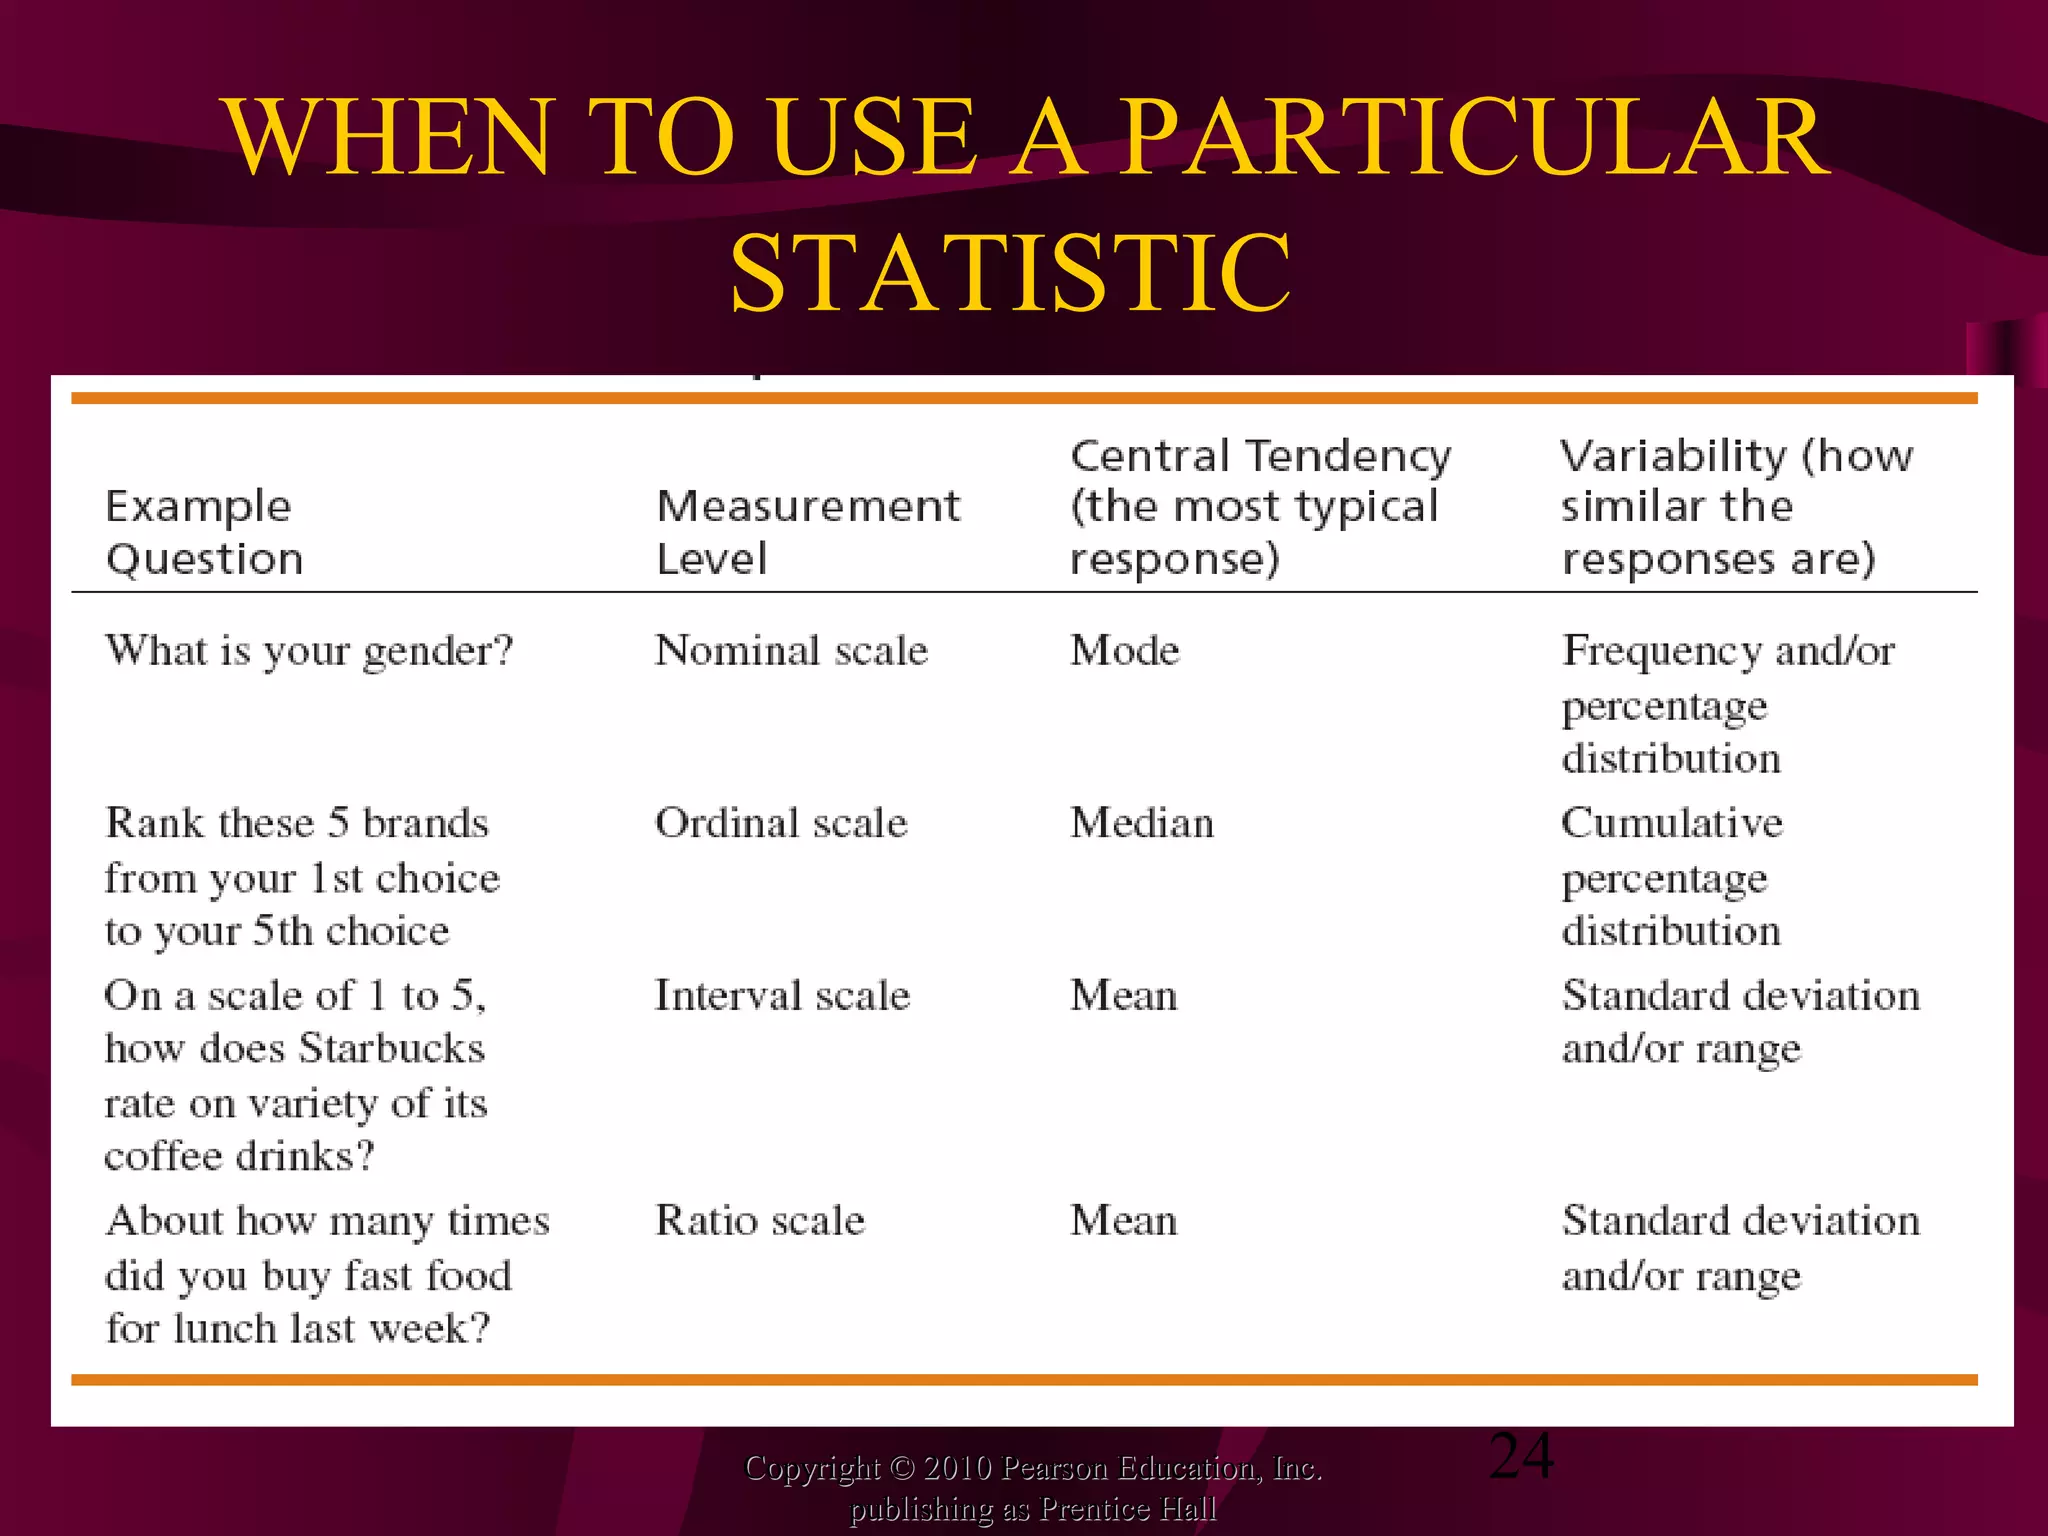
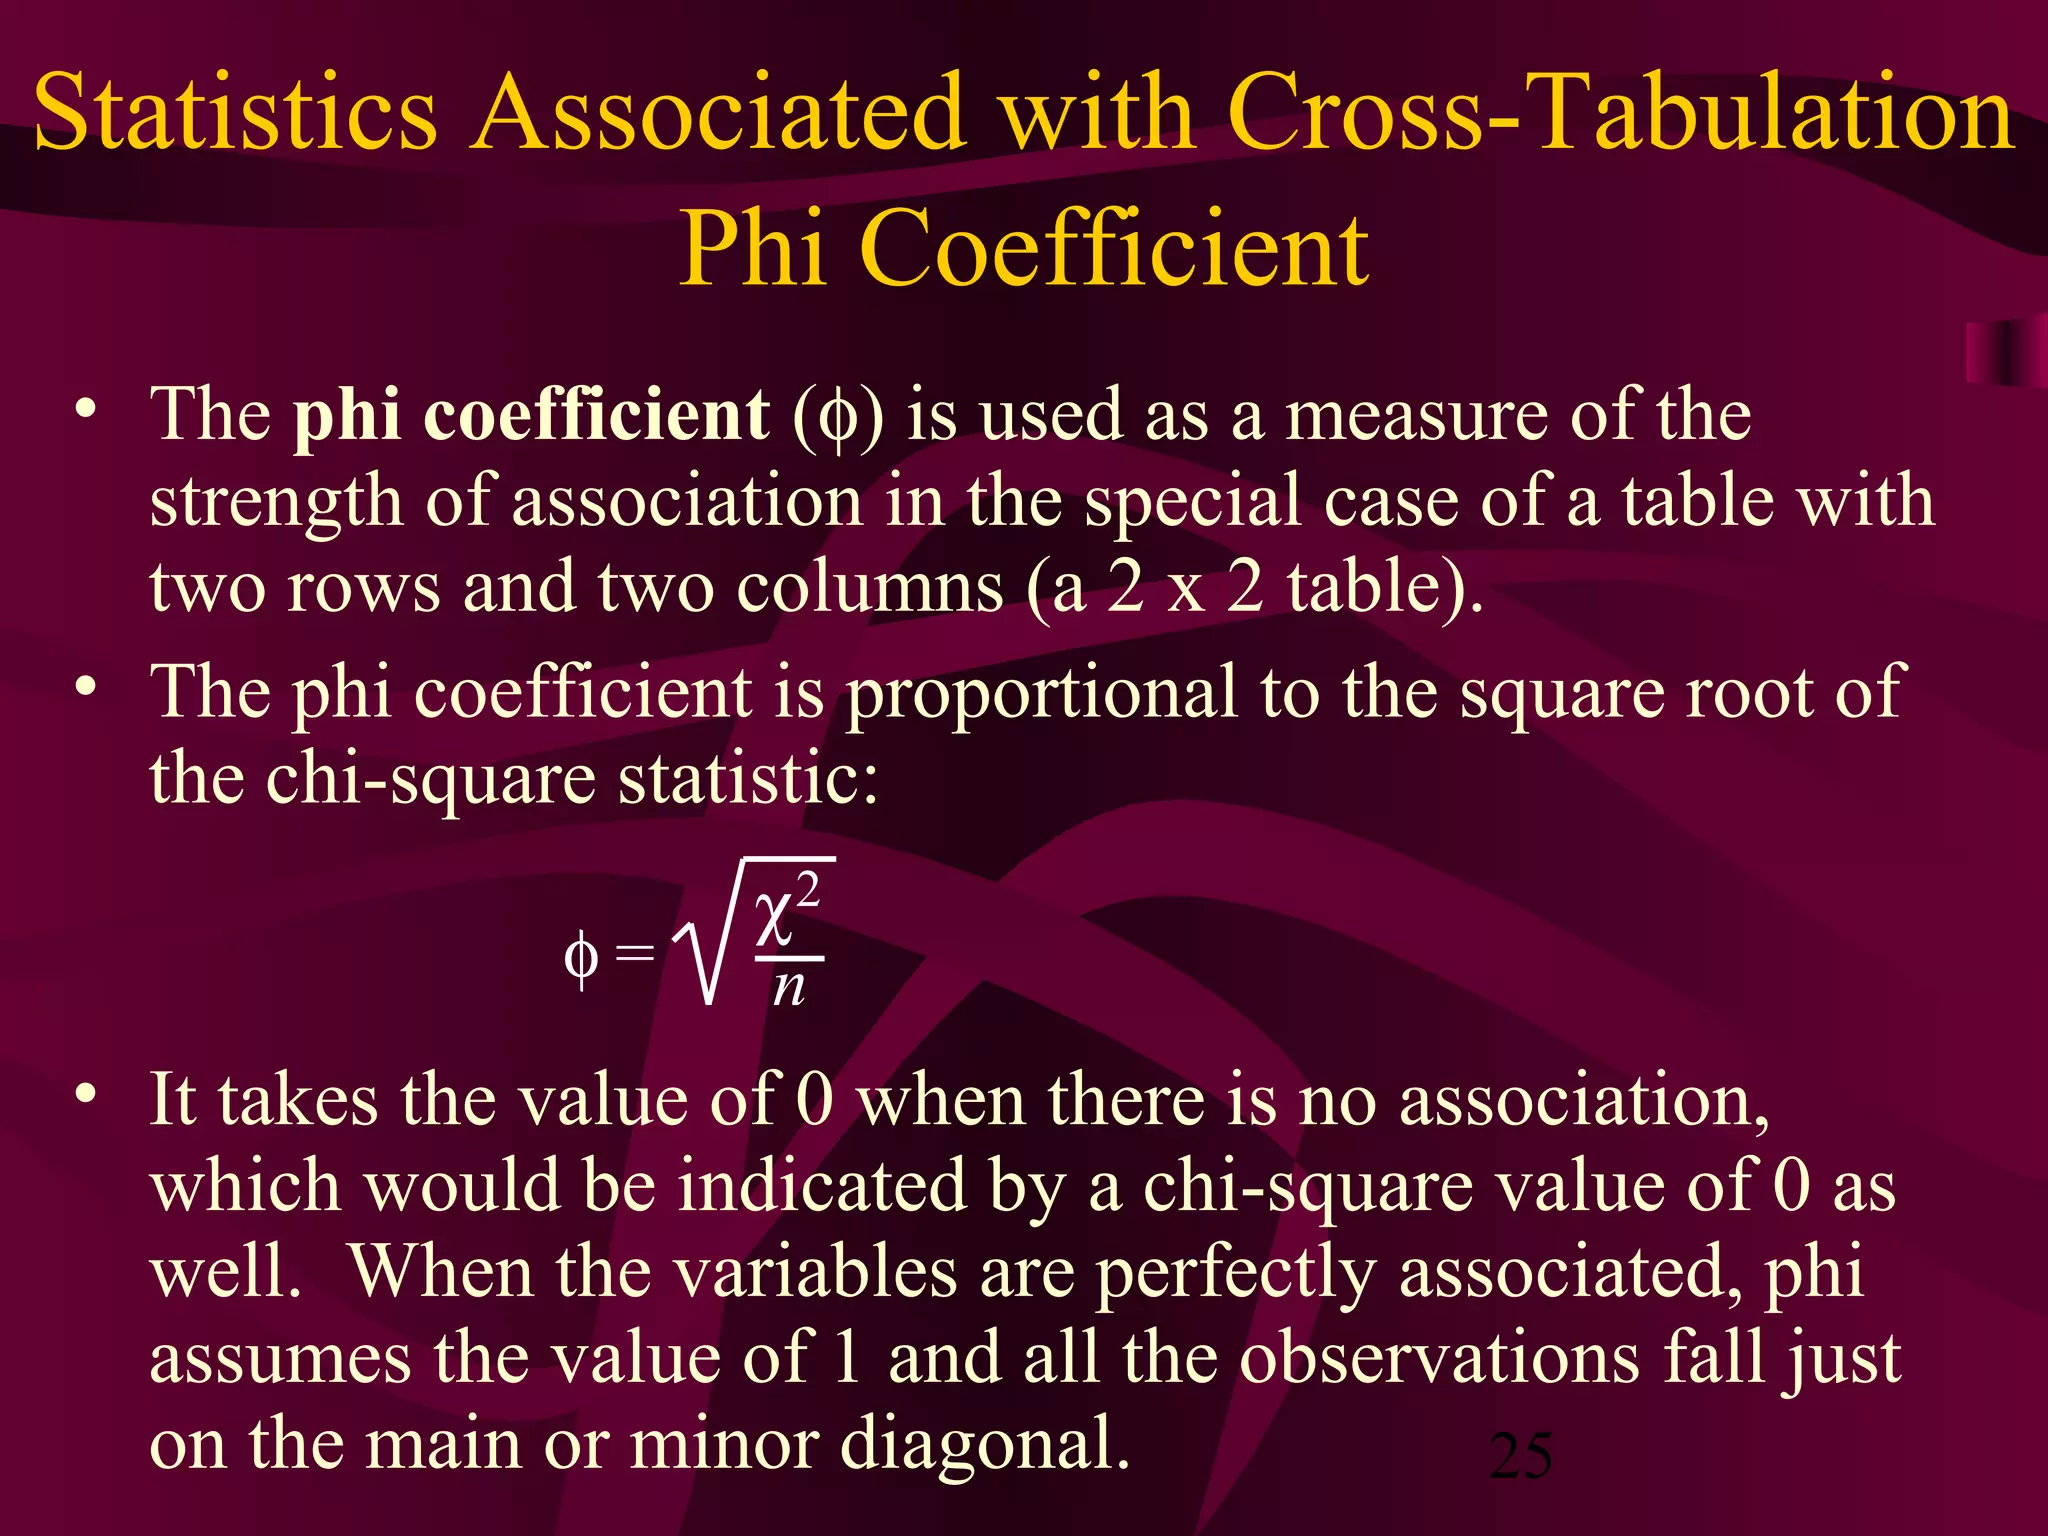
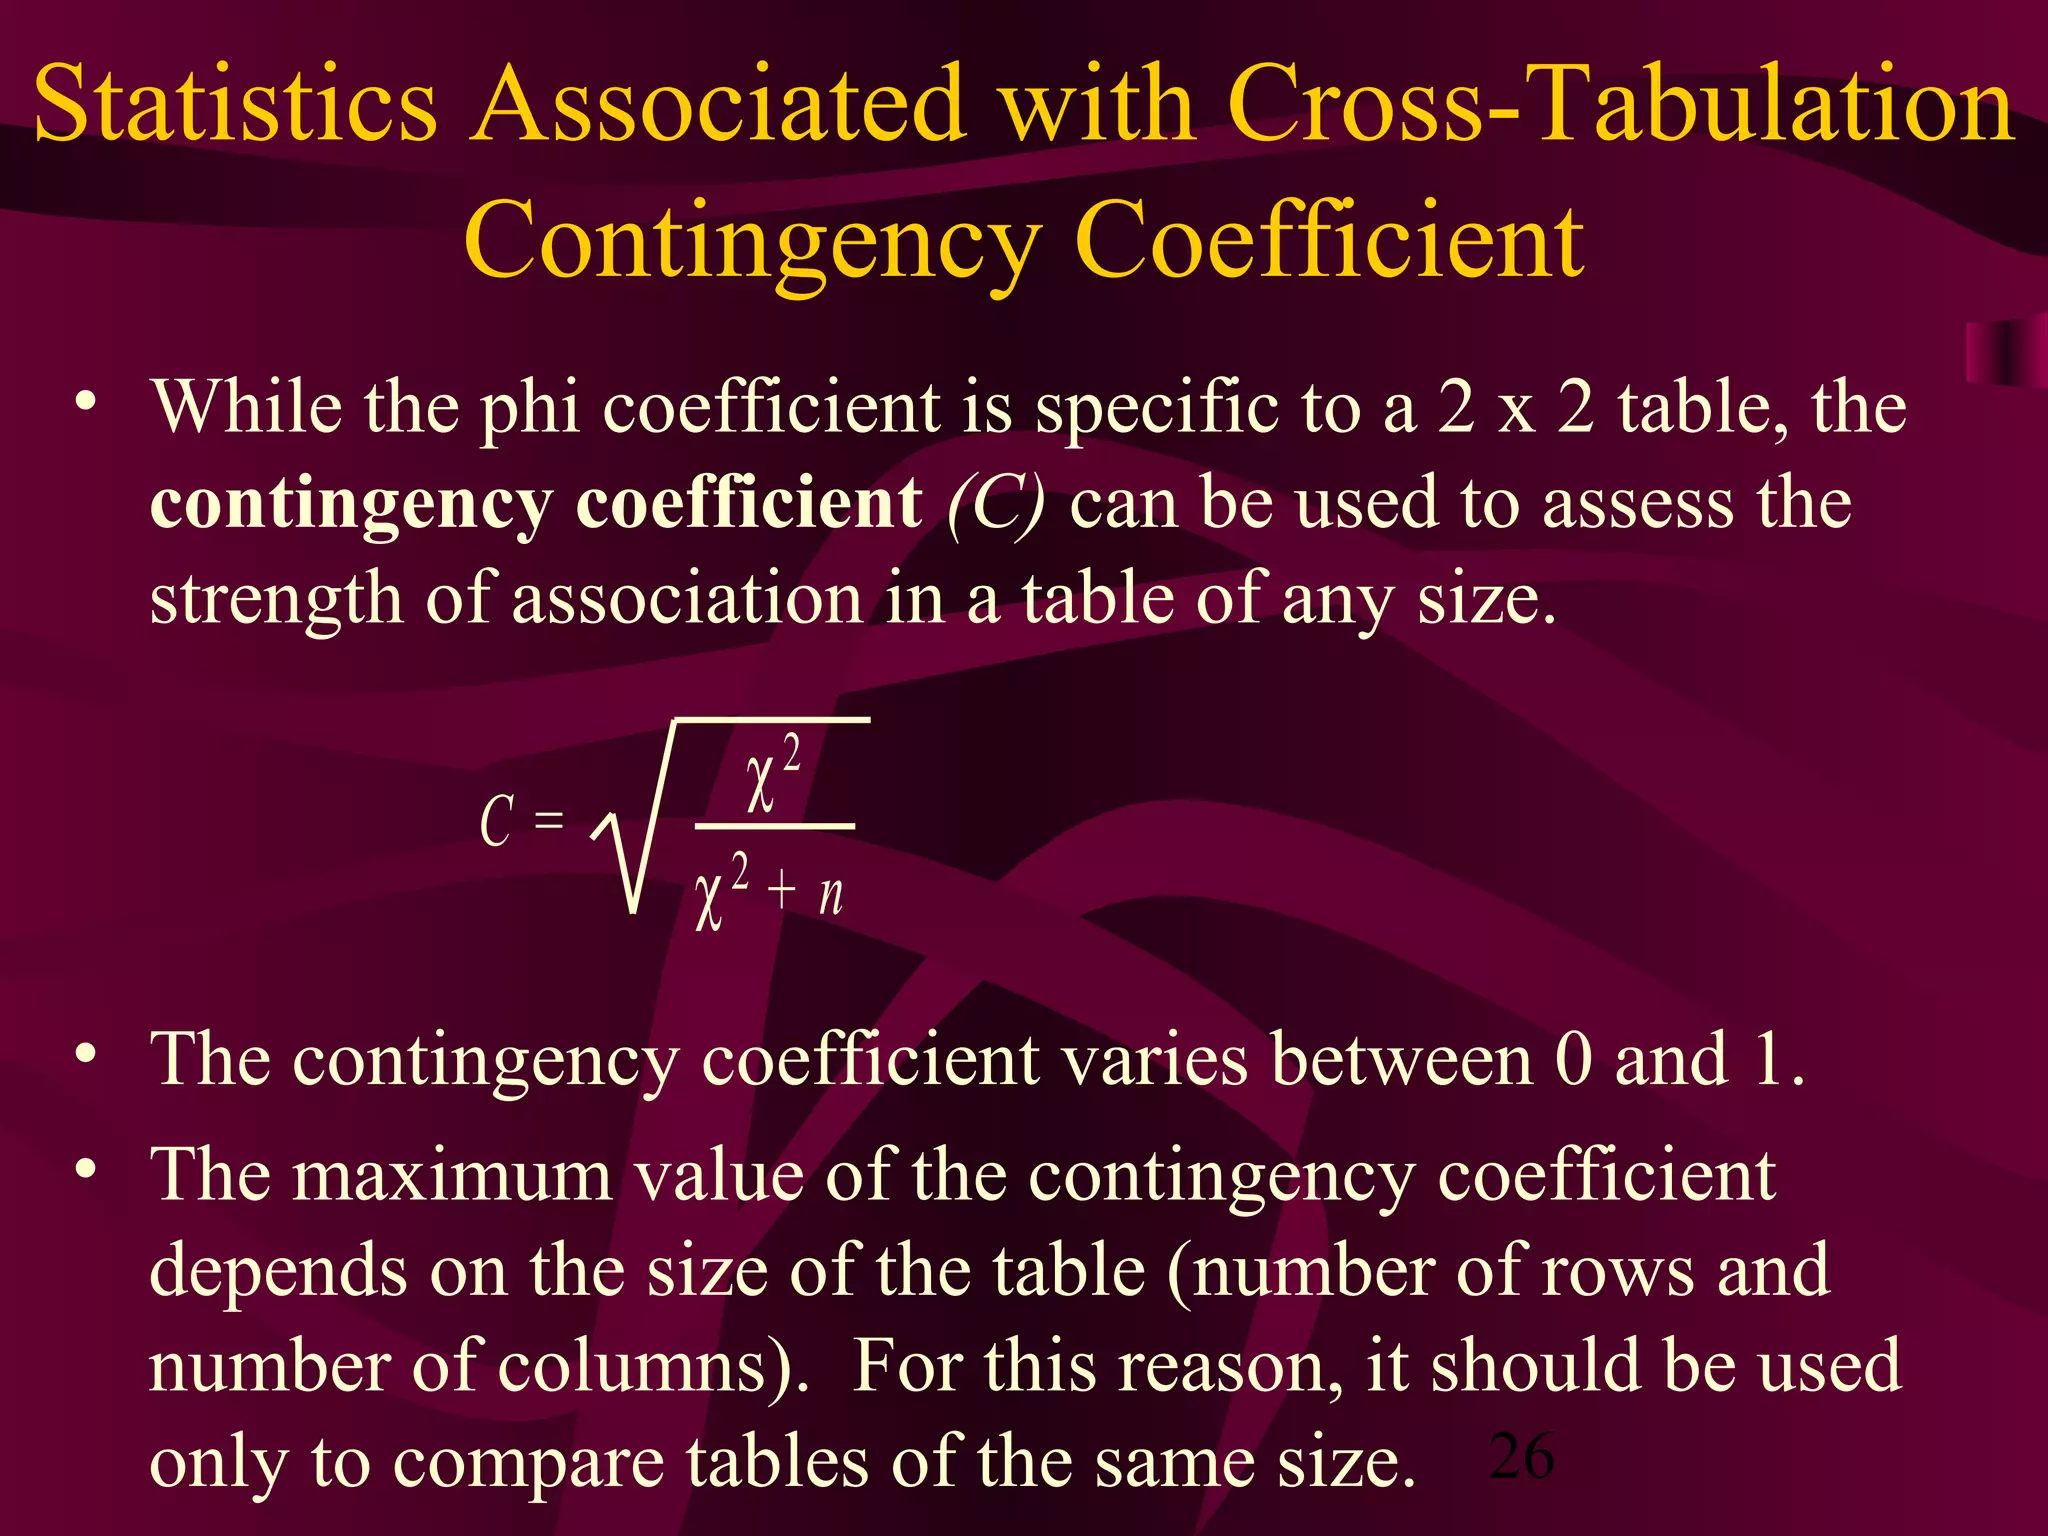
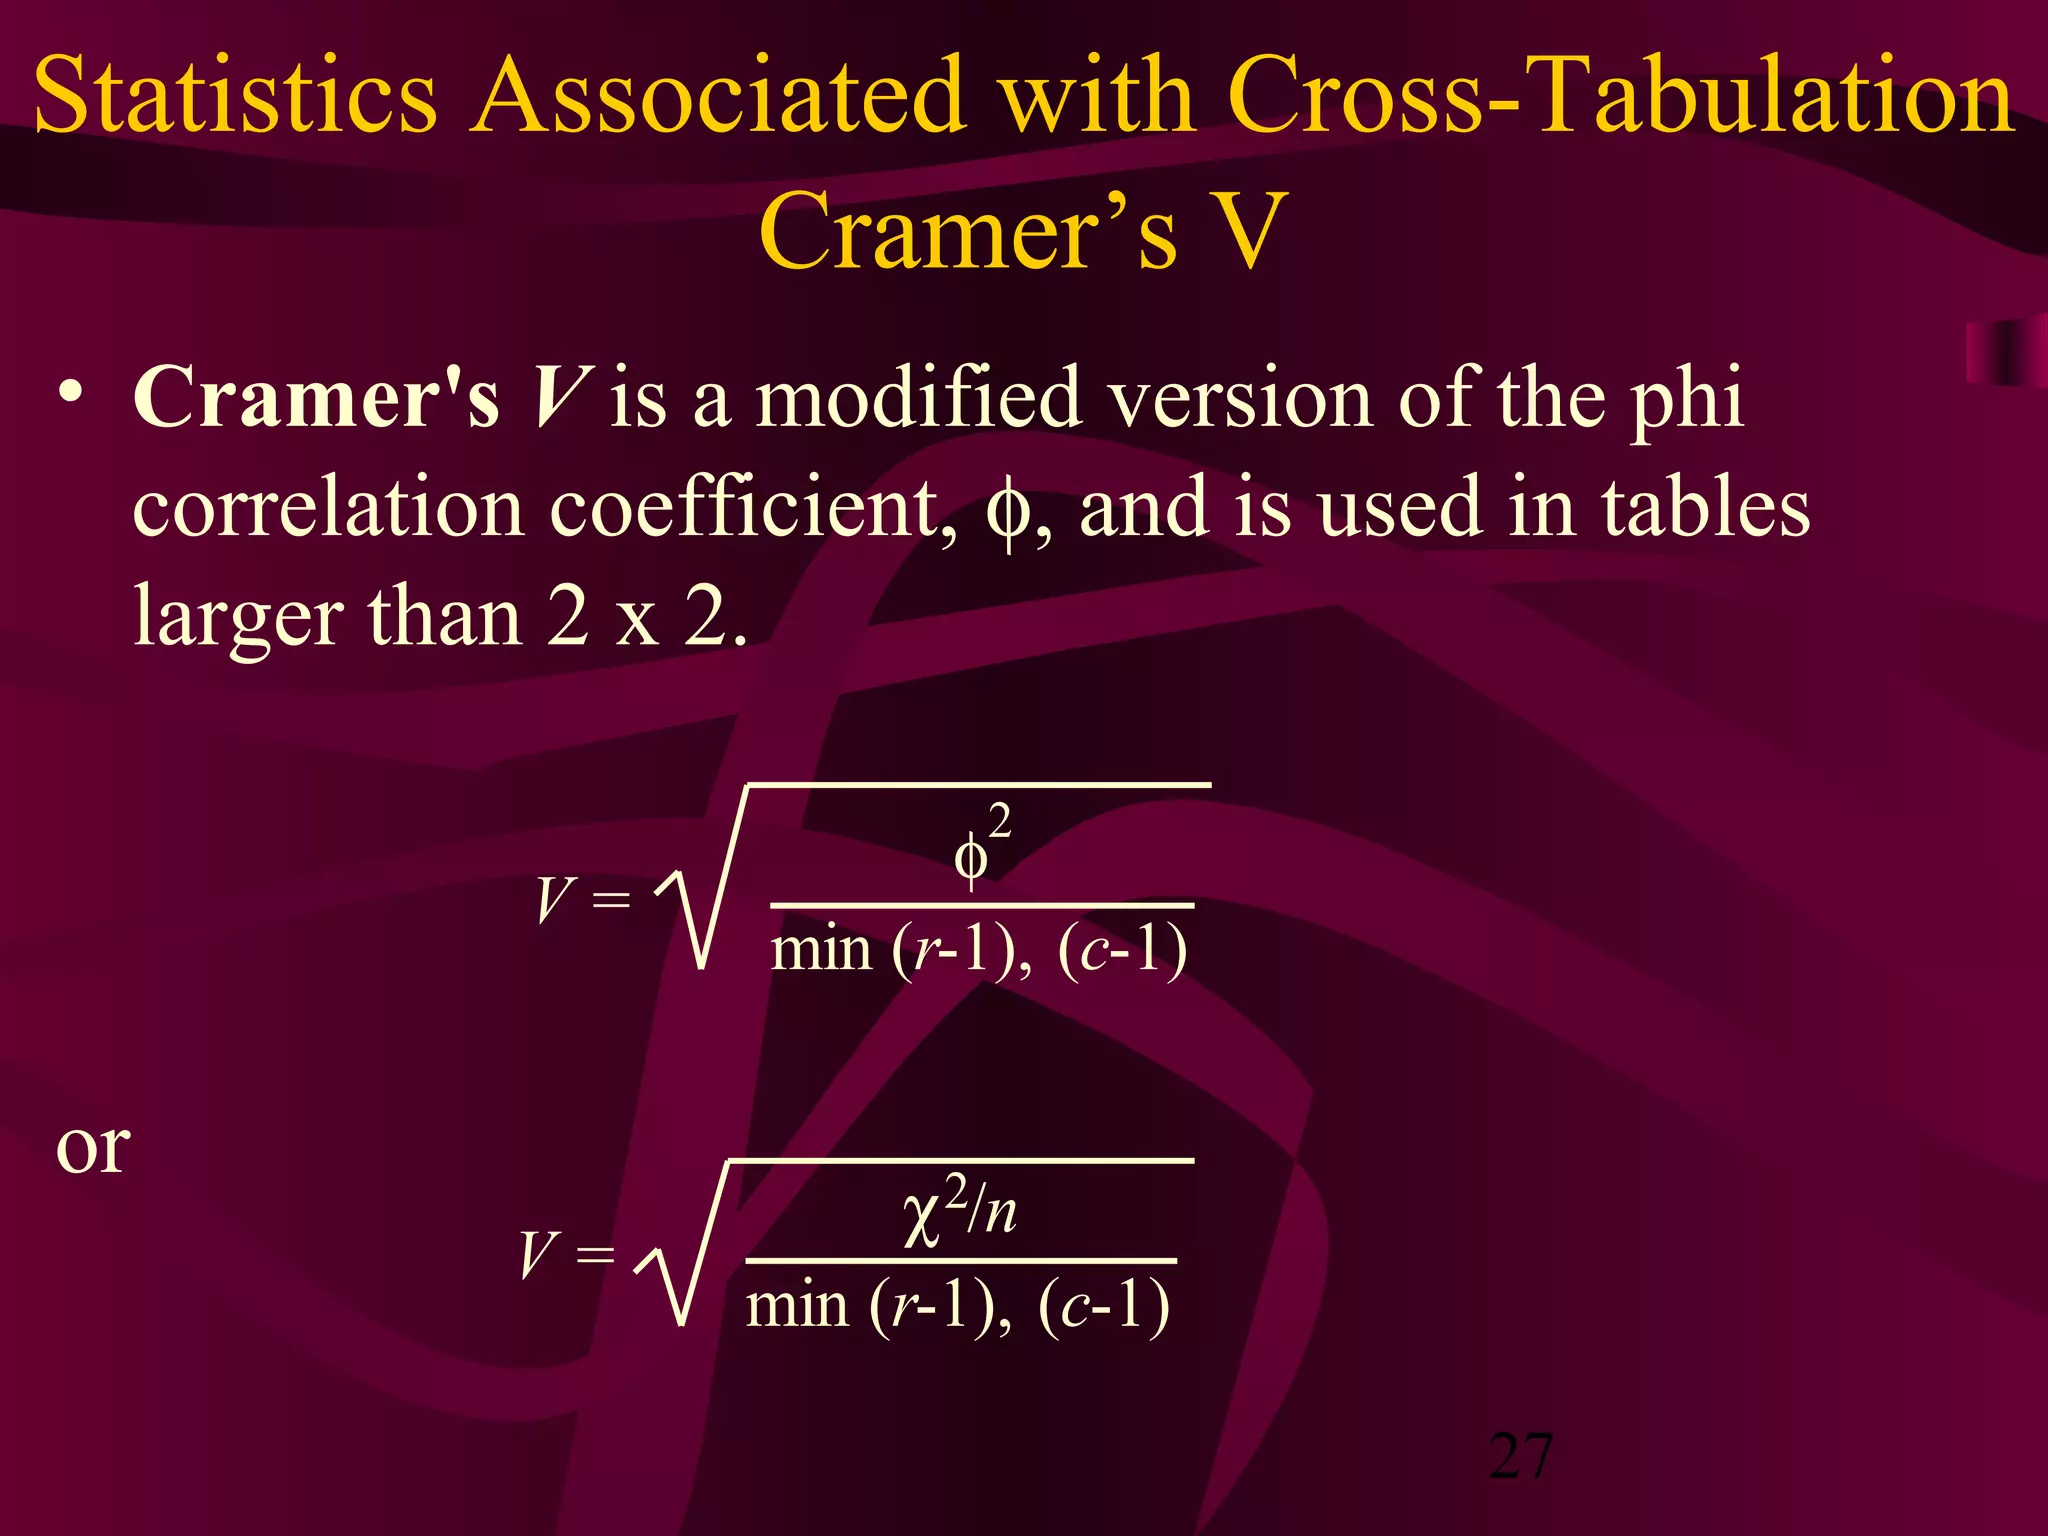

This document discusses various statistical analysis techniques used in marketing research. It begins by explaining how to bring raw data into order through arrays, tabulations and establishing categories. It then discusses descriptive, inferential, differences, associative and predictive analysis. The document also covers univariate techniques like t-tests, z-tests, ANOVA, chi-square tests and multivariate techniques like regression, conjoint analysis and cluster analysis. It provides guidance on when to use specific statistical tests and covers statistics used in cross-tabulation like phi coefficient, contingency coefficient and Cramer's V.