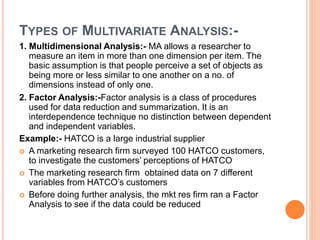
ANALYSIS OF DATA
NEHA SHARMA
BBA
NIILM UNIVERSITY
DATA ANALYSIS
 Analysis of data is a process of inspecting,
cleaning, transforming, and modeling data with the
goal of discovering useful information, suggesting
conclusions, and supporting decision making. Data
analysis has multiple facts and approaches,
encompassing diverse techniques under a variety
of names, in different business, science, and social
science domains.
TYPES OF DATA ANALYSIS:-
 Quantitative data are anything that can be
expressed as a number, or quantified. Examples of
quantitative data are scores on achievement tests,
number of hours of study, or weight of a subject.
These data may be represented by ordinal, interval
or ratio scales and lend themselves to most
statistical manipulation.
 Qualitative data cannot be expressed as a number.
Data that represent nominal scales such as gender,
socieo economic status, religious preference are
usually considered to be qualitative data.
TYPES OF QUALITATIVE DATA
1. Editing is the process of checking the
completeness, consistency, and legibility of data
and making the data ready for coding and transfer
to storage.
2. Coding:-Coding is translating answers into
numerical values or assigning numbers to the
various categories of a variable to be used in data
analysis. Coding is done by using a code book,
code sheet, and a computer card. Coding is done
on the basis of the instructions given in the
codebook. The code book gives a numerical code
for each variable.
3.CLASSIFICATION DATA
 Classification is the process of separation of data
into several classes or groups using properties in
the data set. For example, the mathematics test
results of a class can be separated into two groups
using gender. Such a classification condenses the
raw data into suitable forms for statistical analysis
and removes complex data patterns and highlights
the core representatives of the raw data. After
classification, comparisons can be made, and
inferences can be drawn.
4.TABULATION DATA
 Tabulation is a method of summarizing data, using
a systematic arrangement of data into rows and
columns. Tabulation is carried out with the intention
of carrying out investigation, for comparison, to
identify errors and omissions in data, to study a
prevailing trend, to simplify the raw data, to use the
space economically and use it as future reference.
TYPES OF QUANTITATIVE DATA
 Univariate statistical analysis tests hypotheses
involving only one variable.
 Bivariate statistical analysis tests hypotheses
involving two variables.
 Multivariate statistical analysis tests hypotheses
and models involving multiple (three or more)
variables or sets of variables.
TYPES OF UNIVARIATE ANALYSIS
1.A central tendency is a central value or a typical value
for a probability distribution. Measures of central
tendency are numbers that describe what is average or
typical of the distribution of data. There are three main
measures of central tendency: mean, median, and mode.
2. Dispersion (also called statistical variability or variation)
is variability or spread in a variable or a probability
distribution. Common examples of measures of statistical
dispersion are the variance, standard deviation and
interquartile range.
SIMPLE REGRESSION & CORRELATION
3. Regression analysis is used to determine the
functional relationship between a dependent variable
& a host of predictors.
4. Correlation Analysis tries to measure the magnitude
& direction of relationship between two variables.
Multiple & partial correlation analysis extend the same
nation between a single variable & set of variables.
Variables change together usually scale (interval or
ratio) variables. It can be either positive or negative
falls between -1.00 and 1.00
Y
X
Y
X
Y
Y
X
X
Strong relationships Weak relationships
LINEAR CORRELATION
Slide from: Statistics for Managers Using Microsoft® Excel 4th Edition, 2004 Prentice-Hall
LINEAR CORRELATION
Y
X
Y
X
No relationship
Slide from: Statistics for Managers Using Microsoft® Excel 4th Edition, 2004 Prentice-Hall
TYPES OF MULTIVARIATE ANALYSIS:-
1. Multidimensional Analysis:- MA allows a researcher to
measure an item in more than one dimension per item. The
basic assumption is that people perceive a set of objects as
being more or less similar to one another on a no. of
dimensions instead of only one.
2. Factor Analysis:-Factor analysis is a class of procedures
used for data reduction and summarization. It is an
interdependence technique no distinction between dependent
and independent variables.
Example:- HATCO is a large industrial supplier
 A marketing research firm surveyed 100 HATCO customers,
to investigate the customers’ perceptions of HATCO
 The marketing research firm obtained data on 7 different
variables from HATCO’s customers
 Before doing further analysis, the mkt res firm ran a Factor
Analysis to see if the data could be reduced
CONT…….
 In a B2B situation, HATCO wanted to know the perceptions
that its customers had about it
 The marketing research firm gathered data on 7 variables
1. Delivery speed
2. Price level
3. Price flexibility
4. Manufacturer’s image
5. Overall service
6. Sales force image
7. Product quality
 Each variable was measured on a 10 cm graphic rating
scaling.
3. CLUSTER ANALYSIS
 Cluster analysis consists of methods of classifying
variables into clusters. Technically, a CA consists of
variable that correlate highly with one to another &
have comparatively low correlations with the variables
in order cluster. The purpose of cluster analysis is to
place subjects/objects into groups, or clusters,
suggested by the data, such that objects in a given
cluster are homogenous in some sense, and objects in
different clusters are dissimilar to a great extent.
Data analysis

Data analysis

  • 1.
    ANALYSIS OF DATA NEHASHARMA BBA NIILM UNIVERSITY
  • 2.
    DATA ANALYSIS  Analysisof data is a process of inspecting, cleaning, transforming, and modeling data with the goal of discovering useful information, suggesting conclusions, and supporting decision making. Data analysis has multiple facts and approaches, encompassing diverse techniques under a variety of names, in different business, science, and social science domains.
  • 3.
    TYPES OF DATAANALYSIS:-  Quantitative data are anything that can be expressed as a number, or quantified. Examples of quantitative data are scores on achievement tests, number of hours of study, or weight of a subject. These data may be represented by ordinal, interval or ratio scales and lend themselves to most statistical manipulation.  Qualitative data cannot be expressed as a number. Data that represent nominal scales such as gender, socieo economic status, religious preference are usually considered to be qualitative data.
  • 4.
    TYPES OF QUALITATIVEDATA 1. Editing is the process of checking the completeness, consistency, and legibility of data and making the data ready for coding and transfer to storage. 2. Coding:-Coding is translating answers into numerical values or assigning numbers to the various categories of a variable to be used in data analysis. Coding is done by using a code book, code sheet, and a computer card. Coding is done on the basis of the instructions given in the codebook. The code book gives a numerical code for each variable.
  • 5.
    3.CLASSIFICATION DATA  Classificationis the process of separation of data into several classes or groups using properties in the data set. For example, the mathematics test results of a class can be separated into two groups using gender. Such a classification condenses the raw data into suitable forms for statistical analysis and removes complex data patterns and highlights the core representatives of the raw data. After classification, comparisons can be made, and inferences can be drawn.
  • 6.
    4.TABULATION DATA  Tabulationis a method of summarizing data, using a systematic arrangement of data into rows and columns. Tabulation is carried out with the intention of carrying out investigation, for comparison, to identify errors and omissions in data, to study a prevailing trend, to simplify the raw data, to use the space economically and use it as future reference.
  • 7.
    TYPES OF QUANTITATIVEDATA  Univariate statistical analysis tests hypotheses involving only one variable.  Bivariate statistical analysis tests hypotheses involving two variables.  Multivariate statistical analysis tests hypotheses and models involving multiple (three or more) variables or sets of variables.
  • 8.
    TYPES OF UNIVARIATEANALYSIS 1.A central tendency is a central value or a typical value for a probability distribution. Measures of central tendency are numbers that describe what is average or typical of the distribution of data. There are three main measures of central tendency: mean, median, and mode. 2. Dispersion (also called statistical variability or variation) is variability or spread in a variable or a probability distribution. Common examples of measures of statistical dispersion are the variance, standard deviation and interquartile range.
  • 9.
    SIMPLE REGRESSION &CORRELATION 3. Regression analysis is used to determine the functional relationship between a dependent variable & a host of predictors. 4. Correlation Analysis tries to measure the magnitude & direction of relationship between two variables. Multiple & partial correlation analysis extend the same nation between a single variable & set of variables. Variables change together usually scale (interval or ratio) variables. It can be either positive or negative falls between -1.00 and 1.00
  • 10.
    Y X Y X Y Y X X Strong relationships Weakrelationships LINEAR CORRELATION Slide from: Statistics for Managers Using Microsoft® Excel 4th Edition, 2004 Prentice-Hall
  • 11.
    LINEAR CORRELATION Y X Y X No relationship Slidefrom: Statistics for Managers Using Microsoft® Excel 4th Edition, 2004 Prentice-Hall
  • 12.
    TYPES OF MULTIVARIATEANALYSIS:- 1. Multidimensional Analysis:- MA allows a researcher to measure an item in more than one dimension per item. The basic assumption is that people perceive a set of objects as being more or less similar to one another on a no. of dimensions instead of only one. 2. Factor Analysis:-Factor analysis is a class of procedures used for data reduction and summarization. It is an interdependence technique no distinction between dependent and independent variables. Example:- HATCO is a large industrial supplier  A marketing research firm surveyed 100 HATCO customers, to investigate the customers’ perceptions of HATCO  The marketing research firm obtained data on 7 different variables from HATCO’s customers  Before doing further analysis, the mkt res firm ran a Factor Analysis to see if the data could be reduced
  • 13.
    CONT…….  In aB2B situation, HATCO wanted to know the perceptions that its customers had about it  The marketing research firm gathered data on 7 variables 1. Delivery speed 2. Price level 3. Price flexibility 4. Manufacturer’s image 5. Overall service 6. Sales force image 7. Product quality  Each variable was measured on a 10 cm graphic rating scaling.
  • 14.
    3. CLUSTER ANALYSIS Cluster analysis consists of methods of classifying variables into clusters. Technically, a CA consists of variable that correlate highly with one to another & have comparatively low correlations with the variables in order cluster. The purpose of cluster analysis is to place subjects/objects into groups, or clusters, suggested by the data, such that objects in a given cluster are homogenous in some sense, and objects in different clusters are dissimilar to a great extent.