Downloaded 1,159 times

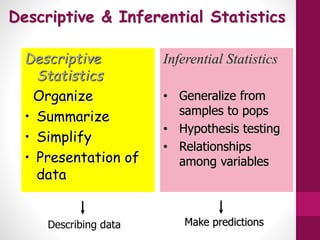
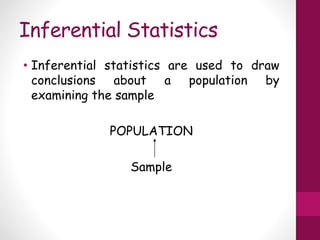
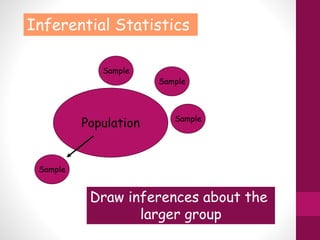
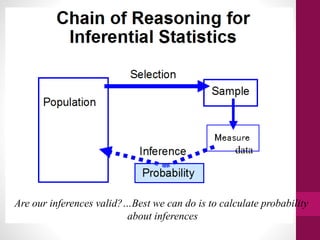

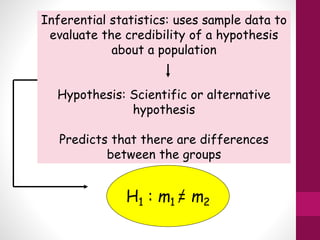
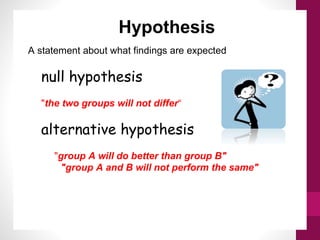
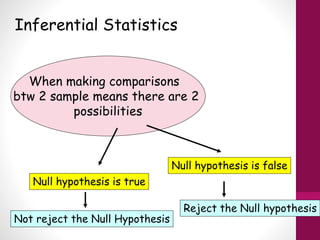
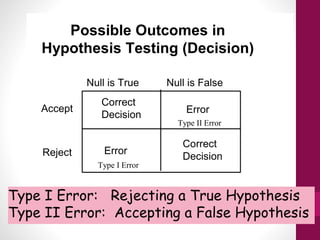
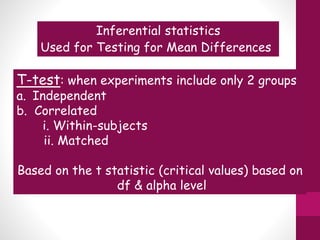
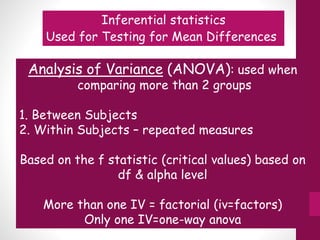
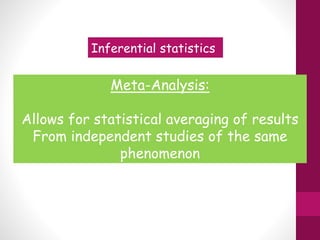
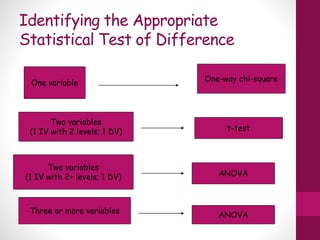

This document provides an overview of inferential statistics. It defines inferential statistics as using samples to draw conclusions about populations and make predictions. It discusses key concepts like hypothesis testing, null and alternative hypotheses, type I and type II errors, significance levels, power, and effect size. Common inferential tests like t-tests, ANOVA, and meta-analyses are also introduced. The document emphasizes that inferential statistics allow researchers to generalize from samples to populations and test hypotheses about relationships between variables.