DESCRIPTIVE STATISTICS
AND
INFERENTIAL STATISTICS
Prepared by: Danica A. Antiquina
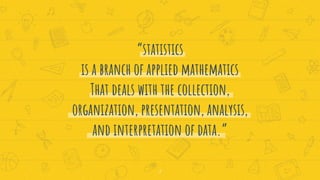
“statistics
is a branch of applied mathematics
That deals with the collection,
organization, presentation, analysis,
and interpretation of data.”
2
Two major areas of statistics
✘ Descriptive Statistics
 It deals with the collection and presentation of
data and summarizing values that describe
the group’s characteristics.
✘ Inferential Statistics
 It deals with predictions and inferences based
on the analysis and interpretation of the
results of the information gathered by the
statistician.
3
Common Problems
✘ Descriptive Statistics
 What is the percentage of X, Y, and Z participants?
 What is the average monthly salary of the employees in Company A?
 How much students in SRCB are satisfied about the quality education it
provides?
✘ Inferential Statistics
 Is the claim true that the mean lifespan of the batter-operated toy cars is 5
years?
 Is the claim true that the student’s performance in Biology did not
improve?
 Is there a significant difference in the mean sales of the three candidates
for promotion?
4
✘ Descriptive Statistics
 You could make a bar chart of yes or no answers.
✘ Inferential Statistics
 You could use your research to reason that around 75-80% of the
population (all shoppers in all malls) like shopping at Prince
Hypermart.
5
Example:
You might stand in a mall and ask a sample of 100
people if they like shopping at Prince Hypermart.
DESCRIPTIVE
STATISTICS
It organize,
analyze, and
present data in a
meaningful way.
Differences Based on WHAT IT DOES?
INFERENTIAL
STATISTICS
Compares, test
and predicts
data.
6
DESCRIPTIVE STATISTICS
✘ Measures of Central Tendency
✘ Measures of Variation
Differences Based on tools
INFERENTIAL STATISTICS
✘ Hypothesis Testing
✘ Analysis of Variance
7
Measures of Central
Tendency:
Mean, median, mode
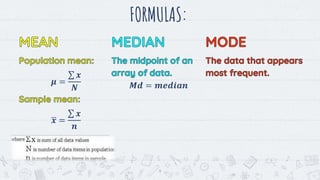
FORMULAS:
𝝁 =
𝒙
𝑵
𝒙 =
𝒙
𝒏
9
𝑴𝒅 = 𝒎𝒆𝒅𝒊𝒂𝒏
Measures of Variations:
range, variance,
standard deviation
FORMULAS:
𝑹 = 𝑯𝒊𝒈𝒉𝒆𝒔𝒕 𝒔𝒄𝒐𝒓𝒆 − 𝑳𝒐𝒘𝒆𝒔𝒕 𝒔𝒄𝒐𝒓𝒆
11
𝝈 = 𝜎𝑁
2
𝒔 = 𝑠𝑁−1
2
Hypothesis Testing:
Six steps
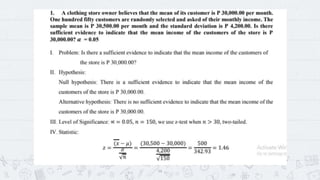
6 Steps in Hypothesis Testing
13
✘ Identify the Problem
✘ Formulate Null and Alternative Hypothesis
✘ Level of Significance
✘ Statistics
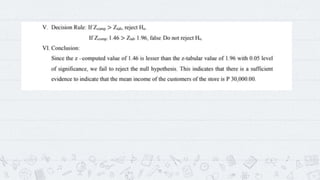
✘ Decision Rule
✘ Conclusion
14
15
DESCRIPTIVE
STATISTICS
Uses charts,
graphs, and
table.
Differences Based on form of final result
INFERENTIAL
STATISTICS
Uses probability.
16
Sampling Technique:
SLOVIN’S FORMULA
SLOVIN’S FORMULA
18
✘ If the population is very large, this formula will be used:
𝒏 =
𝑵
𝟏 + 𝑵𝒆𝟐
Where 𝑛 = sample size
𝑁 = number os cases
𝑒 = margin of error
Example: Using SLOVIN’S FORMULA
19
✘ A researcher wants to know the average income of the
families living in Barangay A which has 2,500 residents.
Calculate the sample size the researcher will need if a 5%
margin of error is allowed.
𝒏 =
𝟐, 𝟓𝟎𝟎
𝟏 + 𝟐, 𝟓𝟎𝟎 𝟎. 𝟎𝟓 𝟐 = 𝟑𝟒𝟒. 𝟖 ≈ 𝟑𝟒𝟓 𝒇𝒂𝒎𝒊𝒍𝒊𝒆𝒔
Where 𝑛 = sample size
𝑁 = 2,500
𝑒 = 0.05
20
THANKS!