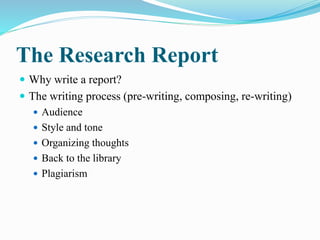
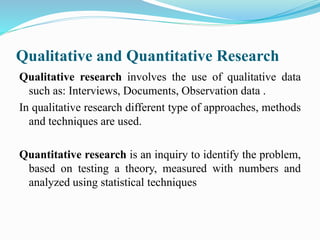
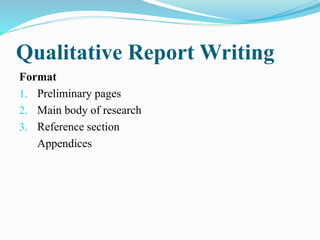
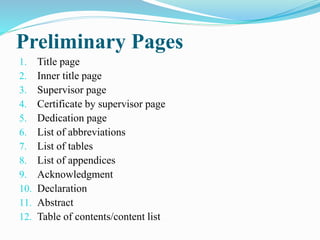
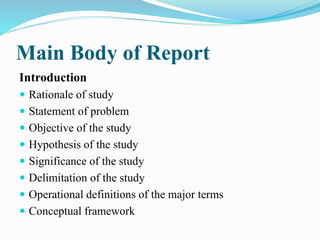
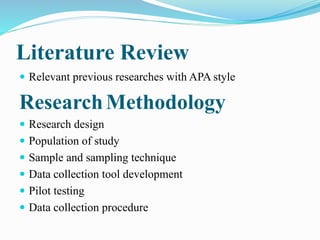
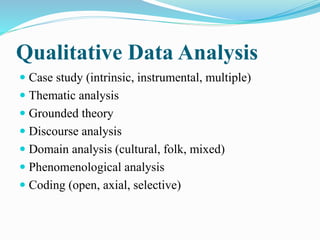
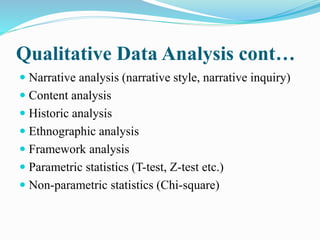
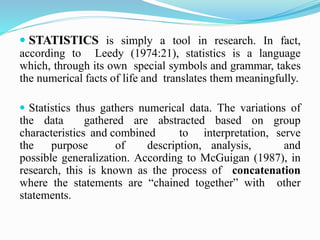
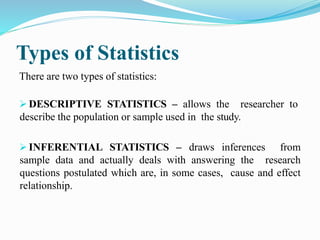
Analysis of data is a process of inspecting, cleaning, transforming, and modeling data with the goal of discovering useful information, suggesting conclusions, and supporting decision-making.
In any single written message, one can count letters, words or sentences. One can categories phrases, describe the logical structure of expressions, ascertain associations, connotations, denotations, elocutionary forces, and one can also offer psychiatric, sociological, or political interpretations. All of these may be simultaneously valid. In short a message may convey a multitude of contents even to a single receiver.
UNIVARIATE & BIVARIATE ANALYSIS
UNIVARIATE BIVARIATE & MULTIVARIATE
UNIVARIATE ANALYSIS
-One variable analysed at a time
BIVARIATE ANALYSIS
-Two variable analysed at a time
MULTIVARIATE ANALYSIS
-More than two variables analysed at a time
TYPES OF ANALYSIS
DESCRIPTIVE ANALYSIS
INFERENTIAL ANALYSIS
DESCRIPTIVE ANALYSIS
Transformation of raw data
Facilitate easy understanding and interpretation
Deals with summary measures relating to sample data
Eg-what is the average age of the sample?
INFERENTIAL ANALYSIS
Carried out after descriptive analysis
Inferences drawn on population parameters based on sample results
Generalizes results to the population based on sample results
Eg-is the average age of population different from 35?
DESCRIPTIVE ANALYSIS OF UNIVARIATE DATA
1. Prepare frequency distribution of each variable
Missing Data
Situation where certain questions are left unanswered
Analysis of multiple responses
Measures of central tendency
3 measures of central tendency
1.Mean
2.Median
3.Mode
MEAN
Arithmetic average of a variable
Appropriate for interval and ratio scale data
x
MEDIAN
Calculates the middle value of the data
Computed for ratio, interval or ordinal scale.
Data needs to be arranged in ascending or descending order
MODE
Point of maximum frequency
Should not be computed for ordinal or interval data unless grouped.
Widely used in business
MEASURE OF DISPERSION
Measures of central tendency do not explain distribution of variables
4 measures of dispersion
1.Range
2.Variance and standard deviation
3.Coefficient of variation
4.Relative and absolute frequencies
DESCRIPTIVE ANALYSIS OF BIVARIATE DATA
There are three types of measure used.
1.Cross tabulation
2.Spearmans rank correlation coefficient
3.Pearsons linear correlation coefficient
Cross Tabulation
Responses of two questions are combined
Spearman’s rank order correlation coefficient.
Used in case of ordinal data
Get your quality homework help now and stand out.Our professional writers are committed to excellence. We have trained the best scholars in different fields of study.Contact us now at http://www.essaysexperts.net/ and place your order at affordable price done within set deadlines.We always have someone online ready to answer all your queries and take your requests.
ICT Stands for Information and Communication
Technology.
CT are basically information handling tools-a
varied set of equipment, applications and
services that are used to produce, store,
process, distribute and exchange information.
How to Create Map Views in the Odoo 17 ERPCeline George
The map views are useful for providing a geographical representation of data. They allow users to visualize and analyze the data in a more intuitive manner.
Synthetic Fiber Construction in lab .pptxPavel ( NSTU)
Synthetic fiber production is a fascinating and complex field that blends chemistry, engineering, and environmental science. By understanding these aspects, students can gain a comprehensive view of synthetic fiber production, its impact on society and the environment, and the potential for future innovations. Synthetic fibers play a crucial role in modern society, impacting various aspects of daily life, industry, and the environment. ynthetic fibers are integral to modern life, offering a range of benefits from cost-effectiveness and versatility to innovative applications and performance characteristics. While they pose environmental challenges, ongoing research and development aim to create more sustainable and eco-friendly alternatives. Understanding the importance of synthetic fibers helps in appreciating their role in the economy, industry, and daily life, while also emphasizing the need for sustainable practices and innovation.
The Roman Empire A Historical Colossus.pdfkaushalkr1407
The Roman Empire, a vast and enduring power, stands as one of history's most remarkable civilizations, leaving an indelible imprint on the world. It emerged from the Roman Republic, transitioning into an imperial powerhouse under the leadership of Augustus Caesar in 27 BCE. This transformation marked the beginning of an era defined by unprecedented territorial expansion, architectural marvels, and profound cultural influence.
The empire's roots lie in the city of Rome, founded, according to legend, by Romulus in 753 BCE. Over centuries, Rome evolved from a small settlement to a formidable republic, characterized by a complex political system with elected officials and checks on power. However, internal strife, class conflicts, and military ambitions paved the way for the end of the Republic. Julius Caesar’s dictatorship and subsequent assassination in 44 BCE created a power vacuum, leading to a civil war. Octavian, later Augustus, emerged victorious, heralding the Roman Empire’s birth.
Under Augustus, the empire experienced the Pax Romana, a 200-year period of relative peace and stability. Augustus reformed the military, established efficient administrative systems, and initiated grand construction projects. The empire's borders expanded, encompassing territories from Britain to Egypt and from Spain to the Euphrates. Roman legions, renowned for their discipline and engineering prowess, secured and maintained these vast territories, building roads, fortifications, and cities that facilitated control and integration.
The Roman Empire’s society was hierarchical, with a rigid class system. At the top were the patricians, wealthy elites who held significant political power. Below them were the plebeians, free citizens with limited political influence, and the vast numbers of slaves who formed the backbone of the economy. The family unit was central, governed by the paterfamilias, the male head who held absolute authority.
Culturally, the Romans were eclectic, absorbing and adapting elements from the civilizations they encountered, particularly the Greeks. Roman art, literature, and philosophy reflected this synthesis, creating a rich cultural tapestry. Latin, the Roman language, became the lingua franca of the Western world, influencing numerous modern languages.
Roman architecture and engineering achievements were monumental. They perfected the arch, vault, and dome, constructing enduring structures like the Colosseum, Pantheon, and aqueducts. These engineering marvels not only showcased Roman ingenuity but also served practical purposes, from public entertainment to water supply.
How to Make a Field invisible in Odoo 17Celine George
It is possible to hide or invisible some fields in odoo. Commonly using “invisible” attribute in the field definition to invisible the fields. This slide will show how to make a field invisible in odoo 17.
Operation “Blue Star” is the only event in the history of Independent India where the state went into war with its own people. Even after about 40 years it is not clear if it was culmination of states anger over people of the region, a political game of power or start of dictatorial chapter in the democratic setup.
The people of Punjab felt alienated from main stream due to denial of their just demands during a long democratic struggle since independence. As it happen all over the word, it led to militant struggle with great loss of lives of military, police and civilian personnel. Killing of Indira Gandhi and massacre of innocent Sikhs in Delhi and other India cities was also associated with this movement.
Model Attribute Check Company Auto PropertyCeline George
In Odoo, the multi-company feature allows you to manage multiple companies within a single Odoo database instance. Each company can have its own configurations while still sharing common resources such as products, customers, and suppliers.
The Indian economy is classified into different sectors to simplify the analysis and understanding of economic activities. For Class 10, it's essential to grasp the sectors of the Indian economy, understand their characteristics, and recognize their importance. This guide will provide detailed notes on the Sectors of the Indian Economy Class 10, using specific long-tail keywords to enhance comprehension.
For more information, visit-www.vavaclasses.com
How to Split Bills in the Odoo 17 POS ModuleCeline George
Bills have a main role in point of sale procedure. It will help to track sales, handling payments and giving receipts to customers. Bill splitting also has an important role in POS. For example, If some friends come together for dinner and if they want to divide the bill then it is possible by POS bill splitting. This slide will show how to split bills in odoo 17 POS.
Read| The latest issue of The Challenger is here! We are thrilled to announce that our school paper has qualified for the NATIONAL SCHOOLS PRESS CONFERENCE (NSPC) 2024. Thank you for your unwavering support and trust. Dive into the stories that made us stand out!
1. Presented by : TAHIRA RAFIQ
Reg. # 161-FSS/PHDEDU/F19
Presented to : Dr. SHAMSAAZIZ
2. The Research Report
Why write a report?
The writing process (pre-writing, composing, re-writing)
Audience
Style and tone
Organizing thoughts
Back to the library
Plagiarism
3. Qualitative and Quantitative Research
Qualitative research involves the use of qualitative data
such as: Interviews, Documents, Observation data .
In qualitative research different type of approaches, methods
and techniques are used.
Quantitative research is an inquiry to identify the problem,
based on testing a theory, measured with numbers and
analyzed using statistical techniques
5. Preliminary Pages
1. Title page
2. Inner title page
3. Supervisor page
4. Certificate by supervisor page
5. Dedication page
6. List of abbreviations
7. List of tables
8. List of appendices
9. Acknowledgment
10. Declaration
11. Abstract
12. Table of contents/content list
6. Main Body of Report
Introduction
Rationale of study
Statement of problem
Objective of the study
Hypothesis of the study
Significance of the study
Delimitation of the study
Operational definitions of the major terms
Conceptual framework
7. Literature Review
Relevant previous researches with APA style
ResearchMethodology
Research design
Population of study
Sample and sampling technique
Data collection tool development
Pilot testing
Data collection procedure
8. Data analysis and interpretation
ANALYSIS means the ordering, manipulating, and
summarizing of data to obtain answers to research questions.
Its purpose is to reduce data to intelligible and interpretable
form so that the relations of research problems can be
studied and tested.
INTERPRETATION gives the results of analysis, makes
inferences pertinent to the research relations studied, and
draws conclusions about these relations.
9. Data Analysis
In general terms it is the description of the strategies
which a researcher used for data analysis. Researcher will
specify the data will be analyzed by manually or by
computer. For computer analysis, identify the program and
the statistical procedures to perform for the data and also
identify the main variables for cross tabulation.
10. STEPS IN DATA PROCESSING
STEPS IN QUANTITATIVE STUDIES
Developing a code book
Pre-testing the code book Developing a Frame of Analysis
Coding the data
Verifying the coded data Computer Manual
1. SPSS x
2. SAS
Raw
data Editing Coding Analysis
11. STEPS IN QUALITATIVE STUDIES
Interviews Developing themes Content analysis
Questionnaires
Observations
In-depth/focus group interviews Computer Analysis: Manual
Secondary sources Thematic
Ethnograph Analysis
Raw
data
Editing Coding Analysis
12. Qualitative Data Analysis
Case study (intrinsic, instrumental, multiple)
Thematic analysis
Grounded theory
Discourse analysis
Domain analysis (cultural, folk, mixed)
Phenomenological analysis
Coding (open, axial, selective)
14. STATISTICS is simply a tool in research. In fact,
according to Leedy (1974:21), statistics is a language
which, through its own special symbols and grammar, takes
the numerical facts of life and translates them meaningfully.
Statistics thus gathers numerical data. The variations of
the data gathered are abstracted based on group
characteristics and combined to interpretation, serve
the purpose of description, analysis, and
possible generalization. According to McGuigan (1987), in
research, this is known as the process of concatenation
where the statements are “chained together” with other
statements.
15. Types of Statistics
There are two types of statistics:
DESCRIPTIVE STATISTICS – allows the researcher to
describe the population or sample used in the study.
INFERENTIAL STATISTICS – draws inferences from
sample data and actually deals with answering the research
questions postulated which are, in some cases, cause and effect
relationship.
16. DESCRIPTIVE STATISTICS
Descriptive statistics describes the characteristics of the
population or the sample. To make them meaningful,
they are grouped according to the following measures:
Measures of Central Tendency orAverages
Measures of Dispersion or Variability
Measures of Non-central Location
Measures of Symmetry and/orAsymmetry
Measures of Peakedness or Flatness
17. Measures of Central Tendency or Averages
These include the mean, mode and the median.
The mean is a measure obtained by adding all the values
in a population or sample and dividing by the number of
values that are added (Daniel, 1991:19-20).
The mode is simply the most frequent score of scores
(Blalock, 1972:72).
The median is the value above and below which one half
of the observations fall (Norusis, (1984:B- 63)
18. Measures of Dispersion or Variability.
These include
deviation, and
the variance, standard
the range. According to
Daniel (1991:24), a measure of dispersion
conveys information regarding the amount
of variability present in a set of idea.
19. The VARIANCE is a measure of the dispersion of the set of scores.
It tells us how much the scores are spread out. Thus, the variance is a
measure of the spread of the scores; it describes the extent to which
the scores differ from each other about their mean.
STANDARD DEVIATION thus refers to the deviation of scores
from the mean. Where ordinal measures of 1-5 scales (low-high)
are used, data most likely have standard deviations of less than
one unless, the responses are extremes (i.e., all ones and all
fives).
The RANGE is defined as the difference between the highest and
lowest scores (Blalock, 1972:77)
20. Measures of Non-CentralLocation
These include the quantiles (i.e. percentiles, deciles, quartiles).
The word percent means “per hundred”. Therefore, in
using percentages, size is standardized by calculating the
number of individuals who would be in a given category
if the total number of cases were 100 and if the proportion
in each category remains unchanged. Since proportions
must add to unity, it is obvious that percentages will sum
up to 100 unless the categories are not mutually exclusive
or exhaustive (Blalock, 1972:33)
21. Measures of Symmetry and/or Asymmetry
These include the skewness of the frequency
distribution. If a distribution is asymmetrical and the
larger frequencies tend to be concentrated toward the low
end of the variable and the smaller frequencies toward the
high end, it is said to be positively skewed. If the
opposite holds, the larger frequencies being concentrated
toward the high end of the variable and the smaller
frequencies toward the low end, the distribution is said to
be negatively skewed (Ferguson and Takane, 1989:30).
22. Measures of Peakedness or Flatness
Measures of Peakedness or Flatness of one
distribution in relation to another is referred to as
Kurtosis. If one distribution is more peaked than
another, it may be spoken of as more leptokurtic. If it
is less peaked, it is said to be more platykurtic.
23. NON-PARAMETRIC TESTS
Two types of data are recognized in the application of statistical
treatments, these are: parametric data and non-parametric
data.
Parametric data are measured data and parametric statistical
tests assume that the data are normally, or nearly normally,
distributed (Best and Kahn, 1998:338).
Non-parametric data are distribution free samples which
implies that they are free, of independent of the population
distribution (Ferguson and Takane, 1989:431).
The tests on these data do not rest on the more stringent
assumption of normally distributed population (Best and Kahn,
1998:338).
24. Kolmogorov – Smirnov test - fulfills the function of chi-
square in testing goodness of fit and of the Wilcoxon rank sum
test in determining whether random samples are from the same
population.
Sign Test - is important in determining the significance of
differences between two correlated samples. The “signs” of the
test are the algebraic plus or minus values of the difference of the
paired scores.
Median Test - is a sign test for two independent samples in
contradistinction to two correlated samples, as is the case with
the sign test.
Spearman rank order correlation - sometimes called
Spearman rho (p) or Spearman’s rank difference correlation, is a
nonparametric statistic that has its counterpart in parametric
calculations in the Pearson product moment correlation.
25. The Non-Parametric Tests Available
are:
Two types of data are recognized in the application of statistical
treatments, these are: parametric data and nonparametric data.
Parametric data are measured data and parametric statistical
tests assume that the data are normally, or nearly normally,
distributed (Best and Kahn, 1998:338). Nonparametric data are
distribution free samples which implies that they are free, of
independent of the population distribution (Ferguson and
Takane, 1989:431). The tests on these data do not rest on the
more stringent assumption of normally distributed population
(Best and Kahn, 1998:338).
26. APPROPRIATE STATISTICAL METHODS BASED
ON THE RESEARCH PROBLEM AND LEVELS OF
MEASUREMENT
The statistical methods appropriate to any studies are always
determined by the research problem and the measurement scale
of the variables used in the study.
CHI – SQUARE
The most commonly used nonparametric test. It is
employed in instances where a comparison between observed
and theoretical frequencies is present, or in testing the
mathematical fit of a frequency curve to an observed frequency
distribution.
27. Tests
provides the capability of computing student’s t and probability
levels for testing whether or not the difference between two
samples means is significant (Nie, et al., 1975:267). This type of
analysis is the comparison of two groups of subjects, with the
group means as the basis for comparison.
Two types of T-tests may be performed:
Independent Samples - cases are classified into 2 groups and a
test of mean differences is performed for specified variables;
Paired Samples – for paired observations arrange casewise, a
test of treatment effects is performed.
28. What is Coding
People are constantly talking about it, but what is it?
Code and Instructions
In the most simplified terms, coding is the act of writing
instructions that computers can understand.
Having cleaned the data, the next step is to code it.
Coding is the process of naming or labeling things,
categories, and properties.
29. Types of Coding
1. Open Coding:
a first coding of qualitative data in which a researcher
examines the data to condense them into preliminary
analytical categorize or codes
2. Axial Coding:
A second stage of coding of qualitative data in which a
researcher organizes the codes, links them and discovers key
analytical categories
3. Selective Coding:
A late stage in coding qualitative data in which a
researcher examines previous codes to identify and select data
that will support the conceptual coding categorize that were
developed
30. The Method of Coding
1. The way a variable has been measure (measurement scale) in
your research instrument (if a response to a question is
descriptive, categorical or quantitative)
2. The way you want to communicate the findings about a
variable to your readers
All responses can be classified into the following three
categories:
Quantitative responses
Categorical responses
Descriptive responses-transforming into numerical values
called codes
31. Coding Quantitative/Categorical
(Qualitative and Quantitative) data
For coding quantitative/categorical (qualitative and
quantitative) data you need to go through the following
steps:
Developing a code book
Pre-testing code book
Coding the data
Verifying the coded data
32. Thematic Analysis
Thematic analysis is the most common form of analysis in
qualitative research
It emphasizes pinpointing, examining, and recording patterns
(themes) within data
Themes are patterns across data sets that are important to the
description of a phenomenon and are associated to a specific
research question
The themes become the categories for analysis
Thematic analysis is performed through the process of coding
in six phases to create established, meaningful patterns. These
phases are: familiarization with data, generating initial codes,
searching for themes among codes, reviewing themes, defining
and naming themes, and producing the final report.
33. Doing Thematic Analysis
Reading and re-reading material until researcher is comfortable is crucial to
the initial phase of analysis. While becoming familiar with material, note-
taking is a crucial part of this step in order begin developing potential codes.
The second step in thematic analysis is generating an initial list of items
from data set that have a reoccurring pattern. This systematic way of
organizing and gaining meaningful parts of data as it relates to research
question is called coding. The coding process evolves through an inductive
analysis and is not considered to be linear process, but a cyclical process in
which codes emerge throughout the research process. This cyclical process
involves going back and forth between phases of data analysis as needed
until you are satisfied with final themes. The coding process is rarely
completed the first time. Each time, researchers should strive to refine codes
by adding, subtracting, combining or splitting potential codes.
34. In this phase, it is important to begin by examining how
codes combine to form themes in the data. Researchers
begin considering how relationships are formed between
codes and themes and between different levels of existing
themes. Themes differ from codes in that themes are
phrases or sentences that identifies what the data means.
They describe an outcome of coding for analytic
reflection. Themes consist of ideas and descriptions within
a culture that can be used to explain causal events,
statements, and morals derived from the participants'
stories.
After finalizing the themes to be discussed, researcher
should name and define themes.
35. Discourse Analysis
What is discourse?
Discourse can be defined in three ways:
1. Language beyond the level of a sentence
2. Language behaviors linked to social practices
3. Language as a system of thought.
Discourse analysis is usually defined as the analysis of
language 'beyond the sentence'. And the analysis of discourse
is typically concerned with the study of language in text and
conversation Written by MaCarthy et al. in An Introduction
to Applied Linguistics. Schmitt, N. 2012
36. Basic ideas in Discourse analysis
Text analysis ( writing) structure of a discourse speech
events
Conversation analysis (speaking) Turn-taking The
cooperative principle Background knowledge
Basics of Text Analysis
Cohesion
Coherence
Speech events
37. Cohesion, Coherence and Speech
Events
Cohesion is the grammatical and/or lexical relationships
between the different elements of a text.
Coherence is the relationships which link the meanings of
utterances in a discourse or of the sentences in a text.
Cohesion and coherence :
Cohesion helps to create coherence
Cohesion does not entail coherence
Coherence can be made with/out cohesive ties/ devises
Speech event includes interactions such as a conversation at a
party or ordering a meal. Any speech event comprises several
components. debate, lecture, interview, game, daily routine,
etc.
38. Domain Analysis
A method of qualitative data analysis in which a
researcher describes the structure of a cultural domain. It
is a comprehensive approach for qualitative data
1. Cultural domain (a cultural setting in which people
regularly interact and develop a set shared
understandings or “mini culture” that can be analyzed)
2. Folk domain (a cultural domain based on the categorize
used by the people being studied in the field site)
3. Mix domain ( a cultural domain that combine the
categories of members under study with categories
developed by a researcher for analysis
39. Domain Model
Represents meaningful conceptual classes in a problem
domain.
Represents real-world concepts (the problem), not
software components (the solution).
May be shared by different projects.
40. Narrative Analysis
Both a type of historical writing that tells a story and a
type of qualitative data analysis that presents a
chronologically linked chain of events’ in which
individual or collective social actors have an important
role
Narrative inquiry is method of investigation of data
collection about the people ordinary lived experiences
Narrative style it is sometimes called story telling
(Berger and Quency, 2004)
41. Tools of Narrative Analysis
Path dependency refers to how a unique beginning can
trigger a sequence of events and create a deterministic
path that is followed in the chain of subsequent events.
Types of path dependency
Two types of path dependency
Self reinforcing (explanation looks at how, one’s set into
motion, events continue to operate on their own, events
in a direction that resist external factors)
Reactive sequence (focus on how each event respond to
an pre-coding 1
42. Periodization
Dividing the flow of time in social reality into segments or
periods. A field researcher might discover parts or periods
in an ongoing process (e.g. typical day, yearly cycle)
Historical Contingency
Analytical idea in narrative analysis that explain a process,
event or situation by referring to the specific combination
of the factors that came together in a particular time and
place
43. GROUNDED THEORY
DESIGNS IN QUALITATIVE
ANALYSIS
‘‘Grounded Theory is the study of a concept! It is not a
descriptive study of a descriptive problem’’ (Glaser,
2010). ‘‘Most grounded theorists believe they are
theorizing about how the world *is* rather than how
respondents see it’’ (Steve Borgatti).
44. A grounded theory design is a systematic, qualitative
procedure used to generate a theory that explains, at a
broad conceptual level, a process, an action, or an
interaction about a substantive topic (Creswell, 2008). The
phrase "grounded theory" refers to theory that is
developed inductively from a corpus of data. ‘‘Grounded
Theory is the most common, widely used, and popular
analytic technique in qualitative analysis’’ (the evidence
is: the number of book published on it) (Gibbs, 2010). • It
is mainly used for qualitative research, but is also
applicable to other data (e.g., quantitative data; Glaser,
1967, chapter VIII).
45. When do you use Grounded
Theory?
When you need a broad theory or explanation of a
process.
Especially helpful when current theories about a
phenomenon are either inadequate or nonexistent
(Creswell, 2008).
When you wish to study some process, such as how
students develop as writers (Neff, 1998) or how high-
achieving African American and Caucasian women’s
career develop.
46. Methods
The basic idea of the grounded theory approach is to read a
textual database and "discover" or label variables (called
categories, concepts and properties) and their
interrelationships. The data do not have to be literally
textual they could be observations of behavior, such as
interactions and events in a restaurant. Often they are in
the form of field notes, which are like diary entries.
Data Collection
Interviews
Observations
Documents
Historical Records
Video tapes
47. CORRELATIONANALYSIS
Correlation is used when one is interested to know the
relationship between two or more paired variables.
According to Blalock (1972:361), this is where
interest is focused primarily on the exploratory task
of finding out which variables are related to a given
variable.