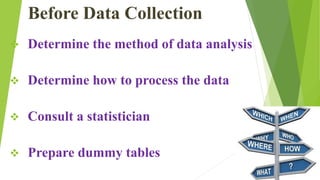
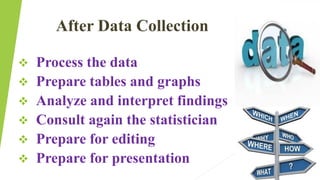
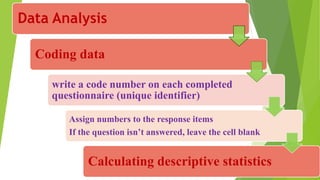
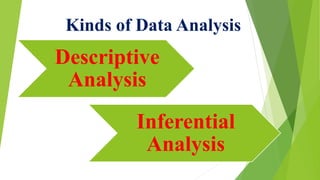
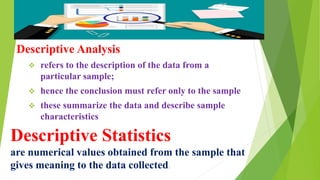
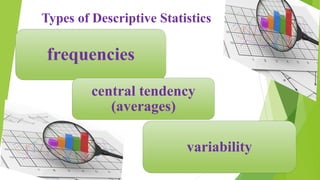
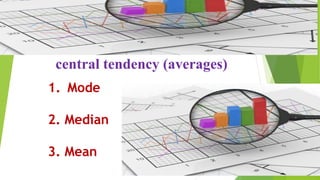
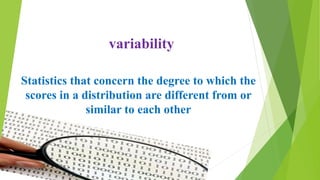
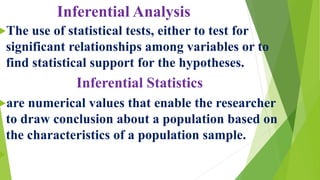
SlideShare a Scribd company logo
Data Analysis
Zeynab Moosavi
Be very accurate and careful
when working with the data
Check
Double-check
Triple check
Quadruple check
Data Analysis
The purpose
a) To answer the research
questions
b) to help determine
relationships among the
variables.
Steps in Data Analysis
Before Data
Collection
After Data
Collection
Before Data Collection
 Determine the method of data analysis
 Determine how to process the data
 Consult a statistician
 Prepare dummy tables
 Process the data
 Prepare tables and graphs
 Analyze and interpret findings
 Consult again the statistician
 Prepare for editing
 Prepare for presentation
After Data Collection
Data Analysis
Coding data
write a code number on each completed
questionnaire (unique identifier)
Assign numbers to the response items
If the question isn’t answered, leave the cell blank
Calculating descriptive statistics
Blank Excel Worksheet
Create a data base title
https://www.wcasa.org/file_open.php?id=951
Missing Data
 Participants do not answer certain items on a
questionnaire
 it is not clear what the correct answer is
 not be able to read the answer
 they might have circled two responses
 in pre- & post-test experiments, participants
complete one phase of the study, such as the pre-
test, but are absent for the second phase
The items are reverse coded.
Refers to the items that actually say the opposite
of what was intended.
For example,
"I enjoy going to school” Strongly
Disagreeing
the other item is "I dislike school Strongly
agreeing
Reverse Coded Items
Kinds of Data Analysis
Descriptive
Analysis
Inferential
Analysis
Descriptive Statistics
are numerical values obtained from the sample that
gives meaning to the data collected.
Descriptive Analysis
 refers to the description of the data from a
particular sample;
 hence the conclusion must refer only to the sample
 these summarize the data and describe sample
characteristics
frequencies
central tendency
(averages)
variability
Types of Descriptive Statistics
Frequency
the number of participants who
indicated that category
central tendency (averages)
1. Mode
2. Median
3. Mean
variability
Statistics that concern the degree to which the
scores in a distribution are different from or
similar to each other
Inferential Analysis
The use of statistical tests, either to test for
significant relationships among variables or to
find statistical support for the hypotheses.
Inferential Statistics
are numerical values that enable the researcher
to draw conclusion about a population based on
the characteristics of a population sample.

the researcher draws conclusions - or
inferences - about the entire
population based on the results from
the sample.
The purpose is
to determine whether the
findings from the sample can
generalize - or be applied - to the
entire population
Inferential statistics is used to determine
whether the difference between the two
groups in the sample is large enough to be able
to say that the findings are significant.
If the findings are indeed significant, then
the conclusions can be applied, or generalized,
to the entire population. On the other hand, if
the difference between the groups is very
small, then the findings are not significant and
therefore were simply in the result of chance.
This p-value is
the probability that the result is due to chance.
The p-value can range from 0.000 to 1.000. The
larger p is, the more likely the results are due to
chance.
If p is 0.50, the probability that the result is due to
chance is 5 out of 10.
A p of 0.850 means that the probability that the
result is due to chance is 85 out of 100
The standard in research is that the p
must be is less than 0.05 for the results to
be significant.
if the calculated p-value is less than
0.050, then the null hypothesis is
rejected. If the statement "There is no
significant difference" is rejected, this
means that there is a significant
difference. It can therefore be concluded
that a difference exists between the two
groups in the population, not just the
sample.
P-value
p<0.05
Null
hypothesis is
rejected
p>0.05
Null
hypothesis is
retained
Create Tables and Figures
 Every table must be discussed in the text.
 Refer to tables by the table numbers only, not where
they appear in reference to the text.
This is acceptable: "As can be seen in Table 3..."
This is not acceptable: "The table above shows..."
The rationale for this rule is that the placement of the
table may change when the final document is produced.
 Readers should be able to interpret a table just by
looking at the table, without reading the body of the
research report itself. Therefore, each table should
have a clear title that focuses on the key statistics
within that table and all acronyms and abbreviations
should be explained in the table notes.
Rules
 Table titles should be brief, but clearly explain the
table.
 All similar entries in the table should carry the
same number of decimal points
 Every entry within the same column should have
the same number of decimal places.
P-values & correlations should be rounded to three
decimal places (thousandths place value)
All other numbers (means, standard deviations, t-
values, F-values) should carry two decimal places
(hundredths place value).
If you are not the original author of the table, you
must cite the source of the table in a note at the
bottom.
Once the tables have been placed in the text,
number the tables starting from 1 in the order
that they appear in the work.
The decimal points must be lined up in each of
the columns. This makes the table easier to
read.
Tables typically have a horizontal rule at the
top, bottom, and after the table labels. Vertical
lines are rarely used according to APA
regulations
Figures
• Graphs effectively illustrate means, frequencies, and
percentages
• figures should also be fully understandable without
reading the text, but also be referenced in the text
• Figures should also be numbered consecutively
• Notes should be included so the reader can easily
interpret the figure
• Figures do not have titles
• A caption or legend at the bottom of the figure
functions both as a title and an explanation of the
The Results section should be
structured around:
• the demographics of the participants
• reviewing the purpose of the study
• answer each Research Question one by one
• Explain the statistic used to answer the Research questions
• Explain the measurement of each variable
• Present the statistics in a Table or Figure
• Interpret the statistics.
Errors in reporting of the Results:
A lack of clear reporting:
Numbers are reported in a table, but it is unclear
how the numbers were calculated based on the
items from the questionnaire
The statistics are not thoroughly explained:
Research hypotheses particularly need a detailed
explanation to interpret the key findings.
To repeat all statistics from the Table/Figure
in the body of the text.

More Related Content

What's hot

Quantitative analysis
Quantitative analysisQuantitative analysis
Quantitative analysis
Rajesh Mishra
 
Introduction to Descriptive Statistics
Introduction to Descriptive StatisticsIntroduction to Descriptive Statistics
Introduction to Descriptive Statistics
Sanju Rusara Seneviratne
 
Data Analysis, Presentation and Interpretation of Data
Data Analysis, Presentation and Interpretation of DataData Analysis, Presentation and Interpretation of Data
Data Analysis, Presentation and Interpretation of Data
Roqui Malijan
 
Statistical Data Analysis | Data Analysis | Statistics Services | Data Collec...
Statistical Data Analysis | Data Analysis | Statistics Services | Data Collec...Statistical Data Analysis | Data Analysis | Statistics Services | Data Collec...
Statistical Data Analysis | Data Analysis | Statistics Services | Data Collec...
Stats Statswork
 
Descriptive statistics
Descriptive statisticsDescriptive statistics
Descriptive statistics
Dr Resu Neha Reddy
 
Data Analysis and Statistics
Data Analysis and StatisticsData Analysis and Statistics
Data Analysis and Statistics
T.S. Lim
 
Descriptive statistics
Descriptive statisticsDescriptive statistics
Descriptive statistics
Anand Thokal
 
Data analysis and Presentation
Data analysis and PresentationData analysis and Presentation
Data analysis and Presentation
Jignesh Kariya
 
Basic Descriptive Statistics
Basic Descriptive StatisticsBasic Descriptive Statistics
Basic Descriptive Statistics
sikojp
 
Ppt for 1.1 introduction to statistical inference
Ppt for 1.1 introduction to statistical inferencePpt for 1.1 introduction to statistical inference
Ppt for 1.1 introduction to statistical inference
vasu Chemistry
 
Data presentation/ How to present Research outcome data
Data presentation/ How to present Research outcome dataData presentation/ How to present Research outcome data
Data presentation/ How to present Research outcome data
Dr-Jitendra Patel
 
Descriptive Statistics
Descriptive StatisticsDescriptive Statistics
Descriptive Statistics
Neny Isharyanti
 
Introduction to Statistics - Basic concepts
Introduction to Statistics - Basic conceptsIntroduction to Statistics - Basic concepts
Introduction to Statistics - Basic concepts
DocIbrahimAbdelmonaem
 
Data analysis
Data analysisData analysis
Data analysis
Mira K Desai
 
Statistical analysis and interpretation
Statistical analysis and interpretationStatistical analysis and interpretation
Statistical analysis and interpretation
Dave Marcial
 
Data analysis
Data analysisData analysis
Data analysis
amlbinder
 
Descriptive statistics -review(2)
Descriptive statistics -review(2)Descriptive statistics -review(2)
Descriptive statistics -review(2)
Hanimarcelo slideshare
 
Descriptive statistics
Descriptive statisticsDescriptive statistics
Descriptive statistics
Attaullah Khan
 
Data analysis
Data analysisData analysis
Data analysis
Yusuf Khan
 
Data Analysis
Data AnalysisData Analysis
Data Analysis
sikander kushwaha
 

What's hot (20)

Quantitative analysis
Quantitative analysisQuantitative analysis
Quantitative analysis
 
Introduction to Descriptive Statistics
Introduction to Descriptive StatisticsIntroduction to Descriptive Statistics
Introduction to Descriptive Statistics
 
Data Analysis, Presentation and Interpretation of Data
Data Analysis, Presentation and Interpretation of DataData Analysis, Presentation and Interpretation of Data
Data Analysis, Presentation and Interpretation of Data
 
Statistical Data Analysis | Data Analysis | Statistics Services | Data Collec...
Statistical Data Analysis | Data Analysis | Statistics Services | Data Collec...Statistical Data Analysis | Data Analysis | Statistics Services | Data Collec...
Statistical Data Analysis | Data Analysis | Statistics Services | Data Collec...
 
Descriptive statistics
Descriptive statisticsDescriptive statistics
Descriptive statistics
 
Data Analysis and Statistics
Data Analysis and StatisticsData Analysis and Statistics
Data Analysis and Statistics
 
Descriptive statistics
Descriptive statisticsDescriptive statistics
Descriptive statistics
 
Data analysis and Presentation
Data analysis and PresentationData analysis and Presentation
Data analysis and Presentation
 
Basic Descriptive Statistics
Basic Descriptive StatisticsBasic Descriptive Statistics
Basic Descriptive Statistics
 
Ppt for 1.1 introduction to statistical inference
Ppt for 1.1 introduction to statistical inferencePpt for 1.1 introduction to statistical inference
Ppt for 1.1 introduction to statistical inference
 
Data presentation/ How to present Research outcome data
Data presentation/ How to present Research outcome dataData presentation/ How to present Research outcome data
Data presentation/ How to present Research outcome data
 
Descriptive Statistics
Descriptive StatisticsDescriptive Statistics
Descriptive Statistics
 
Introduction to Statistics - Basic concepts
Introduction to Statistics - Basic conceptsIntroduction to Statistics - Basic concepts
Introduction to Statistics - Basic concepts
 
Data analysis
Data analysisData analysis
Data analysis
 
Statistical analysis and interpretation
Statistical analysis and interpretationStatistical analysis and interpretation
Statistical analysis and interpretation
 
Data analysis
Data analysisData analysis
Data analysis
 
Descriptive statistics -review(2)
Descriptive statistics -review(2)Descriptive statistics -review(2)
Descriptive statistics -review(2)
 
Descriptive statistics
Descriptive statisticsDescriptive statistics
Descriptive statistics
 
Data analysis
Data analysisData analysis
Data analysis
 
Data Analysis
Data AnalysisData Analysis
Data Analysis
 

Similar to Data Analysis

results writing.pptx
results writing.pptxresults writing.pptx
results writing.pptx
AbdulRashidAdams
 
Writing the results section for scientific publication
Writing the results section for scientific publicationWriting the results section for scientific publication
Writing the results section for scientific publication
Ashok Pandey
 
writing the results section.pptx
writing the results section.pptxwriting the results section.pptx
writing the results section.pptx
AbdulRashidAdams
 
Chapter 4-Data Analysis in Practical Research 2
Chapter 4-Data Analysis in Practical Research 2Chapter 4-Data Analysis in Practical Research 2
Chapter 4-Data Analysis in Practical Research 2
LarryErbite3
 
Chapter 10-DATA ANALYSIS & PRESENTATION
Chapter 10-DATA ANALYSIS & PRESENTATIONChapter 10-DATA ANALYSIS & PRESENTATION
Chapter 10-DATA ANALYSIS & PRESENTATION
Ludy Mae Nalzaro,BSM,BSN,MN
 
Unit 8 data analysis and interpretation
Unit 8 data analysis and interpretationUnit 8 data analysis and interpretation
Unit 8 data analysis and interpretation
Asima shahzadi
 
EDUCATIONAL STATISTICS_Unit_I.ppt
EDUCATIONAL STATISTICS_Unit_I.pptEDUCATIONAL STATISTICS_Unit_I.ppt
EDUCATIONAL STATISTICS_Unit_I.ppt
Sasi Kumar
 
Biostatistics
BiostatisticsBiostatistics
Biostatistics
Aftab Badshah
 
Unit 4 editing and coding (2)
Unit 4 editing and coding (2)Unit 4 editing and coding (2)
Unit 4 editing and coding (2)
kalailakshmi
 
MELJUN CORTES research designing_research_methodology
MELJUN CORTES research designing_research_methodologyMELJUN CORTES research designing_research_methodology
MELJUN CORTES research designing_research_methodology
MELJUN CORTES
 
Research methodology - Analysis of Data
Research methodology - Analysis of DataResearch methodology - Analysis of Data
Research methodology - Analysis of Data
The Stockker
 
Data analysis &amp; interpretation
Data analysis &amp; interpretationData analysis &amp; interpretation
Data analysis &amp; interpretation
avid
 
Critique
CritiqueCritique
Critique
Jehan Farrag
 
Tabulation of data-Development of Research Instrument/ Tool and Analysis
Tabulation of data-Development of Research Instrument/ Tool and Analysis Tabulation of data-Development of Research Instrument/ Tool and Analysis
Tabulation of data-Development of Research Instrument/ Tool and Analysis
ShaharyarShoukatShou
 
Analysis of data.pptx
Analysis of data.pptxAnalysis of data.pptx
Analysis of data.pptx
Kavitha Krishnan
 
Week8 writing the results
Week8  writing the resultsWeek8  writing the results
Week8 writing the results
Hafizul Mukhlis
 
A seminar on quantitave data analysis
A seminar on quantitave data analysisA seminar on quantitave data analysis
A seminar on quantitave data analysis
Bimel Kottarathil
 
SPSS FINAL.pdf
SPSS FINAL.pdfSPSS FINAL.pdf
SPSS FINAL.pdf
Thanavathi C
 
Presentation_Analysis_and_Interpretation.ppt
Presentation_Analysis_and_Interpretation.pptPresentation_Analysis_and_Interpretation.ppt
Presentation_Analysis_and_Interpretation.ppt
MichaelCion1
 
Data Analysis & Interpretation and Report Writing
Data Analysis & Interpretation and Report WritingData Analysis & Interpretation and Report Writing
Data Analysis & Interpretation and Report Writing
SOMASUNDARAM T
 

Similar to Data Analysis (20)

results writing.pptx
results writing.pptxresults writing.pptx
results writing.pptx
 
Writing the results section for scientific publication
Writing the results section for scientific publicationWriting the results section for scientific publication
Writing the results section for scientific publication
 
writing the results section.pptx
writing the results section.pptxwriting the results section.pptx
writing the results section.pptx
 
Chapter 4-Data Analysis in Practical Research 2
Chapter 4-Data Analysis in Practical Research 2Chapter 4-Data Analysis in Practical Research 2
Chapter 4-Data Analysis in Practical Research 2
 
Chapter 10-DATA ANALYSIS & PRESENTATION
Chapter 10-DATA ANALYSIS & PRESENTATIONChapter 10-DATA ANALYSIS & PRESENTATION
Chapter 10-DATA ANALYSIS & PRESENTATION
 
Unit 8 data analysis and interpretation
Unit 8 data analysis and interpretationUnit 8 data analysis and interpretation
Unit 8 data analysis and interpretation
 
EDUCATIONAL STATISTICS_Unit_I.ppt
EDUCATIONAL STATISTICS_Unit_I.pptEDUCATIONAL STATISTICS_Unit_I.ppt
EDUCATIONAL STATISTICS_Unit_I.ppt
 
Biostatistics
BiostatisticsBiostatistics
Biostatistics
 
Unit 4 editing and coding (2)
Unit 4 editing and coding (2)Unit 4 editing and coding (2)
Unit 4 editing and coding (2)
 
MELJUN CORTES research designing_research_methodology
MELJUN CORTES research designing_research_methodologyMELJUN CORTES research designing_research_methodology
MELJUN CORTES research designing_research_methodology
 
Research methodology - Analysis of Data
Research methodology - Analysis of DataResearch methodology - Analysis of Data
Research methodology - Analysis of Data
 
Data analysis &amp; interpretation
Data analysis &amp; interpretationData analysis &amp; interpretation
Data analysis &amp; interpretation
 
Critique
CritiqueCritique
Critique
 
Tabulation of data-Development of Research Instrument/ Tool and Analysis
Tabulation of data-Development of Research Instrument/ Tool and Analysis Tabulation of data-Development of Research Instrument/ Tool and Analysis
Tabulation of data-Development of Research Instrument/ Tool and Analysis
 
Analysis of data.pptx
Analysis of data.pptxAnalysis of data.pptx
Analysis of data.pptx
 
Week8 writing the results
Week8  writing the resultsWeek8  writing the results
Week8 writing the results
 
A seminar on quantitave data analysis
A seminar on quantitave data analysisA seminar on quantitave data analysis
A seminar on quantitave data analysis
 
SPSS FINAL.pdf
SPSS FINAL.pdfSPSS FINAL.pdf
SPSS FINAL.pdf
 
Presentation_Analysis_and_Interpretation.ppt
Presentation_Analysis_and_Interpretation.pptPresentation_Analysis_and_Interpretation.ppt
Presentation_Analysis_and_Interpretation.ppt
 
Data Analysis & Interpretation and Report Writing
Data Analysis & Interpretation and Report WritingData Analysis & Interpretation and Report Writing
Data Analysis & Interpretation and Report Writing
 

Recently uploaded

Hindi varnamala | hindi alphabet PPT.pdf
Hindi varnamala | hindi alphabet PPT.pdfHindi varnamala | hindi alphabet PPT.pdf
Hindi varnamala | hindi alphabet PPT.pdf
Dr. Mulla Adam Ali
 
Chapter 4 - Islamic Financial Institutions in Malaysia.pptx
Chapter 4 - Islamic Financial Institutions in Malaysia.pptxChapter 4 - Islamic Financial Institutions in Malaysia.pptx
Chapter 4 - Islamic Financial Institutions in Malaysia.pptx
Mohd Adib Abd Muin, Senior Lecturer at Universiti Utara Malaysia
 
How to Add Chatter in the odoo 17 ERP Module
How to Add Chatter in the odoo 17 ERP ModuleHow to Add Chatter in the odoo 17 ERP Module
How to Add Chatter in the odoo 17 ERP Module
Celine George
 
How to Build a Module in Odoo 17 Using the Scaffold Method
How to Build a Module in Odoo 17 Using the Scaffold MethodHow to Build a Module in Odoo 17 Using the Scaffold Method
How to Build a Module in Odoo 17 Using the Scaffold Method
Celine George
 
বাংলাদেশ অর্থনৈতিক সমীক্ষা (Economic Review) ২০২৪ UJS App.pdf
বাংলাদেশ অর্থনৈতিক সমীক্ষা (Economic Review) ২০২৪ UJS App.pdfবাংলাদেশ অর্থনৈতিক সমীক্ষা (Economic Review) ২০২৪ UJS App.pdf
বাংলাদেশ অর্থনৈতিক সমীক্ষা (Economic Review) ২০২৪ UJS App.pdf
eBook.com.bd (প্রয়োজনীয় বাংলা বই)
 
clinical examination of hip joint (1).pdf
clinical examination of hip joint (1).pdfclinical examination of hip joint (1).pdf
clinical examination of hip joint (1).pdf
Priyankaranawat4
 
Walmart Business+ and Spark Good for Nonprofits.pdf
Walmart Business+ and Spark Good for Nonprofits.pdfWalmart Business+ and Spark Good for Nonprofits.pdf
Walmart Business+ and Spark Good for Nonprofits.pdf
TechSoup
 
MARY JANE WILSON, A “BOA MÃE” .
MARY JANE WILSON, A “BOA MÃE”           .MARY JANE WILSON, A “BOA MÃE”           .
MARY JANE WILSON, A “BOA MÃE” .
Colégio Santa Teresinha
 
A Independência da América Espanhola LAPBOOK.pdf
A Independência da América Espanhola LAPBOOK.pdfA Independência da América Espanhola LAPBOOK.pdf
A Independência da América Espanhola LAPBOOK.pdf
Jean Carlos Nunes Paixão
 
How to Create a More Engaging and Human Online Learning Experience
How to Create a More Engaging and Human Online Learning Experience How to Create a More Engaging and Human Online Learning Experience
How to Create a More Engaging and Human Online Learning Experience
Wahiba Chair Training & Consulting
 
Pengantar Penggunaan Flutter - Dart programming language1.pptx
Pengantar Penggunaan Flutter - Dart programming language1.pptxPengantar Penggunaan Flutter - Dart programming language1.pptx
Pengantar Penggunaan Flutter - Dart programming language1.pptx
Fajar Baskoro
 
How to Make a Field Mandatory in Odoo 17
How to Make a Field Mandatory in Odoo 17How to Make a Field Mandatory in Odoo 17
How to Make a Field Mandatory in Odoo 17
Celine George
 
PIMS Job Advertisement 2024.pdf Islamabad
PIMS Job Advertisement 2024.pdf IslamabadPIMS Job Advertisement 2024.pdf Islamabad
PIMS Job Advertisement 2024.pdf Islamabad
AyyanKhan40
 
Your Skill Boost Masterclass: Strategies for Effective Upskilling
Your Skill Boost Masterclass: Strategies for Effective UpskillingYour Skill Boost Masterclass: Strategies for Effective Upskilling
Your Skill Boost Masterclass: Strategies for Effective Upskilling
Excellence Foundation for South Sudan
 
How to Manage Your Lost Opportunities in Odoo 17 CRM
How to Manage Your Lost Opportunities in Odoo 17 CRMHow to Manage Your Lost Opportunities in Odoo 17 CRM
How to Manage Your Lost Opportunities in Odoo 17 CRM
Celine George
 
LAND USE LAND COVER AND NDVI OF MIRZAPUR DISTRICT, UP
LAND USE LAND COVER AND NDVI OF MIRZAPUR DISTRICT, UPLAND USE LAND COVER AND NDVI OF MIRZAPUR DISTRICT, UP
LAND USE LAND COVER AND NDVI OF MIRZAPUR DISTRICT, UP
RAHUL
 
Digital Artefact 1 - Tiny Home Environmental Design
Digital Artefact 1 - Tiny Home Environmental DesignDigital Artefact 1 - Tiny Home Environmental Design
Digital Artefact 1 - Tiny Home Environmental Design
amberjdewit93
 
ISO/IEC 27001, ISO/IEC 42001, and GDPR: Best Practices for Implementation and...
ISO/IEC 27001, ISO/IEC 42001, and GDPR: Best Practices for Implementation and...ISO/IEC 27001, ISO/IEC 42001, and GDPR: Best Practices for Implementation and...
ISO/IEC 27001, ISO/IEC 42001, and GDPR: Best Practices for Implementation and...
PECB
 
Film vocab for eal 3 students: Australia the movie
Film vocab for eal 3 students: Australia the movieFilm vocab for eal 3 students: Australia the movie
Film vocab for eal 3 students: Australia the movie
Nicholas Montgomery
 
The History of Stoke Newington Street Names
The History of Stoke Newington Street NamesThe History of Stoke Newington Street Names
The History of Stoke Newington Street Names
History of Stoke Newington
 

Recently uploaded (20)

Hindi varnamala | hindi alphabet PPT.pdf
Hindi varnamala | hindi alphabet PPT.pdfHindi varnamala | hindi alphabet PPT.pdf
Hindi varnamala | hindi alphabet PPT.pdf
 
Chapter 4 - Islamic Financial Institutions in Malaysia.pptx
Chapter 4 - Islamic Financial Institutions in Malaysia.pptxChapter 4 - Islamic Financial Institutions in Malaysia.pptx
Chapter 4 - Islamic Financial Institutions in Malaysia.pptx
 
How to Add Chatter in the odoo 17 ERP Module
How to Add Chatter in the odoo 17 ERP ModuleHow to Add Chatter in the odoo 17 ERP Module
How to Add Chatter in the odoo 17 ERP Module
 
How to Build a Module in Odoo 17 Using the Scaffold Method
How to Build a Module in Odoo 17 Using the Scaffold MethodHow to Build a Module in Odoo 17 Using the Scaffold Method
How to Build a Module in Odoo 17 Using the Scaffold Method
 
বাংলাদেশ অর্থনৈতিক সমীক্ষা (Economic Review) ২০২৪ UJS App.pdf
বাংলাদেশ অর্থনৈতিক সমীক্ষা (Economic Review) ২০২৪ UJS App.pdfবাংলাদেশ অর্থনৈতিক সমীক্ষা (Economic Review) ২০২৪ UJS App.pdf
বাংলাদেশ অর্থনৈতিক সমীক্ষা (Economic Review) ২০২৪ UJS App.pdf
 
clinical examination of hip joint (1).pdf
clinical examination of hip joint (1).pdfclinical examination of hip joint (1).pdf
clinical examination of hip joint (1).pdf
 
Walmart Business+ and Spark Good for Nonprofits.pdf
Walmart Business+ and Spark Good for Nonprofits.pdfWalmart Business+ and Spark Good for Nonprofits.pdf
Walmart Business+ and Spark Good for Nonprofits.pdf
 
MARY JANE WILSON, A “BOA MÃE” .
MARY JANE WILSON, A “BOA MÃE”           .MARY JANE WILSON, A “BOA MÃE”           .
MARY JANE WILSON, A “BOA MÃE” .
 
A Independência da América Espanhola LAPBOOK.pdf
A Independência da América Espanhola LAPBOOK.pdfA Independência da América Espanhola LAPBOOK.pdf
A Independência da América Espanhola LAPBOOK.pdf
 
How to Create a More Engaging and Human Online Learning Experience
How to Create a More Engaging and Human Online Learning Experience How to Create a More Engaging and Human Online Learning Experience
How to Create a More Engaging and Human Online Learning Experience
 
Pengantar Penggunaan Flutter - Dart programming language1.pptx
Pengantar Penggunaan Flutter - Dart programming language1.pptxPengantar Penggunaan Flutter - Dart programming language1.pptx
Pengantar Penggunaan Flutter - Dart programming language1.pptx
 
How to Make a Field Mandatory in Odoo 17
How to Make a Field Mandatory in Odoo 17How to Make a Field Mandatory in Odoo 17
How to Make a Field Mandatory in Odoo 17
 
PIMS Job Advertisement 2024.pdf Islamabad
PIMS Job Advertisement 2024.pdf IslamabadPIMS Job Advertisement 2024.pdf Islamabad
PIMS Job Advertisement 2024.pdf Islamabad
 
Your Skill Boost Masterclass: Strategies for Effective Upskilling
Your Skill Boost Masterclass: Strategies for Effective UpskillingYour Skill Boost Masterclass: Strategies for Effective Upskilling
Your Skill Boost Masterclass: Strategies for Effective Upskilling
 
How to Manage Your Lost Opportunities in Odoo 17 CRM
How to Manage Your Lost Opportunities in Odoo 17 CRMHow to Manage Your Lost Opportunities in Odoo 17 CRM
How to Manage Your Lost Opportunities in Odoo 17 CRM
 
LAND USE LAND COVER AND NDVI OF MIRZAPUR DISTRICT, UP
LAND USE LAND COVER AND NDVI OF MIRZAPUR DISTRICT, UPLAND USE LAND COVER AND NDVI OF MIRZAPUR DISTRICT, UP
LAND USE LAND COVER AND NDVI OF MIRZAPUR DISTRICT, UP
 
Digital Artefact 1 - Tiny Home Environmental Design
Digital Artefact 1 - Tiny Home Environmental DesignDigital Artefact 1 - Tiny Home Environmental Design
Digital Artefact 1 - Tiny Home Environmental Design
 
ISO/IEC 27001, ISO/IEC 42001, and GDPR: Best Practices for Implementation and...
ISO/IEC 27001, ISO/IEC 42001, and GDPR: Best Practices for Implementation and...ISO/IEC 27001, ISO/IEC 42001, and GDPR: Best Practices for Implementation and...
ISO/IEC 27001, ISO/IEC 42001, and GDPR: Best Practices for Implementation and...
 
Film vocab for eal 3 students: Australia the movie
Film vocab for eal 3 students: Australia the movieFilm vocab for eal 3 students: Australia the movie
Film vocab for eal 3 students: Australia the movie
 
The History of Stoke Newington Street Names
The History of Stoke Newington Street NamesThe History of Stoke Newington Street Names
The History of Stoke Newington Street Names
 

Data Analysis

  • 2. Be very accurate and careful when working with the data Check Double-check Triple check Quadruple check Data Analysis
  • 3. The purpose a) To answer the research questions b) to help determine relationships among the variables.
  • 4. Steps in Data Analysis Before Data Collection After Data Collection
  • 5. Before Data Collection  Determine the method of data analysis  Determine how to process the data  Consult a statistician  Prepare dummy tables
  • 6.  Process the data  Prepare tables and graphs  Analyze and interpret findings  Consult again the statistician  Prepare for editing  Prepare for presentation After Data Collection
  • 7. Data Analysis Coding data write a code number on each completed questionnaire (unique identifier) Assign numbers to the response items If the question isn’t answered, leave the cell blank Calculating descriptive statistics
  • 9. Create a data base title https://www.wcasa.org/file_open.php?id=951
  • 10. Missing Data  Participants do not answer certain items on a questionnaire  it is not clear what the correct answer is  not be able to read the answer  they might have circled two responses  in pre- & post-test experiments, participants complete one phase of the study, such as the pre- test, but are absent for the second phase
  • 11. The items are reverse coded. Refers to the items that actually say the opposite of what was intended. For example, "I enjoy going to school” Strongly Disagreeing the other item is "I dislike school Strongly agreeing Reverse Coded Items
  • 12. Kinds of Data Analysis Descriptive Analysis Inferential Analysis
  • 13. Descriptive Statistics are numerical values obtained from the sample that gives meaning to the data collected. Descriptive Analysis  refers to the description of the data from a particular sample;  hence the conclusion must refer only to the sample  these summarize the data and describe sample characteristics
  • 15. Frequency the number of participants who indicated that category
  • 16. central tendency (averages) 1. Mode 2. Median 3. Mean
  • 17. variability Statistics that concern the degree to which the scores in a distribution are different from or similar to each other
  • 18. Inferential Analysis The use of statistical tests, either to test for significant relationships among variables or to find statistical support for the hypotheses. Inferential Statistics are numerical values that enable the researcher to draw conclusion about a population based on the characteristics of a population sample. 
  • 19. the researcher draws conclusions - or inferences - about the entire population based on the results from the sample.
  • 20. The purpose is to determine whether the findings from the sample can generalize - or be applied - to the entire population
  • 21. Inferential statistics is used to determine whether the difference between the two groups in the sample is large enough to be able to say that the findings are significant. If the findings are indeed significant, then the conclusions can be applied, or generalized, to the entire population. On the other hand, if the difference between the groups is very small, then the findings are not significant and therefore were simply in the result of chance.
  • 22. This p-value is the probability that the result is due to chance. The p-value can range from 0.000 to 1.000. The larger p is, the more likely the results are due to chance. If p is 0.50, the probability that the result is due to chance is 5 out of 10. A p of 0.850 means that the probability that the result is due to chance is 85 out of 100 The standard in research is that the p must be is less than 0.05 for the results to be significant.
  • 23. if the calculated p-value is less than 0.050, then the null hypothesis is rejected. If the statement "There is no significant difference" is rejected, this means that there is a significant difference. It can therefore be concluded that a difference exists between the two groups in the population, not just the sample.
  • 25. Create Tables and Figures  Every table must be discussed in the text.  Refer to tables by the table numbers only, not where they appear in reference to the text. This is acceptable: "As can be seen in Table 3..." This is not acceptable: "The table above shows..." The rationale for this rule is that the placement of the table may change when the final document is produced.  Readers should be able to interpret a table just by looking at the table, without reading the body of the research report itself. Therefore, each table should have a clear title that focuses on the key statistics within that table and all acronyms and abbreviations should be explained in the table notes.
  • 26. Rules  Table titles should be brief, but clearly explain the table.  All similar entries in the table should carry the same number of decimal points  Every entry within the same column should have the same number of decimal places.
  • 27. P-values & correlations should be rounded to three decimal places (thousandths place value) All other numbers (means, standard deviations, t- values, F-values) should carry two decimal places (hundredths place value). If you are not the original author of the table, you must cite the source of the table in a note at the bottom.
  • 28. Once the tables have been placed in the text, number the tables starting from 1 in the order that they appear in the work. The decimal points must be lined up in each of the columns. This makes the table easier to read. Tables typically have a horizontal rule at the top, bottom, and after the table labels. Vertical lines are rarely used according to APA regulations
  • 29. Figures • Graphs effectively illustrate means, frequencies, and percentages • figures should also be fully understandable without reading the text, but also be referenced in the text • Figures should also be numbered consecutively • Notes should be included so the reader can easily interpret the figure • Figures do not have titles • A caption or legend at the bottom of the figure functions both as a title and an explanation of the
  • 30.
  • 31.
  • 32. The Results section should be structured around: • the demographics of the participants • reviewing the purpose of the study • answer each Research Question one by one • Explain the statistic used to answer the Research questions • Explain the measurement of each variable • Present the statistics in a Table or Figure • Interpret the statistics.
  • 33. Errors in reporting of the Results: A lack of clear reporting: Numbers are reported in a table, but it is unclear how the numbers were calculated based on the items from the questionnaire The statistics are not thoroughly explained: Research hypotheses particularly need a detailed explanation to interpret the key findings. To repeat all statistics from the Table/Figure in the body of the text.