Downloaded 662 times
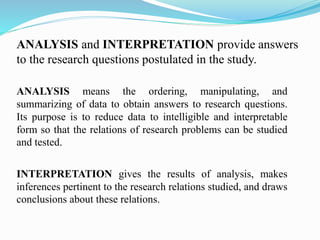
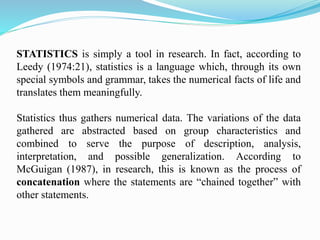
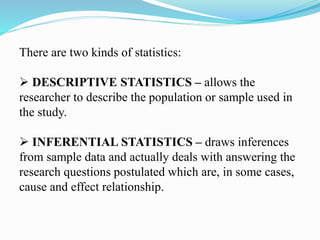


The document discusses various statistical analysis methods and their purposes. It defines descriptive statistics as methods used to describe characteristics of a population or sample, such as measures of central tendency, dispersion, location, and distribution. Inferential statistics draw inferences from samples to make generalizations about populations. The document outlines specific descriptive and inferential statistical tests for both parametric and nonparametric data, and explains that the appropriate statistical method depends on the research problem and level of measurement used in a study.


