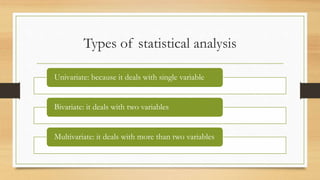
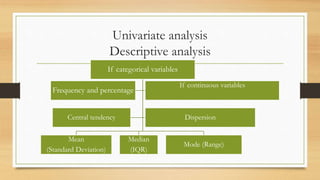
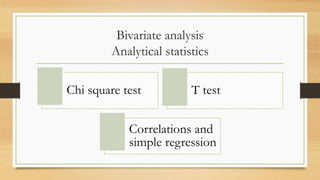
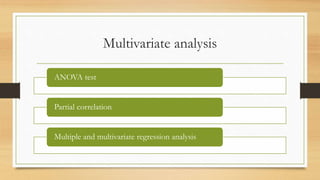
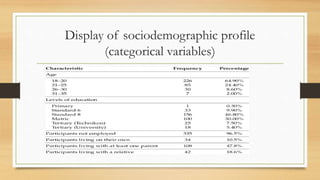
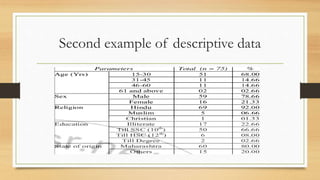
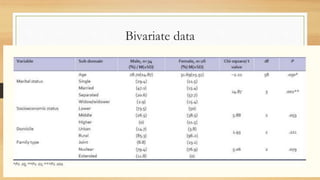
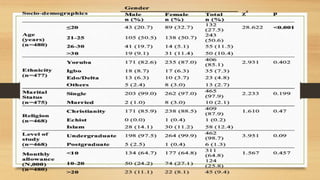
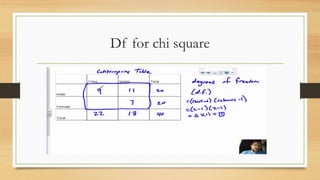
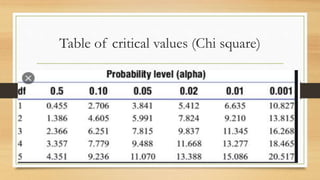
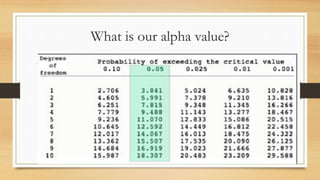
Univariate and Bivariate
Analysis
Dr. Rajeev Kumar,
M.S.W (TISS, Mumbai), M.Phil. (CIP, Ranchi), UGC-JRF, Ph.D. (IIT
Kharagpur)
Visiting Faculty, RKMVERI, Ranchi
Lecture-6: Research Methodology (Descriptive and inferential statistics
After data collection
We need to define the type of variables from the collected data.
Based on the type of variables, we choose the appropriate statistical analysis
Types of statistical analysis
Univariate: because it deals with single variable
Bivariate: it deals with two variables
Multivariate: it deals with more than two variables
Univariate analysis
Descriptive analysis
If categorical variables
Mean
(Standard Deviation)
Median
(IQR)
Mode (Range)
Frequency and percentage
If continuous variables
Central tendency Dispersion
Bivariate analysis
Analytical statistics
Chi square test T test
Correlations and
simple regression
Multivariate analysis
ANOVA test
Partial correlation
Multiple and multivariate regression analysis
How to interpret the statistical result?
Few examples
• How the statistical results are displayed?
Display of sociodemographic profile
(categorical variables)
Second example of descriptive data
Tables from research articles
https://www.ncbi.nlm.nih.gov/pmc/articles/PMC3105560/
Bivariate data
How to read these tables
• We have to understand
• What is DF (degree of freedom?
• What is your ά alpha value?
• What is p ( probability)?
• What is the critical value?
• What is the test value ?
What is df
• Degree of freedom: The number of observation, which are free to vary or
change.
Df for chi square
Table of critical values (Chi square)
What is our alpha value?
Now find out if your result is significant?
Exercise-1
• Please find out the DF (degree of freedom)
• If one table has 5 column and 3 rows=
• If table has 3 rows and 4 column =
• If 3 column and 2 rows=
• 3 column and 3 rows=
• 2 column and 2 rows=
Exercise-2
• In one chi square analysis, df=2, Chi square χ2 = 4.03, tell me if this result is
significant at .05? Whether this result is significant at .01 and .001?
• In one survey the result of pass and fail was compared between male and
female candidates, the chi square result reveals, df=1, χ2=1.89 now find out,
whether this result is significant at p ≤0.05, p ≤ 0.01, and p ≤0.001
• In a chi square result, in the table, there were 4 columns and 4 rows.
Calculate its degree of freedom. The test value of χ2 = 45.88, please
evaluate this result at p ≤0.05, p ≤ 0.01, and p ≤0.001
Use this table again
Exercise-3:
Now evaluate the chi square results
Thanks for your attention
keep learning!!!

Lecture 6. univariate and bivariate analysis

  • 1.
    Univariate and Bivariate Analysis Dr.Rajeev Kumar, M.S.W (TISS, Mumbai), M.Phil. (CIP, Ranchi), UGC-JRF, Ph.D. (IIT Kharagpur) Visiting Faculty, RKMVERI, Ranchi Lecture-6: Research Methodology (Descriptive and inferential statistics
  • 2.
    After data collection Weneed to define the type of variables from the collected data. Based on the type of variables, we choose the appropriate statistical analysis
  • 3.
    Types of statisticalanalysis Univariate: because it deals with single variable Bivariate: it deals with two variables Multivariate: it deals with more than two variables
  • 4.
    Univariate analysis Descriptive analysis Ifcategorical variables Mean (Standard Deviation) Median (IQR) Mode (Range) Frequency and percentage If continuous variables Central tendency Dispersion
  • 5.
    Bivariate analysis Analytical statistics Chisquare test T test Correlations and simple regression
  • 6.
    Multivariate analysis ANOVA test Partialcorrelation Multiple and multivariate regression analysis
  • 7.
    How to interpretthe statistical result? Few examples • How the statistical results are displayed?
  • 8.
    Display of sociodemographicprofile (categorical variables)
  • 9.
    Second example ofdescriptive data
  • 10.
    Tables from researcharticles https://www.ncbi.nlm.nih.gov/pmc/articles/PMC3105560/
  • 11.
  • 13.
    How to readthese tables • We have to understand • What is DF (degree of freedom? • What is your ά alpha value? • What is p ( probability)? • What is the critical value? • What is the test value ?
  • 14.
    What is df •Degree of freedom: The number of observation, which are free to vary or change.
  • 15.
    Df for chisquare
  • 16.
    Table of criticalvalues (Chi square)
  • 17.
    What is ouralpha value?
  • 18.
    Now find outif your result is significant?
  • 19.
    Exercise-1 • Please findout the DF (degree of freedom) • If one table has 5 column and 3 rows= • If table has 3 rows and 4 column = • If 3 column and 2 rows= • 3 column and 3 rows= • 2 column and 2 rows=
  • 20.
    Exercise-2 • In onechi square analysis, df=2, Chi square χ2 = 4.03, tell me if this result is significant at .05? Whether this result is significant at .01 and .001? • In one survey the result of pass and fail was compared between male and female candidates, the chi square result reveals, df=1, χ2=1.89 now find out, whether this result is significant at p ≤0.05, p ≤ 0.01, and p ≤0.001 • In a chi square result, in the table, there were 4 columns and 4 rows. Calculate its degree of freedom. The test value of χ2 = 45.88, please evaluate this result at p ≤0.05, p ≤ 0.01, and p ≤0.001
  • 21.
  • 22.
    Exercise-3: Now evaluate thechi square results
  • 23.
    Thanks for yourattention keep learning!!!