1. Descriptive statistics provide a simple summary of data through measures of central tendency, frequency, and variability.
2. Common measures include the mean, median, mode, standard deviation, and outliers.
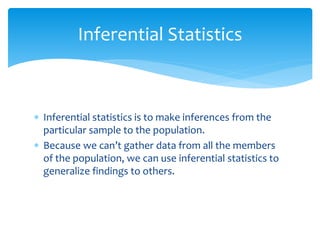
3. Inferential statistics allow researchers to make generalizations about populations based on analyses of samples. They include t-tests, ANOVA, correlation, and regression.